15 Google Analytics tips to supercharge your WordPress site! Unlocking the secrets of your website traffic and user behavior is crucial for growth. This guide dives deep into essential metrics, audience insights, and conversion optimization strategies to help you make data-driven decisions. We’ll cover everything from setting up your Google Analytics account to understanding advanced analytics, empowering you to transform your WordPress site into a high-performing machine.
From basic setup to advanced techniques, this comprehensive guide will walk you through 15 actionable tips to maximize your Google Analytics data and improve your WordPress site’s performance. We’ll explore how to use the data to understand your audience, boost engagement, and ultimately, achieve your business goals.
Introduction to Google Analytics
Google Analytics is a free web analytics service offered by Google that tracks and reports website traffic. It provides a comprehensive view of user behavior on a website, helping businesses understand how visitors interact with their online presence. Essentially, it’s a powerful tool for gaining insights into website performance and optimizing online strategies. Understanding visitor behavior, from initial landing pages to final actions, is crucial for informed decision-making in the digital realm.Effective use of Google Analytics is paramount for businesses seeking to thrive in the digital marketplace.
It’s not just about tracking numbers; it’s about translating data into actionable strategies. By identifying patterns and trends, businesses can optimize their website, improve user experience, and ultimately boost conversions and revenue. A deep understanding of visitor behavior allows for personalized marketing campaigns, targeted advertising, and strategic adjustments to website design. This leads to increased efficiency and profitability.
Core Purpose of Google Analytics
Google Analytics serves as a central hub for gathering and analyzing data related to website traffic and user behavior. This data, when interpreted correctly, reveals crucial insights into the effectiveness of marketing campaigns, the design of web pages, and the overall user experience. It empowers businesses to make data-driven decisions, allowing them to tailor their online strategies for maximum impact.
I’ve been diving deep into 15 Google Analytics tips lately, and it’s fascinating how much data you can unlock. Understanding user behavior is key, and a critical component of that is visual appeal. Hero images are surprisingly powerful, influencing decisions quickly. For instance, learning how to craft hero images that boost conversions can dramatically improve your website’s performance.
hero images that boost conversions are a great way to optimize your site’s visuals. Ultimately, combining the insights from these 15 Google Analytics tips with compelling visuals will give you a much clearer picture of your audience’s needs.
Key Benefits for Businesses
Implementing Google Analytics provides numerous advantages for businesses of all sizes. It facilitates a deeper understanding of customer behavior, enabling targeted marketing efforts and improved user experience. This translates into increased conversions, higher revenue, and a stronger online presence. The insights gleaned from Google Analytics empower businesses to optimize their online strategies, identify areas for improvement, and ultimately achieve greater success in the digital landscape.
Core Metrics in Google Analytics
Understanding the key metrics in Google Analytics is crucial for interpreting the data effectively. These metrics provide a snapshot of website performance, user behavior, and the overall effectiveness of online strategies. The table below Artikels some of the most important metrics.
| Metric | Description | Importance |
|---|---|---|
| Sessions | A session is a group of interactions with your website within a given time frame. | Provides a high-level view of website activity. A high number of sessions indicates significant visitor engagement. |
| Users | Unique individuals who interact with your website during a specific period. | Measures the number of distinct visitors. A growing user base signifies increased interest and potential for growth. |
| Bounce Rate | Percentage of single-page visits where users don’t interact further. | Indicates how well your website content engages visitors. A high bounce rate suggests possible issues with content or navigation. |
| Conversion Rate | Percentage of website visitors who complete a desired action (e.g., making a purchase). | Measures the effectiveness of your website in achieving desired outcomes. A higher conversion rate signifies greater success. |
| Average Session Duration | The average time spent by a user on your website during a session. | Reflects the overall engagement with your website. A longer average session duration suggests that visitors find your content valuable and interesting. |
Setting Up Your Google Analytics Account
Getting started with Google Analytics requires careful setup to accurately track website or app performance. A well-configured account provides valuable insights into user behavior, allowing for data-driven decisions to optimize your online presence. This section will guide you through the steps to create and configure your Google Analytics account, ensuring you’re collecting the right data for informed analysis.Proper setup is crucial for extracting meaningful insights from your Google Analytics data.
Without accurate tracking, you’ll be working with incomplete or inaccurate information, hindering your ability to understand user behavior and improve your website or app. This detailed explanation will cover the essential steps, from account creation to tracking code implementation, ensuring you’re ready to leverage the power of Google Analytics.
Account Creation and Property Setup
Setting up a Google Analytics account involves creating a new account and then setting up a property to represent your website or app. This process ensures that your data is organized and readily accessible. A well-defined property allows for specific tracking and analysis of different website or app segments.First, create a new Google Analytics account. This involves providing account information and agreeing to the terms of service.
I’ve been diving deep into 15 Google Analytics tips lately, and it got me thinking about the broader Google ecosystem. It’s fascinating to see how many products Google has launched and, well, let’s just say, some didn’t quite hit the mark. Have you ever considered how some ventures just didn’t stick? Exploring Google’s past failures, like those listed on google products that failed , provides valuable context for understanding the strengths and weaknesses of the current suite of tools.
Ultimately, though, mastering the 15 Google Analytics tips is still key to making the most of Google’s powerful analytics platform.
Next, create a new property. This step involves specifying the website or app you want to track. Be precise about the type of website or app (e.g., e-commerce, blog, mobile app).
Tracking Code Implementation
The tracking code is the heart of Google Analytics, enabling data collection. Different types of tracking codes cater to various needs. Understanding the appropriate tracking code for your platform is essential.
- Universal Analytics (UA) Tracking Code: This is a widely used tracking code for websites. It involves embedding a snippet of JavaScript code into the website’s HTML. This code sends data to Google Analytics, allowing you to track user interactions on your website.
- Global Site Tag (gtag.js): This is a newer, more flexible tracking method for websites. It allows for more granular control over data collection and is generally recommended for modern websites. It involves including the gtag.js script on your website and configuring the necessary parameters.
- Firebase SDK: This is a powerful tool for collecting data from mobile apps, offering extensive tracking capabilities. It allows for the measurement of app usage, user engagement, and other key metrics. The Firebase SDK must be integrated into the app’s code.
Platform-Specific Tracking Code Implementation
The appropriate tracking code implementation varies based on the platform. This table Artikels the common implementations for different platforms.
| Platform | Tracking Code | Implementation Details |
|---|---|---|
| Website (using Universal Analytics) | Universal Analytics Tracking Code | Embed the tracking code snippet in the `` section of your website’s HTML. Ensure it’s placed before the closing `` tag. |
| Website (using gtag.js) | gtag.js | Include the gtag.js script in the `` section of your website’s HTML. Configure the necessary tracking parameters. |
| Mobile App (using Firebase) | Firebase SDK | Integrate the Firebase SDK into your mobile app’s code. Follow the specific instructions for your mobile platform (e.g., Android, iOS). |
Essential Metrics and Reports
Understanding the key metrics and reports in Google Analytics is crucial for analyzing website performance and making data-driven decisions. This section dives into the vital information Google Analytics provides, from basic traffic analysis to creating custom reports tailored to your specific needs. We’ll explore the significance of each metric and how to interpret them effectively.Analyzing website traffic reveals patterns, identifies strengths and weaknesses, and ultimately helps optimize your website’s effectiveness.
By understanding user behavior and engagement, you can fine-tune your strategy to maximize conversions and achieve your business goals.
Key Metrics for Website Analysis
Website traffic analysis is fundamental to understanding how users interact with your site. It reveals valuable insights into user behavior, engagement, and ultimately, the effectiveness of your website. This understanding is critical for optimizing various aspects, from content strategy to user experience. Key metrics help you track progress and identify areas for improvement.
- Pageviews: The number of times a page on your website is viewed. This is a fundamental metric for assessing content popularity and user interest. High pageviews for specific pages might indicate engaging content, while low pageviews could signal the need for improvement in those areas.
- Unique Visitors: The number of distinct individuals who visit your website. This metric provides insight into the reach and effectiveness of your marketing campaigns and the overall size of your audience.
- Bounce Rate: The percentage of visitors who leave your website after viewing only one page. A high bounce rate can indicate issues with page content, navigation, or relevance to user needs.
- Average Session Duration: The average time visitors spend on your website during a single session. This metric helps assess the engagement level of your content and overall user experience.
- Conversion Rate: The percentage of visitors who complete a desired action, such as making a purchase or filling out a form. This is a critical metric for evaluating the effectiveness of your website in achieving business objectives.
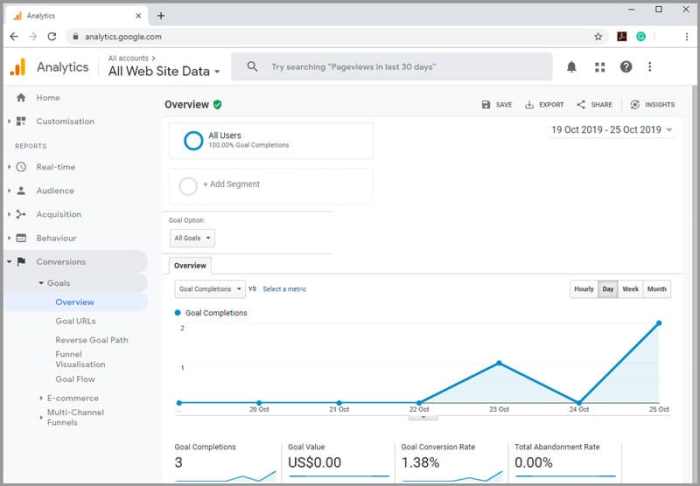
Essential Google Analytics Reports
Google Analytics offers various reports to provide comprehensive insights into website performance. These reports offer structured data for better analysis and decision-making. Understanding these reports is crucial for monitoring website performance and identifying trends.
- Audience Report: This report provides information about your website visitors, including demographics, interests, and geographic location. This data helps understand your target audience and tailor your content accordingly.
- Acquisition Report: This report tracks how users find your website, such as through search engines, social media, or referrals. Understanding the acquisition channels allows you to optimize your marketing strategies.
- Behavior Report: This report details user behavior on your website, including page views, bounce rate, and time on site. This report provides insights into how users interact with different pages and content.
- Conversions Report: This report tracks the progress of goals and conversions, helping to understand how well your website achieves desired outcomes. This crucial report allows you to optimize your website’s effectiveness in achieving specific business objectives.
Creating Custom Reports in Google Analytics
Custom reports allow you to tailor data visualization to specific needs. By combining different metrics and dimensions, you can gain more detailed insights. These custom reports provide a deeper understanding of website performance.
- Select Dimensions and Metrics: Choose the specific data points you want to analyze. This allows you to focus on the relevant information for your needs.
- Customize Report Structure: Organize data in a way that best suits your analysis. This could involve grouping data by date ranges, user segments, or specific channels.
- Save Custom Reports: Save your custom reports for future reference and easy access. This streamlines analysis and tracking of important trends over time.
Common Metrics Categorization
The following table categorizes common metrics into Acquisition, Behavior, and Conversions:
| Category | Metric | Description |
|---|---|---|
| Acquisition | Channels | Sources of website traffic (e.g., search engines, social media). |
| Acquisition | Source/Medium | Specific platforms driving traffic (e.g., Google/organic, Facebook/social). |
| Behavior | Pageviews | Number of times a page is viewed. |
| Behavior | Bounce Rate | Percentage of visitors leaving after viewing only one page. |
| Behavior | Average Session Duration | Average time spent on the website per session. |
| Conversions | Conversion Rate | Percentage of visitors completing a desired action. |
| Conversions | Goal Completions | Number of times users achieve a specific goal (e.g., making a purchase). |
Understanding Audience Insights
Unveiling your audience’s characteristics and behaviors is crucial for tailoring your marketing strategies and optimizing your website’s performance. Google Analytics provides powerful tools to understand your audience, allowing you to personalize your approach and maximize engagement. Knowing your audience allows you to create content that resonates with their interests, leading to higher conversion rates and brand loyalty.Delving deeper into your audience’s demographics, interests, location, and behavior patterns helps you understand their needs and preferences.
This understanding can be leveraged to refine your website design, marketing campaigns, and overall business strategy, leading to improved results.
Segmenting Your Audience Effectively
Understanding your audience’s diverse characteristics is vital for targeted marketing. Effective segmentation allows you to tailor your content and messaging to specific groups, maximizing engagement and conversion rates. Analyzing data across various segments enables you to identify key trends and optimize your strategy for optimal performance.
- Define specific criteria for your segments. Consider factors like age, location, interests, and website behavior. For instance, you might segment users based on their purchase history or the pages they visit most frequently.
- Utilize Google Analytics’ built-in segmentation features. Create custom segments based on your defined criteria. This allows for granular analysis, revealing valuable insights into the behavior of different user groups.
- Regularly review and refine your segments. The needs and behaviors of your audience are constantly evolving. Adjust your segmentation strategies accordingly to reflect these changes, ensuring your marketing remains effective and responsive to user needs.
Analyzing User Demographics and Interests
Understanding the demographic makeup of your audience is fundamental for effective marketing. This information helps you tailor your messaging and products to resonate with your target audience, ultimately increasing conversion rates. Demographics, such as age, gender, and location, provide valuable insights into the characteristics of your users.
- Google Analytics offers detailed demographic data, including age, gender, and interests. Analyze this data to understand the characteristics of your users.
- Identify common interests among different user segments. Understanding shared interests helps you tailor content and promotions to specific groups, increasing engagement and driving conversions.
- Leverage this information to personalize your marketing campaigns and website content. This targeted approach resonates better with your audience, improving engagement and conversion rates.
Leveraging Geographic Data to Understand User Location
Geographic data provides valuable insights into where your users are located. This information helps you understand the regional preferences and needs of your audience. You can tailor your content and marketing strategies to specific geographic regions.
- Analyze user location data to understand regional preferences. This knowledge can help you tailor your website content and marketing campaigns to resonate better with users in specific regions.
- Identify popular regions or countries that drive the most engagement or conversions. This information allows you to focus your marketing efforts on high-performing areas.
- Understand the impact of geographic location on user behavior. This knowledge allows you to tailor your website content and marketing strategies to better meet the needs of your users in different regions.
Identifying User Behavior Patterns
Identifying patterns in user behavior is essential for optimizing your website and improving user experience. Understanding how users interact with your website helps you identify areas for improvement. This knowledge allows you to create a more engaging and user-friendly experience, leading to increased conversions and customer satisfaction.
- Analyze user journeys to understand how users navigate your website. Identify points of friction or drop-off in the user journey to optimize the experience.
- Track key metrics like bounce rate, session duration, and pages per session to gain a comprehensive understanding of user behavior.
- Use this information to identify trends and areas for improvement in your website’s design and functionality.
Different Audience Segments and Their Characteristics
The table below illustrates examples of audience segments and their characteristics. This is a simplified example and actual segments will vary depending on your business.
| Segment | Age Range | Interests | Location | Behavior |
|---|---|---|---|---|
| Young Professionals | 25-35 | Technology, finance, travel | Urban areas | High engagement on blog posts, product demos |
| Families | 25-45 | Parenting, education, family activities | Suburban areas | Frequent product comparisons, educational content |
| Senior Citizens | 65+ | Health, wellness, travel, entertainment | Rural areas, urban areas | Engaged with educational content, reliable information |
Optimizing Website Content Based on Data
Unlocking the secrets of your website’s performance is key to success. Google Analytics provides invaluable insights into how visitors interact with your content. Understanding user behavior allows you to identify what resonates and what falls flat, empowering you to create content that truly engages your audience.By meticulously analyzing user data, you can fine-tune your content strategy, leading to higher engagement, conversions, and ultimately, a more profitable website.
This section dives into the critical link between data-driven decisions and content optimization, enabling you to craft content that truly connects with your target audience.
Analyzing User Behavior and Content Performance
Understanding user behavior is crucial for optimizing website content. Analyzing bounce rates, time on page, and click-through rates reveals patterns in how visitors interact with your content. These metrics offer insights into what aspects of your content are effective and where improvements are needed. For example, a high bounce rate on a specific page might indicate a lack of relevance, unclear calls to action, or poor page loading speed.
Identifying Underperforming Content and Suggesting Improvements
Identifying underperforming content is the first step in the optimization process. Google Analytics allows you to pinpoint specific pages or posts that are not attracting the desired engagement. Look for pages with low session durations, high bounce rates, and low conversion rates. These are potential candidates for improvement.Once you’ve identified underperforming content, consider these improvement strategies:
- Content Refresh: Update outdated information, add new visuals, or revise existing content to address potential relevance issues.
- Improved Clarity and Structure: Ensure clear headings, concise paragraphs, and a logical flow. Consider using bullet points, numbered lists, or visuals to improve readability.
- Enhanced Call to Action (CTA): Strengthen calls to action by making them more compelling and prominent. Ensure CTAs are relevant to the content and align with the user’s likely intent.
- Mobile Optimization: Ensure your content displays correctly on various devices and screen sizes. A poor mobile experience can lead to high bounce rates.
- Optimization: Optimize content with relevant s to improve search engine visibility. Use Google Search Console to identify potential opportunities.
Strategies for Creating Engaging and Valuable Content
Creating content that resonates with your target audience requires a deep understanding of their needs and interests. Consider these strategies:
- In-depth Research: Understand your target audience’s pain points, interests, and preferences to create content that addresses their needs effectively.
- Focus on Value: Provide valuable information, insights, or solutions that address user questions and offer unique perspectives.
- High-Quality Visuals: Incorporate compelling images, videos, or infographics to enhance engagement and make the content more appealing.
- Interactive Elements: Engage users with interactive elements like quizzes, polls, or surveys to enhance their experience and encourage participation.
- Promote Content Effectively: Use social media, email marketing, and other channels to effectively promote your content to reach a wider audience.
Comparing Different Content Types and Their Performance
A comparative analysis of content types can help you understand which formats resonate most with your audience.
| Content Type | Potential Performance Indicators | Examples |
|---|---|---|
| Blog Posts | High engagement (time on page), potential for backlinks | Industry news, how-to guides, product reviews |
| Product Pages | High conversion rates (purchases), potentially low time on page | Detailed product descriptions, high-quality images, clear call-to-actions |
| Landing Pages | High conversion rates (leads, sign-ups), focused on specific offers | Lead generation forms, promotional offers, product demos |
| Videos | High engagement (watch time), potential for social sharing | Explainer videos, product demonstrations, tutorials |
Conversion Tracking and Optimization
Unleashing the power of your website data goes beyond just observing traffic; it’s about understanding how visitors interact with your site and ultimately achieve your goals. Conversion tracking is the key to unlocking this actionable insight, allowing you to pinpoint what works, what doesn’t, and how to optimize your website for maximum results. This crucial step allows you to refine your marketing strategies and improve your bottom line.Conversion tracking is a multifaceted process that demands meticulous planning and execution.
It’s not just about counting clicks; it’s about understanding the entire journey a visitor takes before converting, from initial landing page interaction to the final action you want them to perform. This deeper understanding leads to smarter optimizations and more effective marketing campaigns.
Setting Up Conversion Tracking
Conversion tracking involves implementing specific codes or tags on your website to monitor actions that signify a conversion. This allows you to see how your website performs in relation to your business goals. Google Analytics provides robust tools for setting up conversion tracking, enabling you to pinpoint specific actions. The process typically involves creating conversion goals within your Google Analytics account, assigning them unique IDs, and then implementing the necessary tracking code on your website.
This process is often streamlined through the use of pre-built templates or custom implementations, making it adaptable to different business needs.
Different Types of Conversions
Conversions encompass a wide range of actions, from simple lead generation to complex sales transactions. Understanding the different types of conversions is crucial for tailoring your tracking and analysis.
- Sales: This represents the ultimate conversion, where a visitor completes a purchase. Monitoring sales conversions allows for a direct measurement of revenue generation.
- Leads: This includes capturing contact information (email addresses, phone numbers, etc.). Tracking lead generation allows you to gauge the effectiveness of your marketing efforts in nurturing potential customers.
- Downloads: This encompasses tracking the download of valuable resources like ebooks, white papers, or software trials. It signifies visitor interest and can be used to gauge the appeal of your content.
- Registrations: This covers actions like signing up for newsletters, webinars, or creating accounts. Tracking registrations allows you to measure the growth of your subscriber base and engagement.
Tracking and Analyzing Conversion Rates
Conversion rate is a critical metric calculated by dividing the number of conversions by the number of website visitors. Understanding your conversion rate provides a clear picture of your website’s effectiveness in driving desired outcomes.Conversion rates can be analyzed across different aspects of your website, such as specific landing pages, marketing campaigns, or user journeys. A deeper analysis often involves segmenting your data to identify patterns and understand variations across different user groups.
This data-driven approach allows for informed decisions regarding website improvements and marketing strategies.
Optimizing the Conversion Funnel
Optimizing the conversion funnel involves identifying and addressing bottlenecks in the process that prevent visitors from converting. Understanding where visitors drop off allows for targeted improvements to specific stages. Aligning your website’s design, content, and calls-to-action with your target audience’s needs is crucial for a smooth conversion funnel.
- Landing Pages: Ensure your landing pages are clear, concise, and compelling. The use of compelling visuals, persuasive language, and clear calls-to-action can increase conversion rates.
- Content: Relevant and engaging content can significantly influence conversion rates. High-quality content can educate and inform visitors, leading them to convert.
- Call-to-Actions (CTAs): Clear and prominent CTAs are essential for guiding visitors toward desired actions. Using compelling language and strategic placement can drive conversions.
Conversion Goals and Metrics
A table outlining various conversion goals and their associated metrics is presented below. This table provides a structured overview of different types of conversions and the metrics used to evaluate their success.
| Conversion Goal | Associated Metric |
|---|---|
| Sales | Revenue, Average Order Value, Conversion Rate |
| Lead Generation | Number of Leads, Lead Qualification Rate, Cost Per Lead |
| Downloads | Number of Downloads, Download Completion Rate |
| Registrations | Number of Registrations, Registration Completion Rate, Signup Rate |
Mobile App Tracking and Analysis: 15 Google Analytics Tips
Unlocking the secrets of your mobile app’s performance is crucial for growth. Google Analytics provides a powerful toolkit to understand user behavior within your app, enabling data-driven decisions to optimize user experience and drive engagement. This section dives into the specifics of mobile app tracking, empowering you to leverage this data for improvement.
Overview of Mobile App Tracking in Google Analytics
Google Analytics offers a dedicated suite of features for mobile app tracking, allowing you to monitor user interactions, identify key metrics, and pinpoint areas for optimization. This goes beyond simple website analytics, focusing on the nuances of app usage patterns. Understanding how users navigate, interact, and ultimately use your app is critical to success.
Tracking User Engagement Within a Mobile App
User engagement within a mobile app is measured by various actions. These actions include the time spent in the app, the frequency of app openings, the number of screens viewed, and the completion of specific tasks. Monitoring these metrics helps you understand user interest and commitment.
Identifying Key User Actions Within an App, 15 google analytics tips
Identifying key user actions, such as completing a purchase, signing up for a service, or interacting with specific features, is vital. These actions often represent crucial milestones in the user journey. Tracking these conversions and interactions provides critical insights into how users progress through your app and achieve their goals. For instance, a successful onboarding process might be indicated by the completion of a tutorial.
Strategies for Optimizing App Performance Based on Data
Optimizing app performance relies on a comprehensive analysis of the collected data. Identifying areas of high user drop-off, understanding where users spend the most time, and analyzing the frequency of app crashes, can reveal bottlenecks in the user experience. Identifying the most frequent errors and fixing them will enhance the app’s reliability. A/B testing different app features based on user engagement data will inform decision-making for continuous improvement.
Key Differences Between Website and Mobile App Tracking
| Feature | Website Tracking | Mobile App Tracking |
|---|---|---|
| Data Source | Browser interactions (page views, clicks) | App interactions (events, sessions, in-app purchases) |
| Tracking Method | JavaScript code embedded in website pages | Specific SDKs (software development kits) integrated into the app |
| Key Metrics | Page views, bounce rate, conversion rates | App opens, session duration, engagement rate, user retention |
| Data Collection | Browser data transmitted to Google Analytics servers | App data transmitted to Google Analytics servers via the SDK |
| Data Analysis | Focus on user behavior on web pages | Focus on user behavior within the app itself |
Utilizing Google Analytics for Marketing Campaigns
Unlocking the power of Google Analytics for your marketing campaigns is crucial for understanding their effectiveness and optimizing your return on investment. By meticulously tracking campaign performance, you can gain valuable insights into what resonates with your audience and refine your strategies for maximum impact. This allows for a data-driven approach to marketing, ensuring that your efforts are aligned with your business goals.This section delves into how to effectively leverage Google Analytics to monitor marketing campaigns, associate campaign data with analytics, measure ROI, and develop effective strategies.
We’ll explore the metrics that matter most and provide practical examples of how to interpret and apply this data.
Tracking Campaign Performance
Understanding the performance of your marketing campaigns is paramount to making informed decisions. Effective tracking allows you to assess the success of each initiative, identify areas for improvement, and allocate resources more strategically. Google Analytics provides a comprehensive platform to track campaign performance across various channels, enabling you to understand which campaigns are driving the most conversions and user engagement.
Associating Campaign Data with Analytics
Precisely associating campaign data with your Google Analytics account is essential for accurate performance measurement. This allows you to discern the impact of each campaign on key metrics. By implementing UTM parameters, you can attach unique identifiers to your marketing links, enabling the system to track and attribute conversions to specific campaigns. This ensures that the data collected accurately reflects the performance of each marketing initiative.
Measuring the ROI of Marketing Efforts
Calculating the return on investment (ROI) for your marketing campaigns is critical for demonstrating their value and justifying future spending. By tracking key metrics like cost per acquisition (CPA) and conversion rates, you can determine the profitability of each campaign. For example, if a campaign costs $1,000 and generates $5,000 in revenue, the ROI is substantial. This quantitative analysis is essential for allocating resources efficiently and focusing on high-performing strategies.
Effective Marketing Strategies Informed by Data
Data-driven strategies are essential for maximizing marketing effectiveness. By analyzing the performance of your campaigns, you can identify trends, pinpoint areas needing improvement, and optimize your campaigns for better results. For instance, if a particular social media campaign performs exceptionally well, you can replicate its successful elements in future initiatives. You can also leverage data to understand which channels are most effective for your target audience and tailor your strategies accordingly.
Breakdown of Campaign Types and Corresponding Metrics
Different marketing campaigns have unique characteristics, necessitating different tracking metrics. The table below illustrates the key metrics for various campaign types:
| Campaign Type | Key Metrics |
|---|---|
| Social Media Ads | Reach, engagement (likes, shares, comments), click-through rate (CTR), conversions |
| Search Engine Marketing (SEM) | Cost per click (CPC), conversion rate, quality score, impressions, clicks |
| Email Marketing | Open rate, click-through rate, conversion rate, unsubscribe rate |
| Content Marketing | Website traffic, time on site, pages per visit, bounce rate, lead generation |
Advanced Analytics and Segmentation
Google Analytics offers powerful advanced features that go beyond basic reporting. These tools allow you to delve deeper into user behavior, segment audiences with greater precision, and ultimately make data-driven decisions for improved website performance. Understanding advanced analytics empowers you to identify nuanced trends and patterns often missed with basic metrics.Advanced analytics in Google Analytics unlocks a wealth of insights beyond the surface-level data.
By utilizing custom dimensions and metrics, you can tailor your reporting to capture specific details about your users and their interactions, leading to more accurate and actionable interpretations of website performance. Advanced segmentation techniques allow for creating highly targeted user groups, enabling tailored marketing campaigns and optimized content strategies.
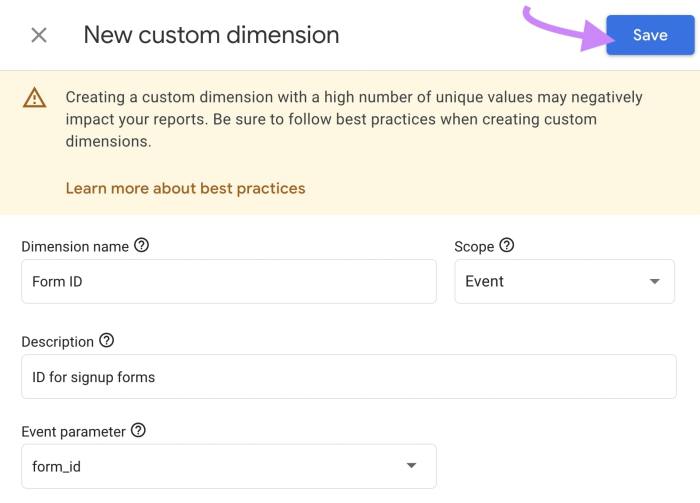
Custom Dimensions and Metrics
Custom dimensions and metrics are crucial for capturing specific information about user behavior that’s not already tracked by default. This expanded data allows for a deeper understanding of user interactions and preferences. For example, if you want to track the specific type of content a user engages with, you can create a custom dimension to categorize this information.
Similarly, you can create a custom metric to track the number of times a user interacts with a specific feature on your website.Custom dimensions are valuable for classifying and organizing data. They extend the scope of your reporting by adding new categories or attributes to existing data points. Custom metrics, on the other hand, quantify user behavior by adding new numerical values to existing data points.
This provides additional insight into the depth of user interactions. Both custom dimensions and metrics significantly enhance your ability to analyze and understand user behavior in more detailed and meaningful ways.
Learning 15 Google Analytics tips is crucial for understanding your audience and optimizing your online presence. However, it’s equally important to be mindful of the legal implications of your marketing strategies. For example, ensuring compliance with data privacy regulations, like GDPR, CCPA, and others, is paramount. Navigating these complexities is vital, and understanding the legal issues facing online marketers can help avoid costly mistakes.
Legal issues facing online marketers are a crucial part of the broader picture, and these 15 tips will help you succeed within the boundaries of the law. So, mastering these 15 tips is a step toward better marketing, both legally and effectively.
Advanced Segmentation Techniques
Advanced segmentation techniques are essential for identifying specific user groups. These groups can be tailored to specific demographics, behaviors, or interactions, enabling more focused and effective marketing efforts. Segmentation empowers you to pinpoint user segments who demonstrate particular behavior patterns, such as frequent purchasers or users who abandon their carts.Creating advanced segments in Google Analytics involves combining multiple conditions.
You can combine different dimensions and metrics, such as location, device type, and page views, to create highly specific segments. These techniques empower you to isolate and analyze the behavior of specific user groups, allowing for the development of more targeted and personalized user experiences.
Comparing Basic and Advanced Segmentation
| Feature | Basic Segmentation | Advanced Segmentation |
|---|---|---|
| Data Granularity | Limited to pre-defined dimensions and metrics. | Captures specific user behaviors and interactions through custom dimensions and metrics. |
| Segment Creation | Uses predefined filters and segments. | Combines multiple conditions and filters for highly specific user groups. |
| Analysis Depth | Provides general insights into user behavior. | Uncovers nuanced patterns and trends within specific user groups. |
| Actionability | Supports broad-based optimizations. | Enables targeted optimizations for specific user groups. |
| Example | Segmenting users based on location. | Segmenting users based on location, device type, and specific product views. |
Advanced segmentation allows for more nuanced analyses and insights, empowering businesses to tailor their marketing efforts and improve user experiences.
Troubleshooting Common Issues
Navigating Google Analytics can be tricky, especially when you encounter unexpected results or errors. This section dives into common problems and their solutions, providing practical steps to ensure your data is accurate and actionable. Proper troubleshooting not only fixes immediate issues but also builds a stronger understanding of how Google Analytics works.Troubleshooting involves identifying the source of the problem and applying targeted solutions.
A methodical approach, checking for common errors and following clear steps, will significantly increase the likelihood of a successful resolution. By understanding the underlying causes of problems, you can proactively prevent similar issues in the future.
Common Google Analytics Setup Issues
Troubleshooting starts with identifying potential issues in your Google Analytics setup. Common problems include incorrect tracking codes, missing or incorrect configuration settings, and issues with data transmission.
- Incorrect Tracking Code Implementation: Ensuring the tracking code is correctly implemented on all pages of your website is crucial. A single missing or incorrect character can prevent data from being collected. Double-check that the code is placed correctly within the ` ` section of each page, ensuring proper syntax and no extra spaces or characters. Use a developer tool in your browser to inspect the source code of the pages and verify the code’s presence and accuracy. Errors like a misplaced or duplicated tracking code often lead to incomplete or inaccurate data collection. Using a code validator can also help identify potential implementation problems.
- Data Stream Issues: Problems with the data stream can hinder data collection. This can manifest as missing data, delayed data reporting, or errors in the data stream itself. Check your Google Analytics account settings to ensure the correct data stream is being used and that the property is set up properly. Verify the connectivity between your website and Google Analytics servers.
Network interruptions, firewall restrictions, or server issues can cause data transmission problems. Verify your website’s connectivity and any potential firewall or network restrictions that may prevent the tracking code from sending data.
- Incorrect Property Configuration: Incorrect property configuration settings can affect data collection and reporting. Ensure your website URL and other settings match your actual website structure. Misconfigured dimensions and metrics can lead to unexpected results or the absence of critical data points. Carefully review all configuration settings to ensure they accurately reflect your website’s structure and intended data collection goals.
Common Errors and Solutions
Identifying specific errors and applying appropriate solutions is key to resolving problems.
- Error: “Tracking Code Not Found”: This error often arises from incorrect implementation. Verify the tracking code is properly pasted in the ` ` section of each page on your website, confirming its placement and syntax. Check the code for any typos or missing characters.
- Error: “Data Not Being Collected”: This indicates a potential problem with the data stream or configuration settings. Review the tracking code implementation and ensure the correct data stream is configured. Check for network connectivity issues or server-side problems that may prevent data transmission.
Preventing Common Problems
Proactive measures can prevent many common problems.
- Regular Code Audits: Performing regular audits of your tracking code ensures its accuracy and prevents issues arising from changes or updates to your website. This helps to ensure the code remains accurate and relevant. Testing the code in different browsers and devices will help you identify any potential issues early.
- Regular Data Checks: Regularly checking data collection helps to detect and address any issues before they affect your reporting. Setting up alerts for significant changes or errors can help identify problems early. Reviewing reports frequently for inconsistencies and discrepancies can reveal potential issues.
Troubleshooting Table
This table summarizes common errors and their solutions.
| Error | Solution |
|---|---|
| Tracking code not found | Verify correct implementation in the `` section of each page, check for typos. |
| Data not being collected | Review tracking code implementation, ensure correct data stream is configured, check network connectivity. |
| Incorrect property configuration | Double-check URL and other settings in Google Analytics, review dimensions and metrics. |
Epilogue

So, there you have it—15 Google Analytics tips to elevate your WordPress website! By implementing these strategies, you can gain a deeper understanding of your audience, optimize your content, and ultimately achieve a higher conversion rate. Remember, data-driven decisions are key to success. Now go forth and analyze!