Part 6 of 6: Statistical Arbitrage for Independent Traders

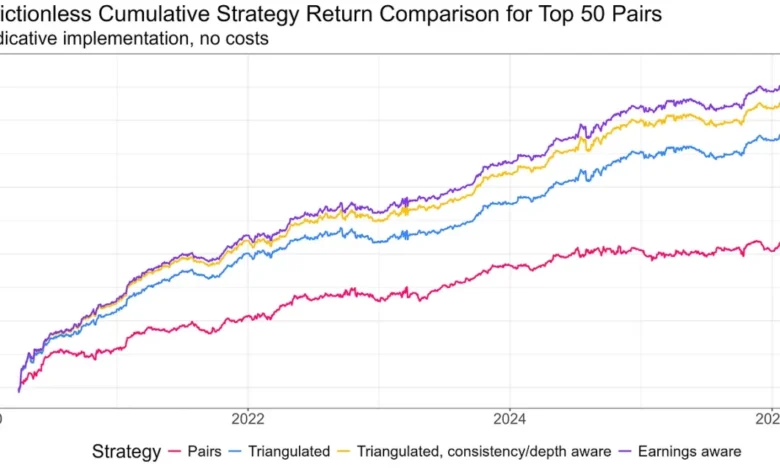
Statistical arbitrage—commonly known as stat arb—has long been a cornerstone of quantitative finance, traditionally operating as a simple bet on market convergence where two related securities drift apart and an investor wagers on their eventual return to a historical mean. However, traditional pairs trading remains notoriously capital-inefficient and prone to signal wastage, making it increasingly impractical for solo operators and independent portfolio managers. Addressing these inherent structural limitations, quantitative research firm Robot Wealth has detailed a comprehensive framework known as Triangulated Statistical Arbitrage. Developed and tested live over a multi-month rollout, this methodology transitions individual operators away from restrictive pair-by-pair execution toward a diversified portfolio of mispriced equities.
The architecture of the strategy rests upon a meticulously structured three-tier hierarchy: foundational pair selection, triangulation and network consistency, and dynamic event filters designed to shield traders from destructive false-convergence traps. According to project disclosures, the methodology fundamentally reallocates alpha generation, proving that robust upstream asset filtering accounts for the vast majority of overall portfolio performance, while subsequent layers offer diminishing, albeit valuable, marginal returns.
The Evolution and Structural Anatomy of Triangulated Stat Arb

The historical challenge of pairs trading for independent desks lies in capital allocation and asset selection. Standard pairs trading requires locking capital into isolated long-short legs, resulting in idle capital and missed opportunities across broader market correlations. Triangulated Stat Arb resolves this bottleneck by constructing a clean, high-probability universe of asset pairs, flattening each pair into discrete per-ticker directional views, and subsequently aggregating these views across multiple pairs. Rather than executing a direct trade between Stock A and Stock B, the operator trades an aggregate portfolio of mispriced single-name tickers informed by network-wide signals.
This approach builds upon a systematic development timeline. Over a six-month collaborative research period conducted within the firm’s professional membership community, quantitative developers and independent traders backtested, refined, and deployed the live production system. Rather than relying on naive, computationally expensive cointegration tests—a method frequently criticized in modern quantitative circles for generating excessive false positives—the research team implemented an unconventional metrics-based ranking system designed to evaluate asset pairs directly on historical mean-reversion efficiency and convergence consistency.
The Three-Tier Hierarchy of Performance
Empirical analysis of the strategy reveals a distinct hierarchy of performance drivers, where upstream preparation overwhelmingly dictates downstream profitability.
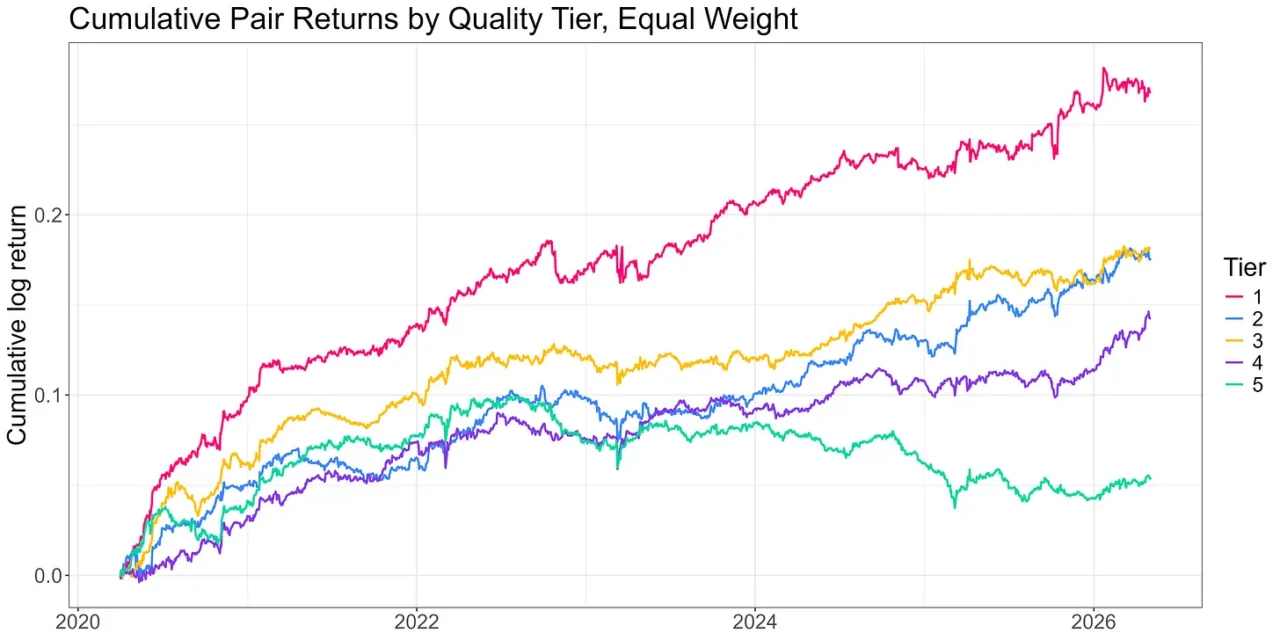
At the foundation of the pipeline lies pair selection. Operating on a monthly refresh cycle utilizing the preceding 24 months of historical price action, the ranking system evaluates candidate stocks against frictionless mean-reversion returns and convergence reliability. Spreads that diverge and fail to revert are systematically purged, while the top 10% of qualifying pairs are segregated into five distinct performance tiers. Quantitative performance metrics demonstrate a stark fourfold Sharpe ratio spread between top-tier and bottom-tier pairs.
Industry analysts tracking quantitative infrastructure note that this upstream curation requires immense computational power and data hygiene—involving rigorous liquidity filters, sector constraints, and management of corporate actions such as delistings and mergers. By handling this heavy computational lifting centrally via application programming interfaces (APIs) and research environments, solo operators bypass infrastructure expenses that would otherwise exceed standard operational budgets.
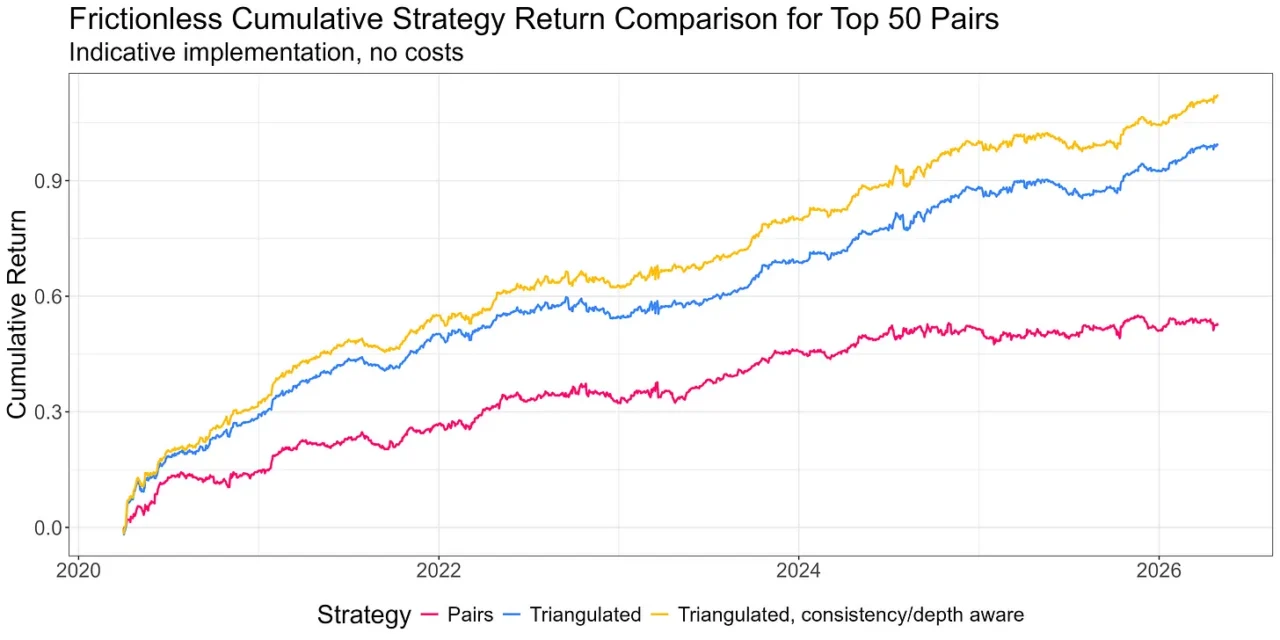
The second tier of the framework involves triangulation and consistency scoring. Once the universe of high-quality pairs is established, the paradigm shifts from pairs to individual tickers. Each ticker is evaluated across every pair in which it participates, generating a composite z-score that measures its deviation from rolling historical means. By filtering for the distributional tails—ignoring the noisy center where price movements carry minimal directional conviction—traders capture a high-conviction signal that dramatically outperforms traditional pair-level execution in both capital efficiency and risk-adjusted returns.
The Third Tier: Defensive Filtering and Earnings Surprises
The final component of the methodology addresses the inherent blind spot of quantitative stat arb models: the inability of raw mathematical spreads to differentiate between technical market noise and fundamental corporate re-pricing. When a spread diverges, standard algorithms register an anomaly and signal a reversion trade. However, if the divergence was triggered by genuine fundamental catalysts—such as an earnings surprise or unexpected macroeconomic news—the target asset has undergone a permanent structural re-pricing rather than a temporary technical dislocation. Fading such moves can lead to severe capital drawdowns, often manifested as post-earnings drift.
To neutralize this vulnerability, the Robot Wealth research team investigated volume asymmetries and corporate event feeds. While initial backtesting indicated that volume-based indicators held minor predictive value at the isolated pair level, their alpha contribution diminished entirely once aggregated into the broader triangulated ticker portfolio, as upstream pair ranking had already absorbed the variance.
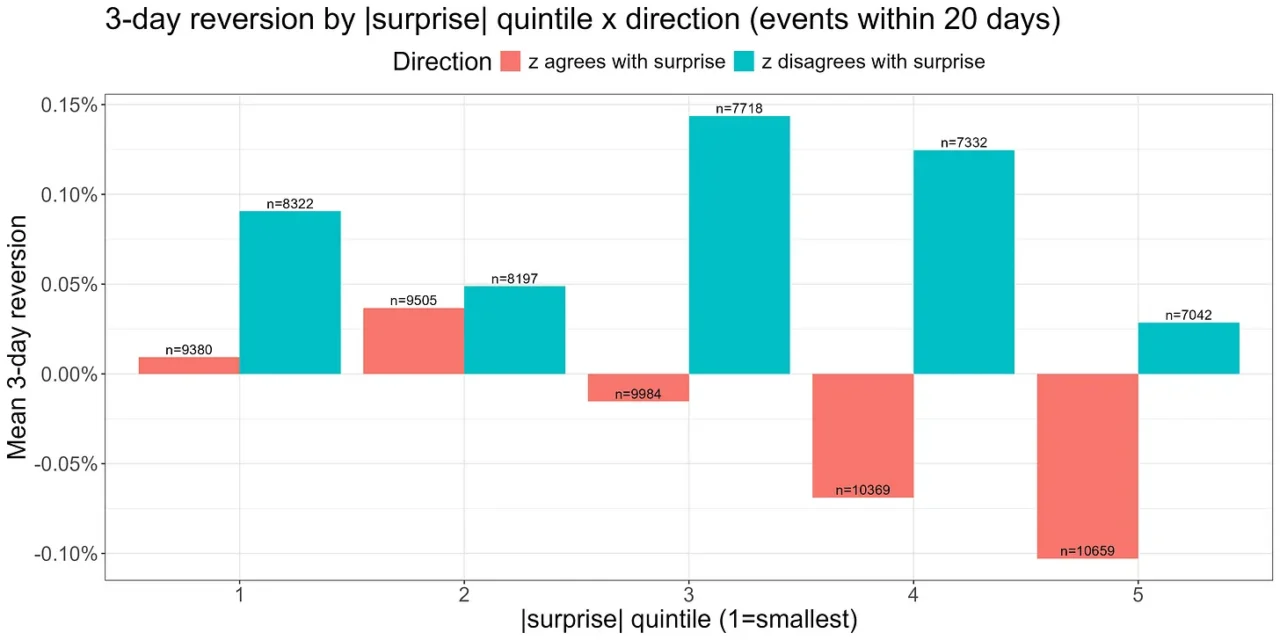
Conversely, the implementation of a targeted earnings filter yielded measurable performance improvements. Empirical data mapping three-day forward returns against formation-period earnings surprises demonstrated that when a z-score is stretched in the direct alignment of an earnings beat or miss, expected mean-reversion evaporates. In instances of significant earnings surprises, historical data reveals price continuation rather than reversion. Consequently, integrating an automated earnings filter into the live pipeline successfully prevents traders from standing in front of institutional momentum.
Implications and the Independent Trading Landscape
The deployment of Triangulated Statistical Arbitrage highlights a broader paradigm shift in independent quantitative asset management. By decoupling sophisticated institutional-grade data pipelines from massive proprietary funds and democratizing access through cloud-based research environments, independent operators can deploy complex statistical models without maintaining dedicated infrastructure engineering teams.
Furthermore, industry observers emphasize the educational and operational implications of the framework’s modular design. Rather than imposing a rigid, one-size-fits-all signal architecture, the methodology provides customizable configuration parameters—encompassing universe sizing, weighting schemes, no-trade buffers, and leverage thresholds. This flexibility allows diverse market participants, ranging from fully capitalized independent traders to part-time retail quants, to tailor execution parameters to their specific risk tolerances and cost structures.
As quantitative finance continues to evolve, the integration of structured network aggregation and rigorous fundamental filters demonstrates that sustainable alpha for independent operators relies less on brute-force machine learning complexity and more on disciplined upstream data hygiene, precise risk management, and a transparent understanding of market microstructure trade-offs.