How to measure reader engagement and loyalty using Google Analytics sets the stage for a deep dive into optimizing your website. This exploration uncovers the crucial metrics and strategies to transform casual visitors into loyal fans, boosting your website’s success.
We’ll explore how to track key interactions, analyze user journeys, and segment readers based on their behavior. Understanding these insights empowers you to tailor content and improve the overall reader experience. Crucially, we’ll demonstrate how to link engagement directly to business goals, ensuring your content marketing strategies are aligned with your overall objectives.
Defining Reader Engagement and Loyalty
Understanding your website visitors’ behavior is crucial for optimizing your content and achieving your online goals. A key aspect of this understanding involves recognizing and measuring reader engagement and loyalty. These metrics reveal how visitors interact with your site, and more importantly, how likely they are to return and become advocates for your brand.Defining engagement and loyalty goes beyond simple page views.
It delves into the depth of interaction, time spent on your content, and the repeat visits that indicate a strong connection with your website and its offerings. This deeper understanding empowers you to tailor your content strategy for maximum impact and build a loyal community of readers.
Reader Engagement Metrics
Reader engagement encompasses various metrics that provide insights into how visitors interact with your website. These metrics range from the straightforward to the more nuanced. Time spent on a page, for instance, often reflects the quality and relevance of the content. Page views, while a basic metric, can still provide a valuable snapshot of content popularity. A crucial aspect of engagement lies in interaction rates.
This includes clicks on links, comments, shares, and any other actions that indicate a deeper level of reader involvement. Understanding these engagement indicators is fundamental to website optimization and content strategy.
Characteristics of a Loyal Reader
Loyal readers are not just repeat visitors; they are actively engaged and invested in your content. They are more likely to return to your site frequently, explore multiple pages, and participate in discussions. Crucially, their actions extend beyond passive consumption; they are more likely to share your content with others, creating a ripple effect of engagement and brand awareness.
Their consistent return visits and active participation signal a strong connection to your brand and its values. Distinguishing these readers from casual visitors is crucial for tailoring content to resonate with the audience most likely to become advocates.
Understanding Engagement and Loyalty for Optimization
A deep understanding of reader engagement and loyalty is paramount for optimizing your website. By analyzing these metrics, you can identify what resonates with your audience and what doesn’t. This data-driven approach allows you to create content that captivates and encourages repeat visits. Knowing which topics or content formats drive the most engagement helps you focus your efforts and improve your overall online presence.
The insight gained from engagement and loyalty analysis empowers a targeted approach to website optimization, ensuring your content effectively connects with your target audience.
Table: Engaged vs. Loyal Readers
| Definition | Examples of Behavior | Google Analytics Metrics |
|---|---|---|
| Engaged Reader | Spend significant time on site, view multiple pages, click on internal links, and potentially leave comments. | High time on site, high pages per session, high bounce rate (low if engaging in internal navigation), high interaction rates. |
| Loyal Reader | Frequent return visits, explore multiple pages within each visit, actively participate in discussions (comments, forums), share content, and advocate for the site. | High session frequency, high returning visitor percentage, high conversion rate (if applicable), positive sentiment in comments/reviews, increased social shares. |
Key Google Analytics Metrics for Engagement
Understanding reader engagement and loyalty is crucial for any online publication. Knowing which metrics drive these behaviors allows for targeted strategies to cultivate a loyal audience. Google Analytics provides a wealth of data to analyze this, offering insights into how readers interact with your content.This section delves into essential Google Analytics metrics directly correlated with reader engagement and loyalty, explaining their interpretation and comparing their strengths and weaknesses in measuring these crucial aspects.
By examining these metrics, we can better understand reader behavior and tailor our content strategies for maximum impact.
Bounce Rate
Bounce rate is the percentage of single-page visits where the visitor leaves the site from that single page without interacting with any other pages. A high bounce rate often indicates that the landing page isn’t relevant to the user’s search query or that the content isn’t compelling enough to encourage further exploration. Conversely, a low bounce rate suggests that visitors are finding the content engaging and relevant, leading to more in-depth site exploration.
Average Session Duration
Average session duration reflects the average time spent by users on your website during a single session. A longer average session duration signifies a higher level of reader engagement, indicating that users find your content interesting and valuable enough to spend more time exploring it. Factors such as the complexity of content, reader interests, and the user interface design influence this metric.
A shorter average session duration could mean users are not finding the content relevant or that there are usability issues on the site.
Pages per Session
Pages per session reveals the average number of pages visited by users during a single session. A higher number suggests that users are navigating through multiple pages, demonstrating deeper engagement with the content. A low number could indicate that users are not finding enough relevant content or that the site’s structure is not facilitating easy navigation. Consider the site’s information architecture and the content’s relevance to user searches when evaluating this metric.
Conversion Rate
Conversion rate represents the percentage of visitors who complete a desired action, such as signing up for a newsletter, making a purchase, or downloading a resource. A higher conversion rate suggests that users are finding the content valuable enough to take action, which is a strong indicator of engagement and loyalty. This metric directly correlates to business goals and demonstrates the effectiveness of the content in persuading users to take specific steps.
Tracking conversions like form submissions or purchases provides invaluable insight into the effectiveness of your content.
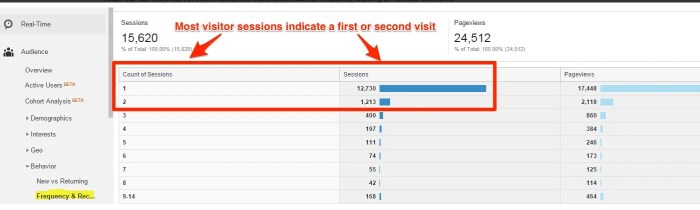
Returning Visitors
Returning visitors are users who have previously visited your website. A higher percentage of returning visitors signifies reader loyalty and engagement. Repeat visits suggest that users are finding value in your content and are returning for more. Factors such as the quality of content, user experience, and the overall value proposition contribute to this metric. Analyzing returning visitors over time provides a crucial indicator of audience retention.
Engagement Metrics Table
| Metric | Definition | Formula (if applicable) | How to Track in GA |
|---|---|---|---|
| Bounce Rate | Percentage of single-page visits where the visitor leaves the site without interacting with other pages. | (Number of single-page visits / Total visits) – 100 | Behavior > Overview |
| Average Session Duration | Average time spent by users on the site during a single session. | Total session duration / Total sessions | Behavior > Overview |
| Pages per Session | Average number of pages visited by users during a single session. | Total page views / Total sessions | Behavior > Overview |
| Conversion Rate | Percentage of visitors who complete a desired action. | (Number of conversions / Total visits) – 100 | Conversions > Goals or eCommerce |
| Returning Visitors | Users who have previously visited the site. | N/A | Audience > Overview > (Returning vs. New) |
Tracking Reader Interactions
Understanding how readers interact with your website is crucial for gauging engagement and loyalty. By tracking specific actions, you gain valuable insights into what resonates with your audience and what areas need improvement. This data allows for targeted content strategies, better user experience design, and ultimately, a more loyal readership.
Different Interaction Methods
Various actions on your website signal reader engagement. These range from simple clicks to complex interactions like form submissions and video views. Understanding these interactions is key to tailoring your content and website for optimal engagement.
Tracking reader engagement and loyalty through Google Analytics is key, but did you know emojis can also play a crucial role? Boosting engagement with the right emoticons can significantly increase conversions, as explored in this insightful guide on emoji marketing how to use emoticons to increase your conversions. Analyzing bounce rates, time on site, and other metrics in Google Analytics will give you a clear picture of how well your content resonates with your audience.
Ultimately, understanding your readers’ behavior will help you fine-tune your content strategy for maximum impact.
- Clicks: Clicks on links, buttons, or images indicate reader interest in specific content. They provide insight into which areas of your website are most attractive and engaging to your audience. Analyzing click data allows you to understand which content types (e.g., blog posts, articles, product pages) are most enticing.
- Scroll Depth: How far down a page readers scroll reveals their interest level in the content. If users rarely scroll past the initial content, it suggests that the information presented at the top isn’t compelling enough to keep them engaged.
- Form Submissions: Readers completing forms (e.g., newsletter sign-ups, contact inquiries) show a strong level of interest and intent to engage further. This is a clear indication of reader loyalty and desire to receive more content from your website.
- Video Plays: Video engagement is a powerful indicator of interest. Tracking the number of videos played, the duration watched, and the percentage of videos completed helps to understand what content resonates best with your audience. This can guide your video production and marketing efforts.
Event Tracking in Google Analytics
Setting up event tracking in Google Analytics allows you to monitor these interactions. This process involves tagging specific elements on your website so Google Analytics can recognize and record the actions.
Figuring out how engaged your readers are and how loyal they are to your content can be easily tracked using Google Analytics. Looking at bounce rates, time on site, and pages per visit gives you a good initial understanding. However, you need to be aware that unscrupulous tactics like spammers and negative SEO spammers and negative SEO can skew these results, making it hard to get an accurate picture of your audience’s real engagement.
Ultimately, focusing on genuine engagement through high-quality content is key to building a loyal readership, which Google Analytics can help you monitor.
- Click Tracking: Adding event tracking to buttons, links, and images allows you to monitor click-through rates and identify popular content. This data is crucial for understanding what elements are attracting the most attention.
- Scroll Tracking: You can set up event tracking to measure scroll depth, allowing you to understand how far down readers are engaging with your content. This is especially useful for identifying areas where content might be less engaging and needing improvement.
- Form Tracking: Tracking form submissions provides data on conversion rates and allows you to understand the user journey through the form. This is vital for optimizing form design and improving user experience.
- Video Tracking: Implementing event tracking for videos enables you to measure video completion rates, watch time, and engagement with specific video segments. This provides crucial data for optimizing video content and format.
Creating Custom Reports
Custom reports in Google Analytics allow you to create tailored views of the interaction data. These customized reports can provide valuable insights into specific areas of reader engagement.
- Specific Interaction Reports: Creating reports focused on specific interactions, such as clicks on specific links or video completion rates, can provide deeper insights into the content and its impact on your audience.
- Combining Data for a Holistic View: Combining different interaction data into a single report, such as click-through rate with scroll depth, can paint a more complete picture of user behavior and provide actionable insights.
- Example: A custom report focused on newsletter sign-ups could show the source of the sign-ups, the time of day sign-ups are most frequent, and the content that led to the sign-ups. This information can be used to tailor your content strategy to attract more subscribers.
Analyzing User Journey and Retention
Understanding how readers navigate your website and how long they stay is crucial for gauging engagement and loyalty. Analyzing the user journey reveals valuable insights into their behavior, allowing you to identify pain points and areas for improvement. This deeper understanding helps optimize the user experience, leading to increased engagement and ultimately, fostering long-term reader loyalty.User journey mapping isn’t just about identifying clicks; it’s about understanding the motivations and goals behind those clicks.
By tracking the path readers take, we can pinpoint the touchpoints where engagement peaks or wanes. This allows for targeted interventions to encourage continued engagement and build loyalty.
User Journey Mapping for Reader Engagement
Mapping the user journey provides a holistic view of how readers interact with your content. It’s more than just a sequence of clicks; it’s about understanding the reader’s emotional and mental state at each stage. This understanding is key to tailoring the user experience to their needs and motivations.
Identifying Key Touchpoints
Identifying key touchpoints within the user journey is vital to understanding where readers are most engaged and where they might drop off. These touchpoints can be anything from landing on a specific blog post to subscribing to a newsletter.
- Landing Pages: The first point of contact. Analyzing landing page performance, bounce rates, and time on page gives insight into the initial impression and whether it’s enticing enough to keep the reader engaged.
- Content Consumption: How long do readers spend on individual articles? Do they click on related posts or explore other content? This reveals the value perception of the content and engagement levels.
- Interactive Elements: Do readers actively participate in polls, quizzes, or comments sections? This reveals interest levels and desire for interaction.
- Subscription Forms: High abandonment rates on subscription forms might suggest the signup process is too cumbersome or the incentives aren’t strong enough. This can also show areas for improvement.
- Newsletter Engagement: How many readers open and click on links within your newsletter? This highlights the effectiveness of your communication strategy.
Analyzing User Flow Data
User flow data in Google Analytics provides a visual representation of the paths users take through your website. By studying these patterns, you can uncover insights into user behavior and identify drop-off points.
| Step | Action | Engagement Metrics |
|---|---|---|
| Landing Page | User lands on the homepage | Bounce Rate, Time on Page |
| Content Consumption | User clicks on a blog post | Time on Page, Pages/Session |
| Interactive Elements | User engages with a poll or quiz | Participation Rate |
| Subscription | User subscribes to the newsletter | Conversion Rate |
| Retention | User returns to the website | Returning Visitor Rate, Session Duration |
This data is vital for understanding how readers interact with your website and identifying areas where engagement might be lost. Identifying trends in user behavior is crucial for retention.
Example User Journey Flowchart
This flowchart illustrates a typical user journey on a website, highlighting key engagement and loyalty measurement points:[Insert a simple flowchart here. The flowchart should visually represent a user journey from landing on the homepage to subscribing to a newsletter, including key touchpoints like article reading, comment engagement, and subscription form submission. The flowchart should also indicate how metrics like bounce rate, time on page, and conversion rate are measured at each touchpoint.]This example illustrates how a visual representation of user flow can highlight patterns in user behavior, which can reveal critical insights for retention strategies.
Segmenting Readers Based on Behavior
Understanding your audience isn’t just about knowing who they are, but also how they interact with your content. Segmenting readers based on their behavior in Google Analytics allows you to tailor your content strategy to resonate more deeply with different groups. This, in turn, leads to higher engagement and loyalty.Knowing your readers’ preferences, from their preferred content formats to their browsing habits, enables you to refine your content and improve their overall experience.
By analyzing different groups, you can discover what resonates most with each, allowing you to deliver more targeted and valuable content.
Creating User Segments in Google Analytics
Identifying and grouping readers based on their behavior, demographics, and interactions with your website is crucial. Google Analytics provides robust tools for segmenting users. These segments allow you to analyze the behaviors of specific groups within your overall audience.
- Demographics: This segmenting method focuses on characteristics like age, gender, location, and interests. This data can be insightful for tailoring content and understanding audience preferences. Using demographic data to create segments helps you target your content to the right audience, which can increase engagement and loyalty.
- Behavior: Analyze actions like page views, time on site, bounce rate, and specific actions taken on your website. For example, users who spend a lot of time reading in-depth articles might have different needs and preferences compared to those who quickly scan headlines. This information allows for better content targeting.
- Acquisition Channels: Identify how users arrived at your website (e.g., organic search, social media, referrals). This segmentation helps you understand which channels are most effective in driving engaged readers. Understanding how users reach your site helps you optimize your marketing efforts to bring in more engaged visitors.
Examples of Tailored Content, How to measure reader engagement and loyalty using google analytics
Segmenting your readers allows you to create highly targeted content experiences. For instance, if you notice a segment of users frequently returning to a specific type of article, you can create more content like that, knowing it resonates with them.
- Content Formats: If a segment prefers short-form videos, you can create more videos. If another segment prefers in-depth articles, you can produce more of those.
- Content Topics: Identify topics that resonate with each segment. This enables you to create content that’s highly relevant to their interests.
- Content Delivery: Adapt your content delivery based on the segment. For instance, if one segment prefers mobile viewing, ensure your content is optimized for mobile devices.
Creating a Report Comparing Reader Segments
A well-structured report can highlight key differences between segments. This allows for more informed decisions about content strategy.
| Segment | Average Session Duration | Pages/Session | Bounce Rate | Returning Visitors (%) |
|---|---|---|---|---|
| New Visitors (Organic Search) | 2 minutes | 2 pages | 40% | 10% |
| Returning Visitors (Email Newsletter) | 10 minutes | 5 pages | 15% | 60% |
This example table demonstrates how different reader segments behave. Returning visitors, acquired via email, show significantly higher engagement (longer session duration, more pages per session, and lower bounce rate) than new visitors arriving through organic search. This clear distinction allows for a deeper understanding of user behavior and the tailoring of content strategy to each group.
Linking Engagement to Business Goals: How To Measure Reader Engagement And Loyalty Using Google Analytics
Connecting reader engagement with concrete business objectives is crucial for demonstrating the true value of content marketing. Simply measuring how many people visit your blog isn’t enough. You need to understand how those interactions translate into tangible results like leads, sales, and customer loyalty. This section will explore the vital link between reader engagement metrics and key business goals within the context of Google Analytics.Understanding how engagement translates into tangible business results is critical for demonstrating the ROI of content marketing efforts.
This is achieved by meticulously tracking the steps readers take from initial engagement with your content to desired outcomes, such as making a purchase or subscribing to a newsletter.
Tieing Engagement to Lead Generation
Effective lead generation relies on understanding what content resonates with potential customers. By analyzing which blog posts and pages receive the most engagement, you can identify the content types and topics that are most effective in attracting qualified leads. This analysis helps in creating targeted content campaigns that effectively nurture leads and move them closer to conversion. Tracking engagement metrics, such as time on page, bounce rate, and click-through rate, reveals the effectiveness of different content formats.
For example, a high click-through rate on a downloadable resource like an ebook indicates a strong interest and can be used to tailor future content to meet that need.
Linking Engagement to Sales
Content marketing plays a pivotal role in driving sales by educating potential customers about your products or services. By correlating reader engagement with sales data, you can pinpoint specific content that leads to conversions. For instance, if a specific blog post consistently drives a high volume of traffic to a product page and results in increased sales, that post is clearly effective in influencing purchase decisions.
The analysis of such correlations provides actionable insights into optimizing content for maximum impact on sales. High engagement with product-specific content directly correlates with higher conversion rates.
Establishing the Relationship Between Engagement and Customer Retention
Reader loyalty is crucial for long-term business success. Content that keeps readers coming back and engaging with your brand fosters a loyal customer base. Tracking reader engagement metrics like repeat visits, time spent on the site, and the frequency of content consumption gives insights into the effectiveness of your content in retaining customers. Content that encourages repeat visits and engagement is a strong indicator of loyal customers.
These metrics can also identify areas for improvement in content strategy. A high bounce rate from specific pages could signal a need for more engaging content or better user experience on those pages.
Conversion Tracking in Google Analytics
Setting up conversion tracking in Google Analytics is essential for linking engagement to desired outcomes. This involves identifying specific actions that represent a key step towards a business goal. These could include filling out a contact form, making a purchase, subscribing to a newsletter, or downloading a resource. Once defined, these actions are then tracked within Google Analytics.
Want to know how engaged your readers are? Google Analytics is your secret weapon. Tracking metrics like time on site, bounce rate, and returning visitors can give you a clear picture of reader loyalty. Understanding this data is crucial for creating a truly loyal audience. This knowledge is key to understanding your audience and building a thriving online community.
To truly master this, consider how to create freakishly loyal customers, like the strategies explored in this helpful resource: create freakishly loyal customers. By using these techniques, you can use the data from Google Analytics to foster even more reader loyalty.
This allows you to measure the effectiveness of your content marketing campaigns in driving conversions and understanding which aspects of your content contribute most to achieving business objectives. For example, a specific blog post leading to numerous sign-ups for a webinar signifies a direct correlation between engagement and a business goal.
Improving Reader Engagement and Loyalty

Understanding reader engagement and loyalty is crucial for any online publication. Data-driven insights from Google Analytics provide the key to optimizing content, design, and user experience to cultivate a loyal readership. Analyzing metrics like bounce rate, time on site, and returning visitors allows for targeted improvements in areas where readers are engaging less or leaving prematurely.Identifying patterns and trends within reader behavior allows for proactive measures to increase reader engagement and loyalty, ultimately translating into a more sustainable and profitable online presence.
Optimizing Content for Engagement
Content quality and relevance directly impact reader engagement. Analysis of popular content types, topics, and formats through Google Analytics can guide the creation of new content. Identify high-performing articles and replicate their successful elements, including length, structure, and style. Conversely, analyze articles with low engagement metrics to pinpoint areas needing improvement. This might involve rewriting content for clarity, incorporating visuals, or adjusting the tone.
Enhancing User Experience for Retention
The user experience plays a significant role in reader loyalty. Google Analytics data provides insights into navigation patterns, page load times, and user flow. Slow-loading pages and confusing navigation contribute to a poor user experience and high bounce rates. Address these issues by optimizing page load speed, ensuring clear and intuitive navigation, and improving mobile responsiveness. A seamless user experience across different devices is crucial for retaining readers.
Addressing Low Engagement and Churn
Low engagement and churn rates signal areas needing improvement in content, design, or user experience. Analyze bounce rates, time on site, and returning visitor data to pinpoint specific problem areas. For example, if users are bouncing from the homepage, the layout or calls to action might need review. If readers are spending little time on specific article types, the content might need to be improved.
A thorough investigation using Google Analytics metrics can uncover underlying issues.
Examples of Successful Strategies
Successful strategies for boosting reader engagement often involve combining several tactics. For instance, a blog that added interactive elements like quizzes and polls to articles experienced a significant increase in average time on site. Another blog noticed higher reader loyalty by introducing a newsletter subscription with exclusive content and community forums. These successful implementations highlight the potential for creating a positive reader experience through a well-structured approach and a data-driven understanding of reader behavior.
Final Wrap-Up

In conclusion, leveraging Google Analytics to measure reader engagement and loyalty is paramount for any website aiming for growth. By meticulously tracking interactions, analyzing user journeys, and segmenting your audience, you gain actionable insights to refine your content and enhance the reader experience. Ultimately, this process helps you create a more engaging website that converts visitors into loyal, returning readers, and fosters a stronger connection between your content and your business goals.