What is google analytics 4 a user s guide to the new analytics system – What is Google Analytics 4: a user’s guide to the new analytics system. This guide dives deep into the world of GA4, providing a comprehensive overview of this powerful tool. We’ll explore its key differences from Universal Analytics, walk you through setup, explain crucial concepts like events and custom dimensions, and show you how to unlock actionable insights from your data.
Get ready to master the new analytics system and supercharge your website or app performance!
From setting up your property to understanding event tracking, this guide simplifies the process of using GA4. We’ll cover everything you need to know, ensuring you’re equipped to make the most of this innovative analytics platform. We’ll also delve into advanced features like enhanced measurement and conversion tracking.
Introduction to Google Analytics 4 (GA4)
Google Analytics 4 (GA4) is Google’s latest and most advanced web analytics platform. It represents a significant shift from its predecessor, Universal Analytics (UA), designed to better handle the evolving digital landscape and provide more comprehensive insights into user behavior. GA4 focuses on the user journey, enabling businesses to track user interactions across various touchpoints, from initial discovery to conversion.
Its enhanced capabilities extend beyond website traffic to encompass app usage as well.GA4 moves beyond traditional website metrics to provide a more holistic understanding of the customer experience, providing crucial data for informed decision-making in marketing, product development, and overall business strategy. This modern approach allows for a more comprehensive and detailed view of user behavior and interaction with your business.
Key Differences Between Universal Analytics and GA4
Universal Analytics (UA) focused primarily on website traffic analysis, while GA4 embraces a broader perspective, encompassing both websites and mobile apps. This expanded scope is crucial for today’s multi-channel businesses. GA4’s event-based model provides a more flexible and detailed understanding of user interactions, going beyond page views to encompass a wider range of actions. Crucially, GA4 employs a more modern approach to data collection and analysis.
Fundamental Concepts of GA4
GA4 operates on core concepts that differ significantly from UA. Understanding these building blocks is essential for effective use.
- Properties: A GA4 property represents a specific instance of your business or app, such as your website or mobile app. Think of it as a container for all your data. Each property has a unique ID, allowing you to track and analyze data separately for different platforms.
- Views: While properties contain all your data, views allow you to segment and filter the information within a property. Views are crucial for isolating specific aspects of your data, like user behavior on particular pages or in specific campaigns.
- Events: GA4 tracks user interactions through events. These events encompass a wide range of actions, from page views and clicks to purchases and app downloads. This event-based model is more flexible than UA’s pageview-centric approach. Defining and tracking events is crucial for understanding the complete user journey and the different touchpoints within that journey.
Comparison of Universal Analytics and GA4 Features
The following table highlights key differences in features between Universal Analytics (UA) and Google Analytics 4 (GA4):
| Feature | Universal Analytics (UA) | Google Analytics 4 (GA4) | Key Differences |
|---|---|---|---|
| Data Model | Pageview-centric | Event-based | GA4 tracks user interactions (events) across different platforms, while UA focuses on page views. |
| Data Collection | Cookie-dependent | Cookie-less and server-side | GA4 offers more flexibility and future-proofing by using cookie-less and server-side options, making it more robust against changes in browser settings. |
| Data Analysis | More limited user journey tracking | Comprehensive user journey tracking | GA4 provides deeper insights into user behavior by analyzing the entire user journey across all touchpoints, from discovery to conversion. |
| Reporting | Less adaptable reporting | Flexible and adaptable reporting | GA4’s reporting dashboards offer greater customization, allowing businesses to tailor the data they see to their specific needs. |
Setting up a GA4 Property
Getting started with Google Analytics 4 (GA4) involves setting up a property that acts as the central hub for collecting and analyzing data from your website or app. This crucial step lays the foundation for understanding user behavior and optimizing your digital presence. Proper setup ensures accurate and comprehensive data collection, enabling informed decisions based on real user insights.Setting up a GA4 property is a straightforward process, but meticulous attention to detail is key for accurate data collection.
Following the steps Artikeld below will ensure a seamless integration of your website or app with GA4, allowing you to gain valuable insights from user interactions.
Creating a GA4 Property
To begin, navigate to the Google Analytics interface and choose “Create Property”. This initiates the process of creating a new GA4 property. You’ll be prompted to select the type of data source (website or app). Choosing the correct data source is fundamental to the success of your GA4 implementation.
Connecting a GA4 Property to a Website or App
Once you’ve created your GA4 property, you’ll need to connect it to your website or app. This step involves adding the GA4 tracking code to your website’s source code. The tracking code, a snippet of JavaScript, collects data about user interactions on your site.
Configuring Tracking Code Implementation
Implementing the GA4 tracking code is a critical step in the setup process. This involves adding the tracking code to your website’s source code, typically in the ` ` section. Precise placement is crucial for proper functionality.
- Identify the Tracking ID: Locate the unique tracking ID assigned to your GA4 property.
- Copy the Tracking Code: Copy the GA4 tracking code from your Google Analytics account.
- Insert the Code: Paste the tracking code into the ` ` section of every page on your website. This is vital for capturing data from all pages.
- Verify Implementation: After adding the tracking code, verify its proper implementation by checking for any errors or issues. This will ensure your website is correctly collecting data. Testing the tracking code is crucial to prevent data collection errors.
Website Configuration Settings for GA4
A well-structured configuration ensures the GA4 property accurately reflects your website’s setup. This section details the critical settings needed for accurate and effective tracking.
| Setting | Description | Example Value | Importance |
|---|---|---|---|
| Data Stream Name | A user-friendly name for the data stream. | My Website Stream | Clearly identifies the data source. |
| Website URL | The precise URL of your website. | www.example.com | Essential for tracking data from the correct domain. |
| Currency | The currency used on your website. | USD | Essential for accurate revenue tracking. |
| E-commerce Settings | Configure for e-commerce tracking if applicable. | Enabled | Enables detailed analysis of transactions and revenue. |
Understanding GA4 Events
GA4, unlike its predecessor Universal Analytics, revolves around events. Events are actions or occurrences that happen on your website, from simple page views to complex interactions like form submissions or purchases. Understanding and correctly tracking events is crucial for gaining a comprehensive picture of user behavior and website performance. Accurate event tracking allows you to identify key user actions, optimize website experiences, and ultimately drive better business outcomes.Events are the fundamental building blocks of GA4’s data model.
They represent actions taken by users on your website, providing valuable insights into user engagement and website performance. Defining and correctly tracking events is key to leveraging the full potential of GA4.
Defining and Tracking Events
Events in GA4 are essentially user interactions that you want to monitor. These can be anything from a user clicking a button to filling out a form or even viewing a specific page. By defining and tracking these events, you gain granular insights into user behavior, which can then be used to improve your website or app.
Types of Events
GA4 supports various event types. Common examples include page views, button clicks, form submissions, and video plays. You can also define custom events to track specific actions unique to your website or application.
Example Events and Tracking
A simple example is tracking page views. You can track a specific page view by defining it as an event. For instance, you can track when a user views a product detail page. Button clicks are also valuable. If a user clicks a “Learn More” button, you can track this as an event to understand how users engage with your calls to action.
Form submissions are another essential event. Tracking when a user submits a contact form provides valuable data for marketing and sales efforts. Beyond these, you can track video plays, file downloads, or any custom interaction that you want to monitor.
Event Parameters
Event parameters provide more detailed information about an event. These are essentially extra data points that enrich the event data. For example, you might include the specific page URL when tracking a page view or the value of a product when tracking a purchase. These parameters help you segment and analyze events in more detail.
Event Parameter Structure
Parameters are key-value pairs. The key defines the parameter’s name (e.g., `page_location`), and the value provides the corresponding information (e.g., `product_details`). This allows for a highly granular level of detail in your event data.
Common GA4 Event Types and Parameters
| Event Type | Parameter Name | Parameter Value | Description |
|---|---|---|---|
| Page View | page_location | /product-details/shoes | Specifies the page the user visited. |
| Button Click | button_label | Learn More | Captures the label of the button clicked. |
| Form Submission | form_type | contact | Identifies the type of form submitted. |
| Video Play | video_title | Product Demo | Indicates the video played. |
Data Exploration and Reporting in GA4
Navigating the GA4 interface can feel overwhelming at first, but with practice, you’ll find the treasure trove of data it holds. This section dives into practical techniques for finding, analyzing, and visualizing your data, revealing key insights into user behavior and website performance. We’ll cover essential reporting metrics and dimensions, and even demonstrate how to create custom reports to tailor your analysis to specific needs.GA4’s reporting features are designed to be flexible and customizable, allowing you to tailor your view of website performance.
By understanding the different ways to analyze and visualize data, you’ll unlock the true potential of GA4 for your business. This section guides you through practical application, moving beyond basic metrics to more nuanced interpretations.
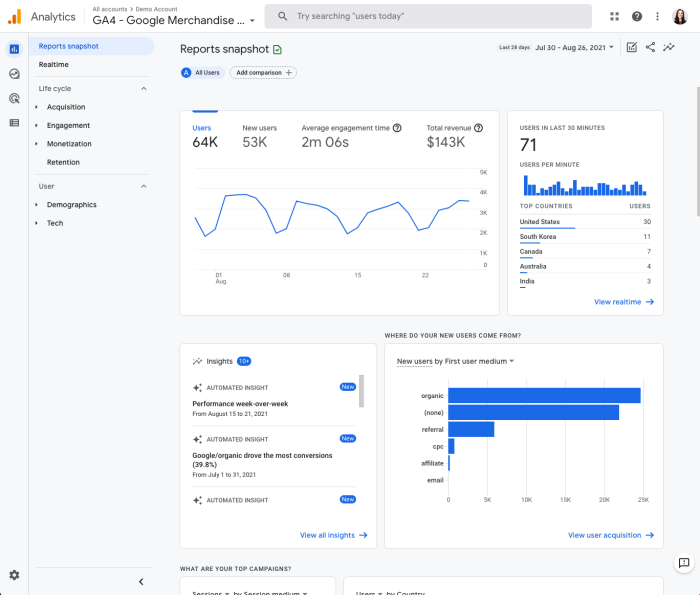
Navigating the GA4 Interface
The GA4 interface is structured around a few key areas: the left-hand navigation panel, the report view, and the customizable chart options. The navigation panel provides access to different report types, while the report view displays the data in various ways. The chart options enable you to modify how the data is presented, making it easier to identify trends and patterns.
By familiarizing yourself with the layout, you’ll be able to efficiently locate the information you need.
Analyzing and Visualizing GA4 Data
GA4 offers a range of visualization options to present your data effectively. From basic charts like bar graphs and line charts to more advanced visualizations like maps and interactive dashboards, you can customize the way you see your data to uncover hidden patterns. This flexibility is key to identifying trends and patterns that would otherwise remain hidden. Explore the various chart types to find the one that best suits your needs and insights.
The ability to tailor charts to specific metrics and dimensions is a crucial element of effective data analysis.
Common Reporting Metrics and Dimensions
GA4 provides a comprehensive set of metrics and dimensions to analyze user behavior and website performance. Metrics quantify aspects like user engagement and conversions, while dimensions categorize users and their interactions. Some common metrics include sessions, users, bounce rate, and conversion rate. Understanding the nuances between these metrics is crucial for gaining a complete picture of your website’s performance.
Dimensions like device category, location, and browser help you segment your data for more focused analysis.
Google Analytics 4 (GA4) is a user-friendly guide to the new analytics system, offering a more comprehensive understanding of user behavior. However, as your website grows, you might find that your existing tools, like your tech stack, are no longer sufficient. Knowing when your tech stack outgrows signs and strategies for scalability is crucial for continued success, as detailed in this helpful guide: when your tech stack outgrows signs and strategies for scalability.
Ultimately, GA4’s enhanced features are a powerful tool to monitor and adapt to changing needs, whether you’re just starting or scaling your online presence.
Creating Custom Reports in GA4
GA4’s reporting features extend beyond pre-built reports. You can create custom reports to tailor your analysis to specific needs and KPIs. Custom reports allow you to combine various metrics and dimensions to create a tailored view of your data. This is invaluable for analyzing unique aspects of your website’s performance or tracking progress against specific goals. By combining multiple data points, you can uncover critical insights into your website’s effectiveness.
Common GA4 Reports and Metrics
| Report | Key Metrics | Possible Dimensions | Example Insights |
|---|---|---|---|
| Acquisition | Sessions, Users, Channels, Source | Country, Device Category, Browser | Understanding where your traffic is coming from and how users are interacting with your site |
| Engagement | Average Session Duration, Pages/Session, Bounce Rate | Content, Events, User Segments | Identifying engaging content and user behaviors to optimize website experience |
| Conversions | Conversion Rate, Conversion Value, Conversion Actions | Traffic Source, User Demographics, User Behavior | Tracking the success of marketing campaigns and optimizing conversion funnels |
| User Behavior | New vs. Returning Users, Engagement Rate | Device, Location, Engagement Events | Understanding user behavior patterns and identifying areas for improvement |
Custom Dimensions and Metrics
GA4’s flexibility shines through its custom dimensions and metrics. These features empower you to collect and analyze data that’s specific to your business needs, going beyond the standard reports. Instead of relying solely on pre-defined parameters, you can tailor your tracking to capture crucial information relevant to your unique objectives. This granular level of control allows for a more in-depth understanding of user behavior and campaign performance.Custom dimensions and metrics are like adding new columns to your spreadsheet, allowing you to track additional attributes and values that enrich your data.
This detailed information enables more targeted analysis, better campaign optimization, and ultimately, more effective decision-making.
So, you’re diving into Google Analytics 4? It’s a user’s guide to the new analytics system, and understanding its intricacies is key. Learning how to use it effectively is crucial, and knowing how to connect with your audience is just as important, especially in the tech world. Check out these 5 ways to better connect with your technology audience here for actionable strategies.
Ultimately, mastering Google Analytics 4 will give you the insights you need to make informed decisions for your business.
Defining Custom Dimensions
Custom dimensions are user-defined attributes that provide context to your data. They are essentially extra pieces of information you can add to your existing data points, helping you categorize and segment users, events, or items. Think of them as labels or tags. For example, you could track the source of a lead or the product variation a customer viewed.
Defining custom dimensions in GA4 requires careful consideration of the data you want to collect.
So, you’re diving into Google Analytics 4 – a user’s guide to the new analytics system? Understanding how to track your website traffic is crucial, and mastering local SEO is key for small businesses. A good starting point for local SEO is learning about citations – for instance, a guide like local seo guide citations for beginners will help you build and manage citations for your business.
This helps search engines find your business online, boosting your visibility. Ultimately, mastering Google Analytics 4 will give you a comprehensive picture of your website’s performance, letting you see how well your local SEO efforts are working.
Defining Custom Metrics
Custom metrics are numerical values you track alongside your existing metrics. They quantify aspects of your user interactions or business activities. A good example would be tracking the number of product demos viewed or the average time spent on a specific page. By adding these numerical data points, you gain a more comprehensive view of user behavior and business performance.
Implementing Custom Dimensions and Metrics
Implementing custom dimensions and metrics in GA4 involves a few key steps. First, you need to define the name and the scope of the dimension or metric. Then, you need to specify how you will send the data to GA4. This usually involves using a tagging tool, such as Google Tag Manager (GTM), to add the custom dimension or metric to your website’s events.
Using GTM enables you to send these custom parameters with your existing events.
Use Cases for Custom Dimensions and Metrics
Custom dimensions and metrics are invaluable for several use cases. They help you track specific user attributes, such as demographics or technical details, that can significantly improve the quality of your data analysis. This allows you to tailor your reporting and insights to address specific business needs.
Examples of Use Cases
- Tracking referral sources: You can use a custom dimension to categorize the source of a user (e.g., social media, paid search, email). This lets you analyze which channels are most effective in driving conversions.
- Segmenting users by product type: A custom dimension can categorize users based on the type of product they interact with. This helps you understand which product categories resonate most with your audience.
- Identifying user roles: If you have different user roles on your website (e.g., customer, admin, guest), a custom dimension can track these roles, enabling analysis of behavior based on these roles.
- Monitoring campaign performance: A custom dimension can track the campaign a user was exposed to. This enables accurate attribution of conversions to specific campaigns.
Example Custom Dimensions Table
| Custom Dimension Name | Description | Possible Values | Example Value |
|---|---|---|---|
| Referral Source | Source of the website traffic | Social Media, Email, Paid Search, Direct | Social Media |
| Product Category | Category of the product viewed | Electronics, Clothing, Books, etc. | Electronics |
| User Role | Role of the user | Customer, Admin, Guest | Customer |
| Campaign Name | Name of the marketing campaign | Summer Sale, Black Friday, Winter Collection | Summer Sale |
Advanced GA4 Features: What Is Google Analytics 4 A User S Guide To The New Analytics System
Google Analytics 4 (GA4) offers a wealth of advanced features beyond basic setup and event tracking. These tools empower users to gain deeper insights into user behavior, optimize marketing strategies, and make data-driven decisions. This section delves into enhanced measurement, audience insights, custom segments, and conversion tracking. Understanding these features will unlock the full potential of GA4 for your business.GA4’s advanced features allow for a more comprehensive understanding of user journeys, providing actionable insights that were previously difficult to obtain.
These features enable businesses to not only measure website traffic but also to understand user interactions and behavior across various touchpoints.
Enhanced Measurement
Enhanced measurement in GA4 automates the collection of valuable data points, including page views, scrolling depth, and engagement metrics. This automated data collection streamlines the process of gathering critical user engagement data, significantly reducing manual effort. This significantly reduces the need for manual setup and implementation.Setting up enhanced measurement involves a few simple steps within your GA4 property settings.
After activating this feature, GA4 automatically captures crucial data points, such as page views, scroll depth, and engagement metrics. This feature requires no additional code implementation, providing a seamless integration experience.
Setting Up Enhanced Measurement for Improved Data Collection, What is google analytics 4 a user s guide to the new analytics system
To set up enhanced measurement, navigate to your GA4 property settings. Select the “Enhanced Measurement” section. Ensure all the relevant data points (page views, scroll depth, etc.) are enabled. Confirm the setup, and GA4 will automatically start collecting this enhanced data. No additional code implementation is needed.
Audience Insights in GA4
Audience insights in GA4 provide a detailed breakdown of your website visitors, enabling you to understand demographics, interests, and behavior patterns. This feature allows for a more nuanced understanding of your audience and the specific segments within that audience.Using the audience insights feature allows for the identification of key characteristics of your website visitors. This knowledge enables targeted marketing strategies and content creation.
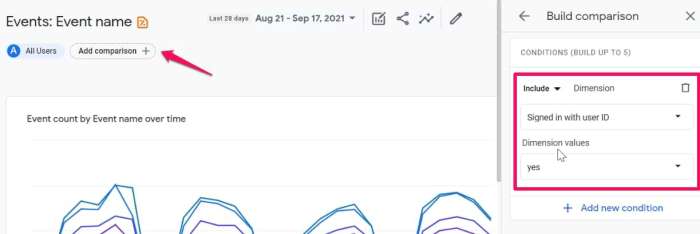
Creating Custom Segments in GA4
Custom segments in GA4 allow you to filter and analyze specific user groups based on predefined criteria. This powerful tool empowers users to drill down into the behavior of particular segments of their audience.Creating a custom segment involves defining specific criteria, such as device type, location, or user engagement patterns. This feature allows you to isolate and analyze the behaviors of different segments of your audience.
Examples include analyzing user behavior on specific pages or understanding how different demographics engage with your content.
- Define the criteria: Specify the characteristics that define the segment. This could include demographics, location, or behavior patterns. For example, you could segment users who visited a specific page or used a specific feature.
- Create the segment: Using the GA4 interface, define the segment by entering the specified criteria. This will filter your data to show only the behavior of the defined segment.
- Analyze the segment: Once the segment is created, analyze the data for that segment to gain insights into their behavior. Key metrics like bounce rate, engagement, and conversion rates can be assessed.
Conversion Tracking in GA4
Conversion tracking in GA4 allows you to measure the success of your marketing campaigns by monitoring key actions on your website. This powerful feature enables users to track specific actions that represent successful outcomes of marketing efforts.To set up conversion tracking in GA4, first define your conversions. This involves specifying the actions that constitute a successful outcome for your business, such as completing a purchase, filling out a form, or making a specific inquiry.
Next, set up conversion parameters for these defined actions, allowing GA4 to accurately track these conversions.
- Define Conversions: Specify the desired actions (e.g., purchases, form submissions). This involves defining specific actions or goals that represent a successful outcome for your business.
- Set Up Conversion Parameters: Configure tracking for each defined conversion, allowing GA4 to accurately identify and track these actions. This involves setting up tracking parameters within your website’s code.
- Analyze Conversion Data: Review the data collected to understand how effectively your marketing efforts are converting users into customers. Use this data to identify areas for improvement in your marketing campaigns.
Troubleshooting Common Issues
Navigating the complexities of Google Analytics 4 (GA4) can sometimes lead to frustrating hiccups. Data discrepancies, tracking errors, and a lack of expected insights can be disheartening. This section focuses on common pitfalls and provides practical solutions to get your GA4 implementation back on track.
Data Discrepancies and Inaccurate Reporting
Data discrepancies are a frequent challenge in GA4 implementations. Several factors can contribute to inaccurate reporting, including incorrect data collection, improper configuration, and misinterpretation of data visualizations. Analyzing the collected data against expected user behavior is crucial. For example, if your e-commerce site reports zero transactions, you need to investigate if the tracking code is properly implemented and firing on relevant events.
Debugging Tracking Code Implementation Issues
Correctly implementing the GA4 tracking code is paramount for accurate data collection. Troubleshooting tracking code implementation issues involves several steps, including verifying the code’s placement on your website or app, ensuring the code is up-to-date, and checking for syntax errors. Incorrectly placed code, missing script tags, or outdated versions can lead to data collection failures. Always double-check the official GA4 documentation for the latest implementation guidelines.
Troubleshooting Website Tracking Issues
Troubleshooting website tracking issues requires a methodical approach. First, verify that the GA4 tracking code is correctly integrated into your website’s HTML. Common errors include typos in the code, missing or incorrect script tags, and conflicts with other JavaScript libraries. Second, review the configuration settings within your GA4 property to ensure accurate event tracking. Third, analyze the specific events that are not being tracked.
Check if the events are correctly mapped to the relevant actions in your website’s code. Example: a click event might be missing due to incorrect event handling in your JavaScript code.
Troubleshooting App Tracking Issues
Troubleshooting app tracking issues involves a similar methodical approach. Firstly, verify that the GA4 SDK is correctly integrated into your app’s code. Look for discrepancies in the SDK version, missing or incorrect initialization calls, and errors in the code. Secondly, ensure that the app’s events are correctly mapped to the GA4 event parameters. Third, test specific events that are not being tracked in your app’s code.
Example: an app-open event might be missing due to an incorrect call to the GA4 SDK.
Common Troubleshooting Steps
- Verify Tracking Code Implementation: Carefully review the GA4 tracking code for any syntax errors, missing script tags, or incorrect placement within your website or app code. Use browser developer tools or app debugging tools to identify and fix any issues.
- Check Event Tracking Configuration: Review the settings within your GA4 property to ensure that the events you expect to track are correctly configured. Ensure that event parameters are correctly defined and mapped to actions in your website or app code.
- Review Data Streams: Check your data streams for any errors or warnings. This will highlight any discrepancies in the data collection process.
- Test Specific Events: Try to reproduce the issues with specific events by triggering those actions on your website or app. This will help you pinpoint the exact location of the problem.
- Use Debug Mode: Enable debug mode in your GA4 property settings to get more detailed information about the events being sent. This can help pinpoint errors in your tracking code.
- Consult GA4 Documentation: Refer to the official Google Analytics 4 documentation for the latest information and troubleshooting guides. This is essential for staying up-to-date with any changes in the system.
Data Visualization and Reporting Best Practices
Unlocking the true potential of your GA4 data hinges on effective visualization and reporting. This isn’t just about presenting numbers; it’s about crafting compelling narratives that drive actionable insights. Transforming raw data into easily digestible and insightful reports is crucial for understanding user behavior, optimizing campaigns, and ultimately, achieving your business goals. Clear visualizations help you spot trends, anomalies, and opportunities you might otherwise miss.Effective visualization and reporting go beyond simply displaying data; they require careful consideration of the target audience, the desired message, and the most impactful presentation methods.
The goal is to translate complex data points into clear, concise, and actionable recommendations for your business.
Creating Meaningful Visualizations
Visualizations should be clear, concise, and easy to understand. Avoid cluttered charts and graphs that overwhelm the viewer. Choose the right chart type for the data. For example, bar charts are ideal for comparing different categories, while line charts are best for showing trends over time. Color palettes should be chosen thoughtfully to enhance readability and avoid confusion.
Use consistent labeling and annotations to ensure that the visualizations are easily interpreted. Interactive visualizations allow users to drill down into specific data points, enhancing exploration and discovery.
Creating Actionable Reports
Reports should be focused and tailored to specific business objectives. Include key performance indicators (KPIs) relevant to your goals. For instance, if your objective is to increase conversions, include metrics like conversion rate and average order value in your reports. Use clear and concise language to explain the findings and highlight key takeaways. Avoid jargon and technical terms that might confuse non-technical stakeholders.
Always include context to place the data in perspective. For instance, compare current performance to previous periods or industry benchmarks.
Key Metrics and Dimensions for Different Business Objectives
The specific metrics and dimensions you should track depend heavily on your business objectives. For e-commerce businesses, key metrics include revenue, conversion rate, average order value, and bounce rate. For marketing campaigns, metrics like campaign cost, click-through rate (CTR), and cost per acquisition (CPA) are vital. Dimensions such as location, device, and user behavior (e.g., pages visited, time spent on site) can provide valuable context to the data.
| Business Objective | Key Metrics | Key Dimensions |
|---|---|---|
| Increased Sales | Revenue, conversion rate, average order value | Product category, location, device |
| Improved Customer Engagement | Session duration, pages per session, bounce rate | User demographics, engagement with specific content |
| Enhanced Marketing ROI | Cost per acquisition (CPA), click-through rate (CTR), campaign ROI | Source/medium, campaign type, ad placement |
Leveraging Dashboards for Real-Time Monitoring
Dashboards provide a centralized view of key performance indicators (KPIs). They allow for real-time monitoring of critical data points and immediate identification of trends or anomalies. Use pre-built dashboards or create custom ones to visualize the metrics most important to your business. Set up alerts to be notified about significant changes in your data.
“Dashboards provide a visual summary of key metrics, facilitating quick identification of issues and opportunities.”
Data Visualization Best Practices Summary
- Use clear and concise visuals, avoiding clutter.
- Choose the right chart type for the data.
- Select appropriate color palettes for readability.
- Use consistent labeling and annotations.
- Prioritize actionable reports tailored to business objectives.
- Include relevant KPIs and context for your audience.
- Focus on key metrics and dimensions aligned with your goals.
- Implement dashboards for real-time monitoring and proactive insights.
Outcome Summary

In conclusion, this comprehensive guide to Google Analytics 4 equips you with the knowledge to navigate the new analytics system effectively. From setup to advanced features, we’ve covered every essential aspect. Now, you’re empowered to leverage GA4’s potential and gain valuable insights from your data. Start implementing these strategies today to optimize your website or app performance.