Predicting Gold Price Movements Using Machine Learning Regression Techniques

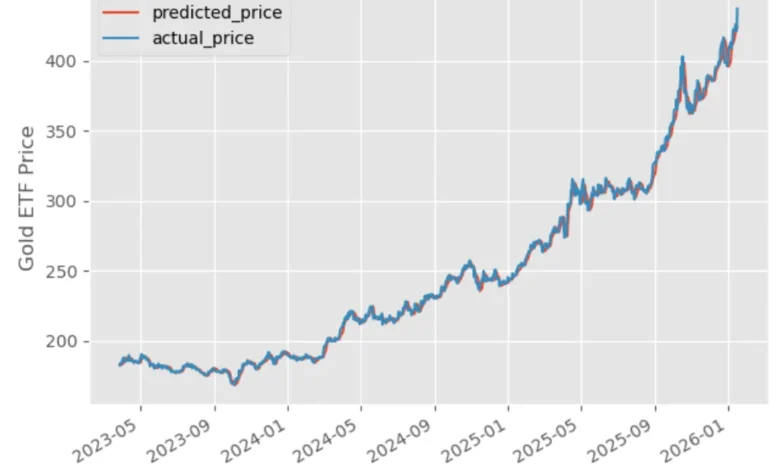
Gold has long occupied a unique position in the global financial ecosystem, serving as a primary store of value and a traditional hedge against inflation and geopolitical instability. For decades, investors and analysts have relied on fundamental analysis, central bank policies, and macroeconomic indicators to forecast the price of the precious metal. However, the rise of quantitative finance and data science has shifted the paradigm toward algorithmic prediction. By utilizing machine learning regression, traders can now systematically analyze historical price patterns to estimate the future trajectory of Gold ETFs, such as the SPDR Gold Shares (GLD), which remains the world’s largest exchange-traded fund backed by physical gold holdings.
The methodology for predicting gold prices typically begins with the preparation of historical data. To construct a reliable model, analysts must process at least a decade of daily price information. By cleaning this data—removing irrelevant noise, handling missing values, and ensuring the dataset is chronologically indexed—researchers can establish a baseline for time-series analysis. This foundational step is critical; without high-quality, normalized data, even the most sophisticated machine learning models are susceptible to "garbage in, garbage out" scenarios, where inaccurate inputs lead to misleading output.

Defining Feature Engineering and Predictive Inputs
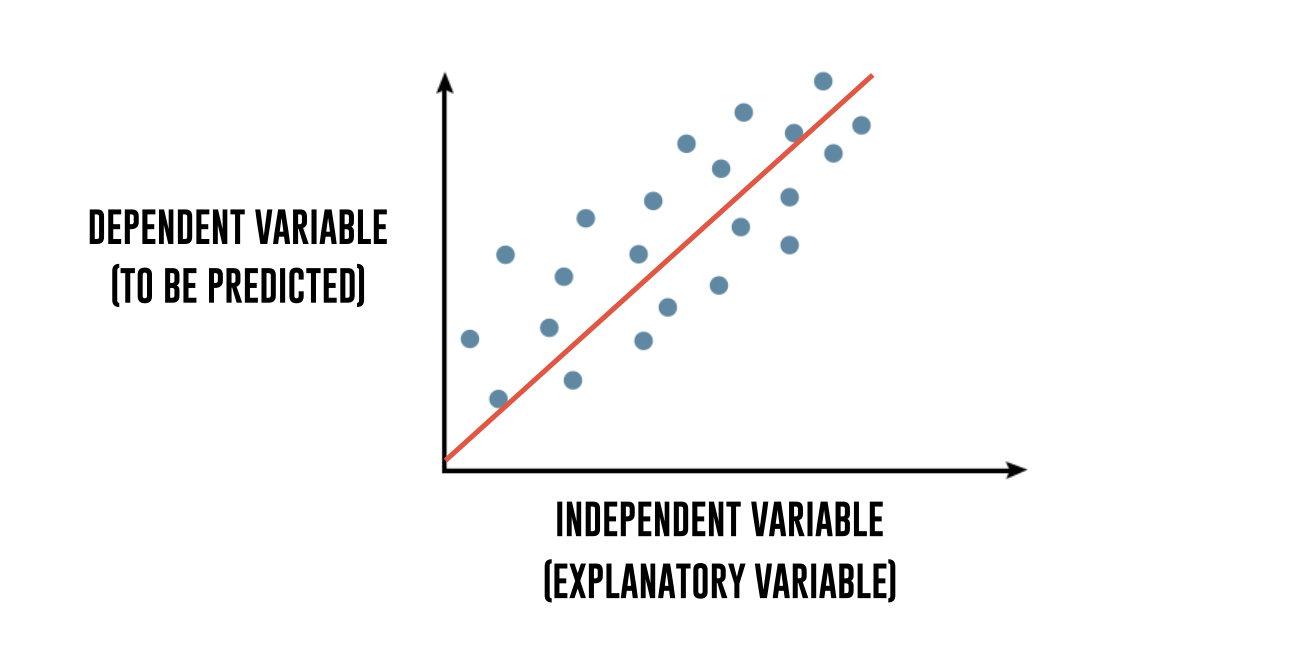
In machine learning, the accuracy of a model is fundamentally tied to its explanatory variables, or features. In the context of gold price forecasting, these are the independent variables that influence the dependent target—the next day’s closing price. A common starting point involves technical indicators such as the 3-day and 9-day moving averages. These indicators serve to smooth out short-term market volatility, allowing the algorithm to focus on momentum and trend persistence.
Feature engineering, however, extends far beyond simple moving averages. Modern quantitative analysts frequently incorporate a broader array of inputs to capture the complex drivers of gold prices. These may include volatility indices (such as the VIX), interest rate differentials, currency fluctuations—particularly the USD index, given the inverse relationship between the dollar and gold—and even sentiment analysis derived from financial news feeds. The objective of feature selection is to identify the variables that provide the highest signal-to-noise ratio, ensuring the model remains both robust and scalable.
Addressing Non-Stationarity in Financial Time Series
A significant challenge in applying linear regression to financial data is the issue of non-stationarity. Unlike stationary data, where statistical properties like mean and variance remain constant over time, asset prices often exhibit trends, drift, and structural breaks. If a regression model is trained on non-stationary price series, it risks producing "spurious regressions"—statistically significant results that are, in reality, meaningless correlations caused by shared trends rather than genuine causal relationships.
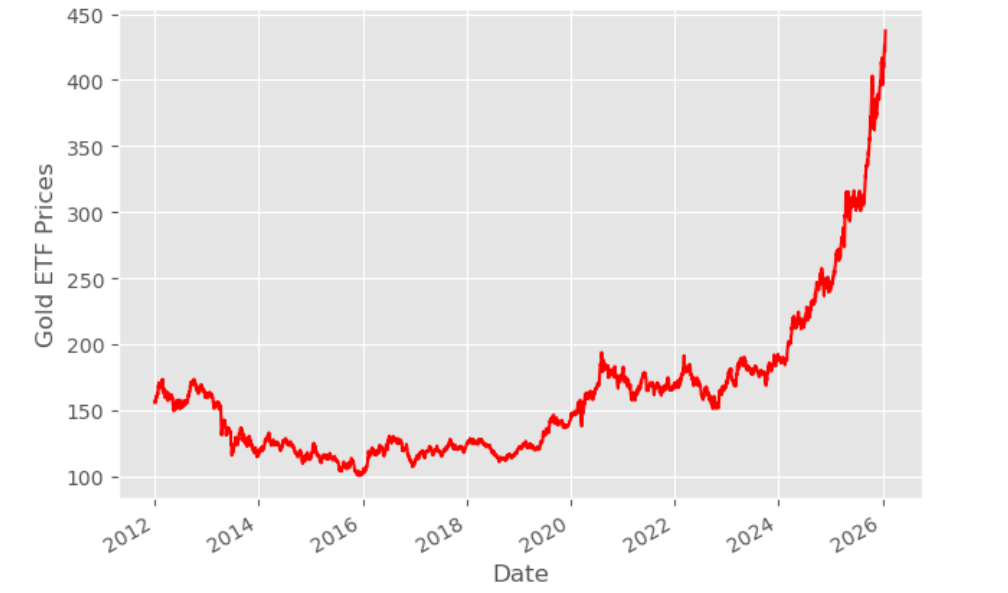
To mitigate this, quantitative researchers employ two primary strategies. The first is differencing, which transforms raw price data into returns or changes in price, thereby stabilizing the mean. The second, more advanced approach, is to test for cointegration. Cointegration exists when two or more non-stationary time series share a long-term equilibrium relationship. If the price of gold and its moving averages are cointegrated, the residuals of the regression model are stationary, validating the use of Ordinary Least Squares (OLS) regression without the need for aggressive data transformation. This ensures that the model captures a legitimate long-term relationship between the inputs and the target.
Model Development and Training Dynamics
The core of this predictive approach lies in the linear regression model. By plotting the relationship between current moving averages and the subsequent day’s price, the model fits a straight line that minimizes the sum of squared residuals. The resulting equation—Gold ETF Price = (m1 3-day Moving Average) + (m2 9-day Moving Average) + Constant—provides a quantitative estimate of the next day’s price based on the recent historical trend.
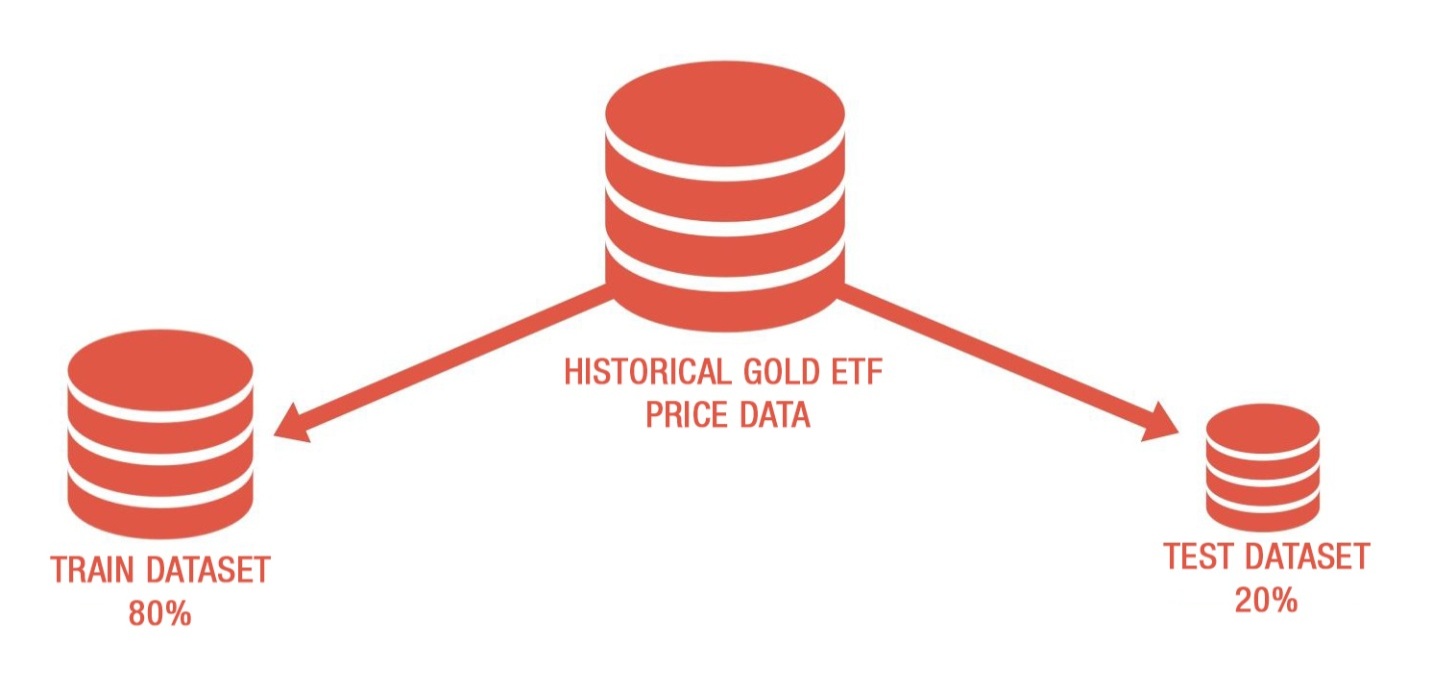
During the training phase, the dataset is split into two distinct segments: the training set, where the model learns the relationship between the features and the target, and the test set, where the model is evaluated against unseen data. This "out-of-sample" testing is the hallmark of professional financial modeling. It prevents overfitting, a condition where the model memorizes the noise in the training data rather than learning the underlying market dynamics, rendering it useless in real-world trading environments.
Evaluating Performance and the Reality of Trading
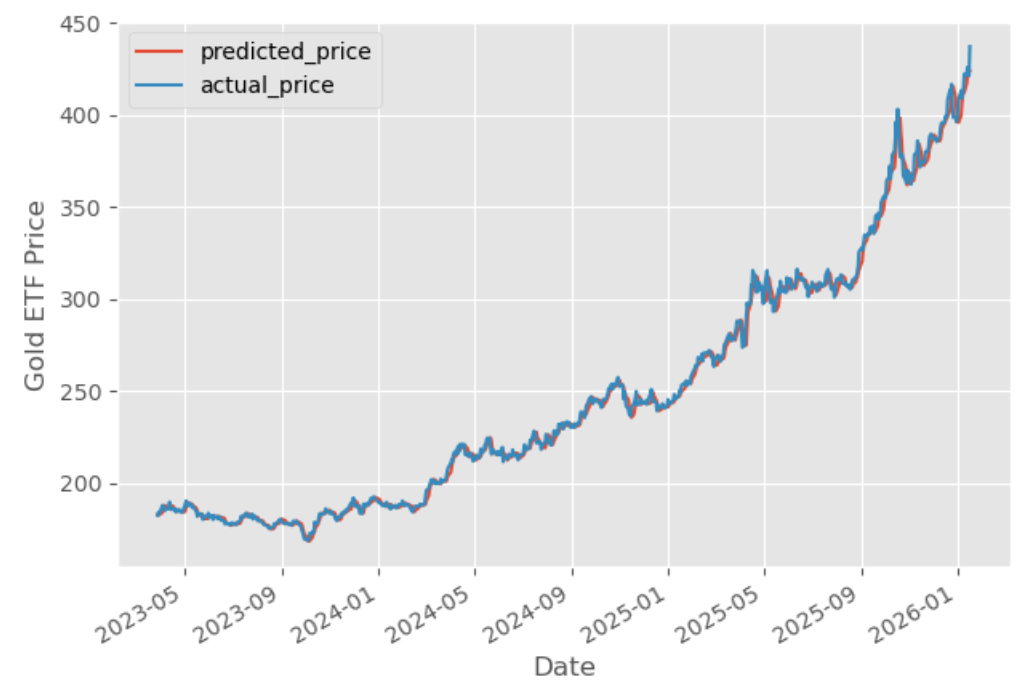
Upon evaluating a linear regression model, one might often observe an R-squared value approaching 99%. While this indicates that the model explains a vast majority of the variance in gold prices, practitioners must exercise extreme caution. In financial markets, high predictive accuracy does not automatically equate to high profitability.
For instance, a model may accurately predict the direction of a price move but fail to capture the magnitude necessary to cover transaction costs, slippage, and market impact. Furthermore, a simple long-only strategy—where a position is taken only if the predicted price exceeds the current close—often ignores critical risk management components such as stop-loss orders, position sizing, and hedging against short-term volatility. Data from backtesting shows that even when a model achieves high R-squared values, the resulting Sharpe Ratio—a measure of risk-adjusted return—may remain modest, often hovering around 1.82. This disparity highlights the inherent difficulty of translating statistical precision into sustainable alpha.
Broader Implications and Future Directions
The transition from a basic linear regression model to a sophisticated trading system requires more than just statistical skill; it requires an integrated approach to market microstructure. As the financial industry moves toward more complex architectures, linear regression is increasingly viewed as a baseline or a "benchmark" model. To enhance predictive power, researchers are pivoting toward non-linear machine learning techniques, such as Random Forests, Support Vector Machines (SVM), and Gradient Boosting Machines (XGBoost).
These advanced models are capable of capturing non-linear dependencies and complex interactions between variables that a linear model would miss. For example, the impact of a central bank interest rate decision on gold prices may not be linear; it may depend on the prevailing inflation regime or market sentiment, conditions that a Random Forest might detect but a linear regression would ignore.
Despite the allure of complex algorithms, the fundamental principles remain unchanged. Whether using a simple linear regression or a deep learning neural network, the successful deployment of a machine learning strategy depends on the quality of the data, the rigor of the feature engineering process, and the robustness of the risk management framework.
Conclusion: The Path Forward
The journey from raw data to a functional predictive model is a testament to the evolving role of technology in finance. While the linear regression model described provides a valuable entry point for understanding the mechanics of supervised learning, it is merely the first step. For institutional and professional traders, the goal is to build a scalable pipeline where data preprocessing, feature selection, and model training are automated, allowing for rapid iteration and the testing of diverse hypotheses.
Ultimately, predicting gold prices remains an exercise in probability rather than certainty. While machine learning offers powerful tools to identify patterns and anomalies in historical data, it cannot eliminate the inherent uncertainty of global financial markets. Traders who succeed are those who combine the quantitative rigor of machine learning with a disciplined understanding of market fundamentals, ensuring that every algorithmic prediction is supported by sound risk management and a clear strategic vision. As we look to the future, the integration of artificial intelligence into trading will likely continue to accelerate, rewarding those who can synthesize complex data into actionable, risk-aware strategies.