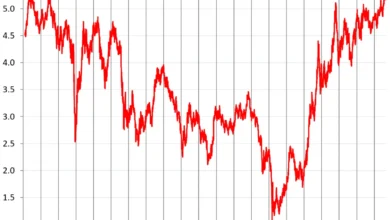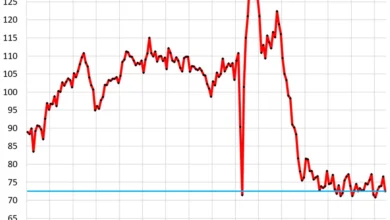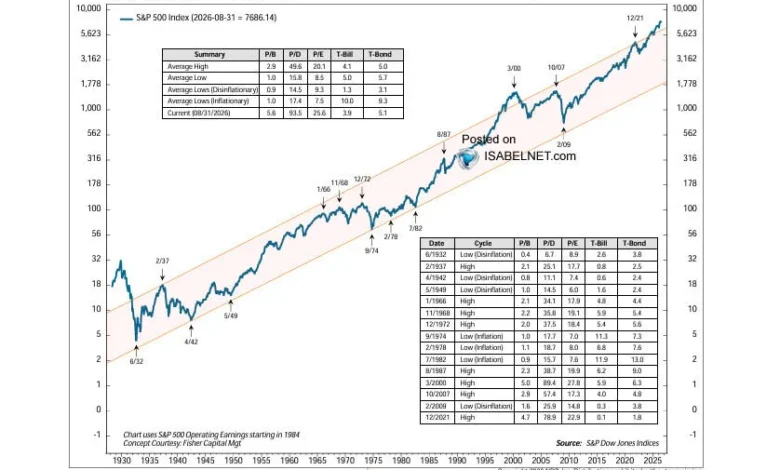
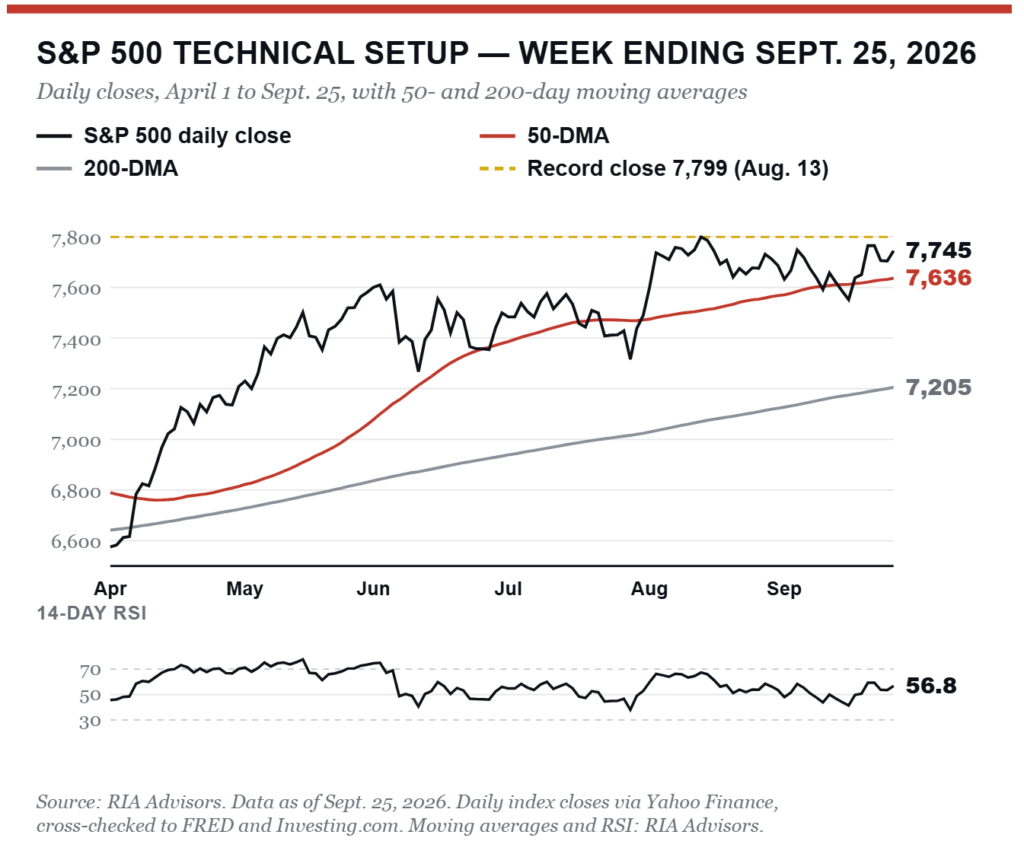
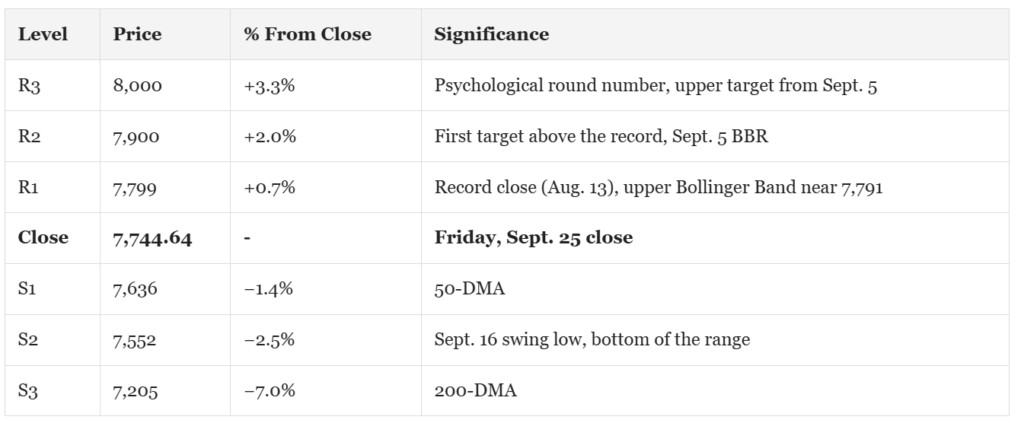
The S&P 500 managed a 1.2% gain over the trading week, closing at 7,744.64 and bringing its year-to-date return to 13.1%. Despite this bullish momentum, which leaves the index sitting just 0.7% shy of its August 13 record close of 7,798.99, underlying market conditions revealed profound divergence. While large-cap technology and communication services pushed the cap-weighted index higher, the bond market signaled mounting macroeconomic pressures. The 10-year Treasury yield surged past the 5% threshold, climbing from 5.01% at the prior week’s close to 5.18% mid-week, before touching an intraday high of 5.225%—marking its highest level since 2007. Concurrently, the 30-year Treasury yield reached 5.50%, a peak not seen since 2004, while bond market volatility, measured by the MOVE index, jumped from 80 to 104.
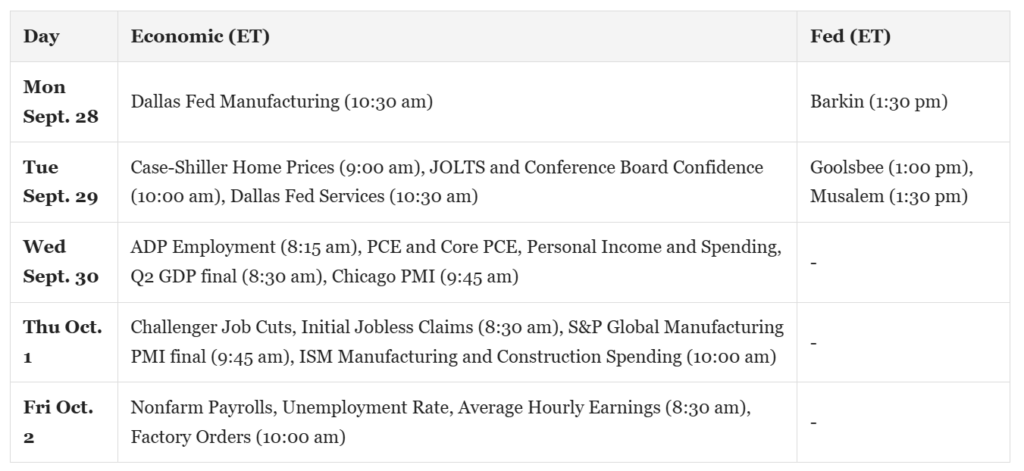
This upward pressure on yields was largely driven by stronger-than-expected economic indicators. S&P Global’s flash composite Purchasing Managers’ Index (PMI) rose to 58.4 in September from 56.0, signaling output growth at its fastest pace in over five years. Initial jobless claims similarly dropped to 197,000, pointing to a resilient labor market reminiscent of late-1960s tightness. As a result, futures markets adjusted to price in an estimated 70% probability that the Federal Reserve will implement another benchmark interest rate hike at its October meeting, up from approximately 50% the previous week. This dynamic highlights a central tension in current financial markets: the economic strength driving corporate earnings is simultaneously pushing up the discount rate used to value future cash flows.
Consumer sentiment, however, told a starkly different story. The University of Michigan’s final consumer sentiment index for September fell to 48.1, hitting a four-month low. Year-ahead inflation expectations climbed to 4.6%, up from 3.4% prior to geopolitical escalations involving Iran, exacerbated by retail gasoline prices hovering near $4.50 per gallon. Crude oil markets offered modest relief late in the week as West Texas Intermediate (WTI) settled at $91.96 amid discussions regarding the potential reopening of the Strait of Hormuz, though global benchmark Brent crude remained elevated near $100 per barrel.
Market Breadth and Sector Divergence
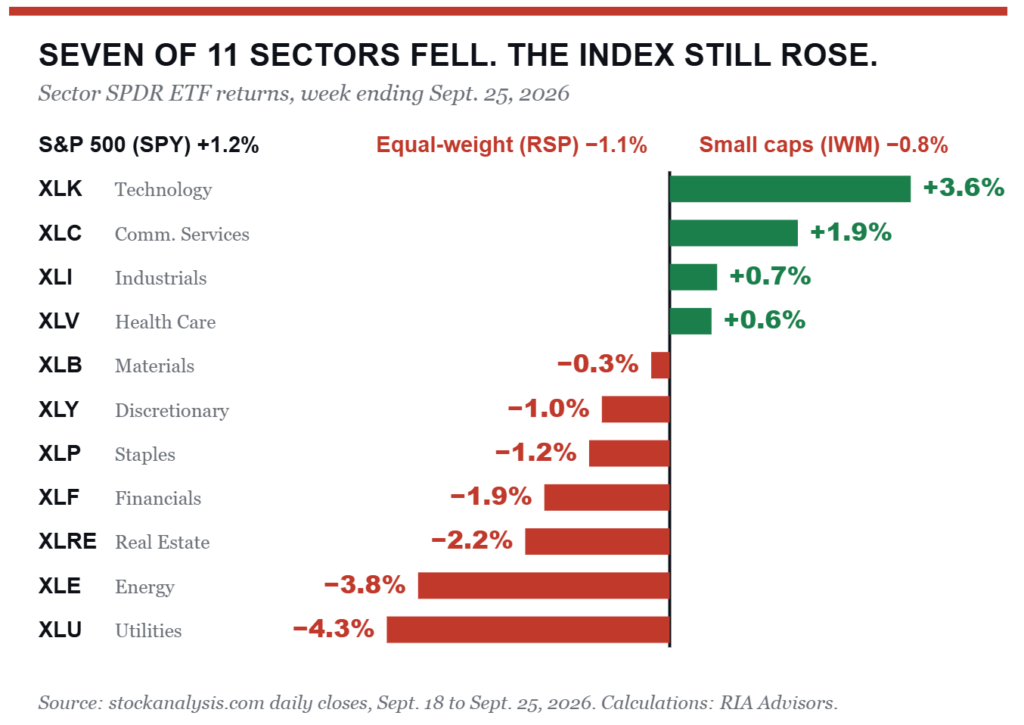
Beneath the headline index performance, market participation remained exceptionally narrow. Technology shares advanced 3.6% and communication services added 1.9%, single-handedly powering the cap-weighted S&P 500 upward despite seven of the eleven S&P sectors finishing in negative territory. Utilities tumbled 4.3%, energy fell 3.8%, and rate-sensitive real estate declined 2.2%. The equal-weight S&P 500 retreated 1.1%, while small-cap equities slipped 0.8%, illustrating the immediate toll exacted by a "risk-free" rate hovering above 5%.
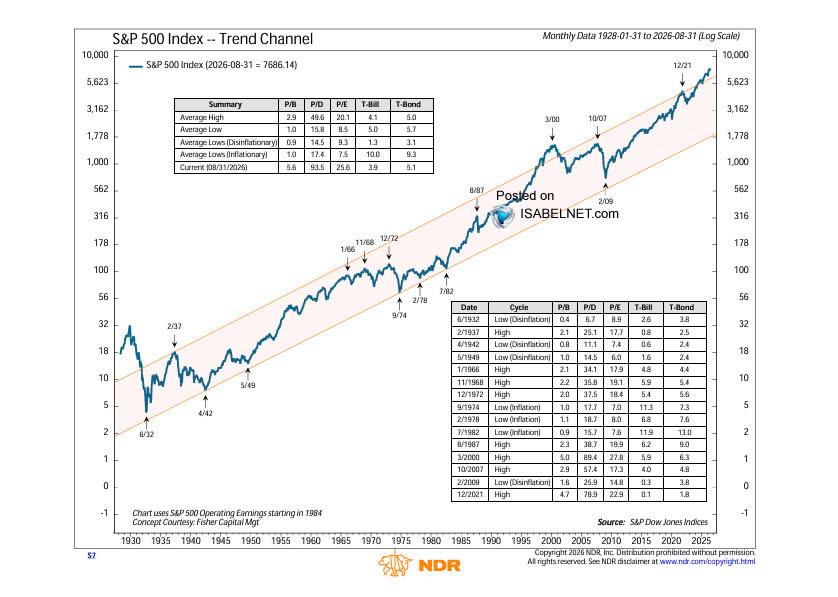
Historically, late September has experienced seasonal weakness, a trend that initially materialized when the index fell 2.5% from its September 3 close to a low of 7,551.81 on September 16. However, subsequent buying pressure erased those losses, pushing the index back toward the upper boundary of its two-month consolidation range between 7,550 and 7,800.

Technical indicators present a mixed picture. Momentum improved as the 14-day Relative Strength Index (RSI) climbed from 50.7 to 56.8, and the Moving Average Convergence Divergence (MACD) indicator registered its first buy signal since early August. Nevertheless, analysts emphasize that this technical upside is accompanied by deteriorating breadth, leaving the broader equity market heavily dependent on the continued outperformance of a single sector.

The Consensus Around the 9,000 S&P Target
Amid these crosscurrents, prominent financial institutions have dramatically revised their long-term outlooks. Jefferies recently published a comprehensive forecast projecting the S&P 500 to reach 9,000 by the end of 2027, representing a roughly 15.9% upside from recent trading levels. FactSet’s bottom-up analyst consensus sits even higher at 9,261. What was initially viewed as an aggressive projection has rapidly evolved into a mainstream consensus view across Wall Street.
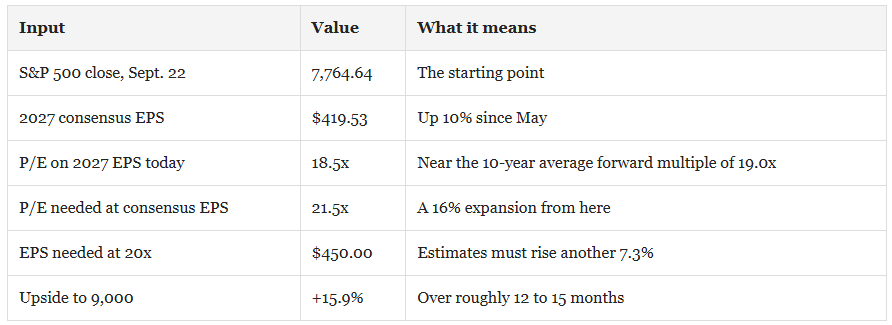
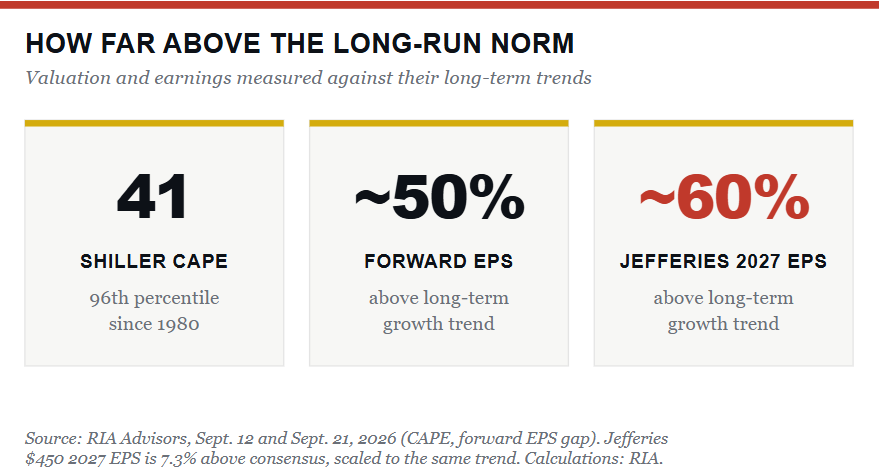
A granular examination of Jefferies’ methodology reveals that the 9,000 target is predicated on achieving $450 in earnings per share (EPS) by 2027, evaluated at a price-to-earnings (P/E) multiple of 20x. This assumes annual earnings growth of 20.8% in 2027, building upon an already optimistic 2026 estimate of $373 per share. Current consensus estimates for 2027 stand at $419.53, implying that reaching the 9,000 milestone requires either a 16% expansion in valuation multiples or an additional 7% upward revision to earnings forecasts.

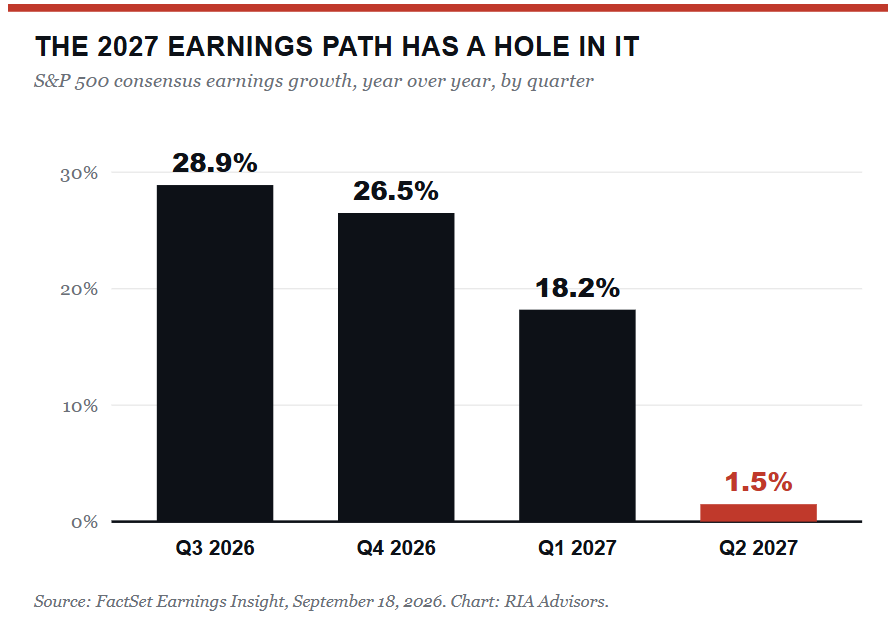
Bulls point to fundamental drivers supporting these projections. FactSet data indicates projected S&P 500 earnings growth of 31.8% for the current year and 15.2% for 2027, underpinned by robust corporate revenue growth of 9.1%. Furthermore, net profit margins reached a record 17.0% in the second quarter, driven heavily by artificial intelligence infrastructure investments. Analysts estimate that AI-exposed enterprises account for nearly 46% of total index earnings growth.

Unlike historical cycles where Wall Street analysts systematically overestimate early-year earnings and spend subsequent quarters issuing downward revisions, estimates for 2026 and 2027 have trended upward. This divergence marks a notable break from multi-decade patterns, fueling the narrative of structural corporate efficiency.
Macroeconomic Headwinds and Potential Risks
Despite strong corporate earnings revisions, critical structural risks threaten the assumptions underlying the 9,000 target. Foremost among these is the trajectory of corporate profit margins. FactSet anticipates net profit margins to moderate to 15.0% in the third quarter, down from record highs but remaining well above the five-year historical average of 12.4%. Sustaining a 9,000 index level requires these historically high margins to remain elevated indefinitely, defying traditional economic mean reversion.
Capital expenditure cycles present another vulnerability. Hyperscale capital expenditures directed toward artificial intelligence are projected to approach $800 billion, with free cash flow remaining constrained or negative for several major technology spenders outside of market leaders. Furthermore, standard accounting depreciation schedules for high-performance servers range between five and six years; if technological obsolescence accelerates the replacement cycle to three or four years, significantly higher depreciation charges could directly impair 2027 earnings.
Monetary policy dynamics further differentiate the current environment from previous bull markets. Following the Federal Reserve’s decision to raise the federal funds rate target range to 3.75%-4.00%, FOMC officials signaled a higher-for-longer path, with median projections pointing to limited policy easing. With core inflation persisting above central bank targets, the historical "Fed put"—the expectation that policymakers would intervene with rate cuts at the first sign of equity market weakness—is notably absent.

Strategic Implications for Investors
The convergence of elevated treasury yields, peak profit margins, and demanding valuation multiples leaves little margin for error. Financial advisors emphasize that while macroeconomic momentum supports participating in the current bull market trend, portfolio construction must incorporate robust risk management frameworks. Rather than structuring portfolios entirely around the assumption that ambitious multi-year targets will be met without interruption, market participants are advised to rebalance outperforming positions, monitor sector concentration, and prepare for potential volatility as upcoming employment and inflation data release cycles test the resilience of asset prices.