Americans Splurge Online and at Vehicle Dealers, instead of Buying Homes? YOLO? Retail Sales without Gas Stations Jump for 5th Month

The Gasoline Paradox: Deflation Masking Demand
Gasoline station sales, which represent approximately 7.5% of total retail sales, are uniquely sensitive to price fluctuations rather than just consumer volume. In June, sales at these locations plummeted by 5.3% on a seasonally adjusted basis—a staggering -48% on an annualized basis. This decline followed several months of soaring prices in March, April, and May, which had previously served to artificially inflate the total retail sales figures.
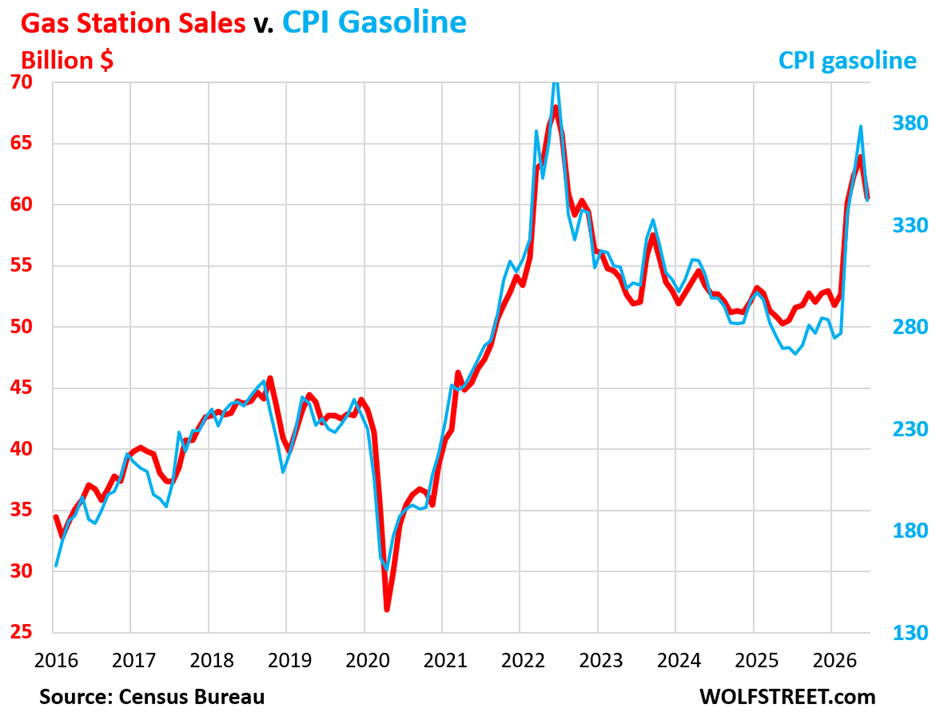
According to the Consumer Price Index (CPI) data for June, the price of gasoline plunged by 9.7%. Because the dollar value of sales at the pump moves in near-lockstep with the price per gallon, the nominal drop in revenue does not necessarily indicate that Americans are driving less. In fact, on a year-over-year basis, gas station sales remain up by 21%, reaching a non-seasonally adjusted total of $65 billion. This sustained year-over-year growth is largely attributed to the fact that gasoline prices are still 27% higher than they were twelve months ago. Furthermore, the "convenience store" aspect of gas stations—selling snacks, beverages, and household essentials—has seen steady pricing, which helped soften the blow of the fuel price collapse.
Core Retail Growth: A Surge in Discretionary Spending
To understand the true health of the retail sector, economists often look at retail sales excluding gasoline stations. By this metric, the economy showed remarkable strength in June, jumping by 0.72% from May, or roughly 9.0% on an annualized basis. This represents the fifth consecutive month of robust growth in core retail categories, following gains of 0.89% in May, 0.41% in April, 0.77% in March, and 0.87% in February.
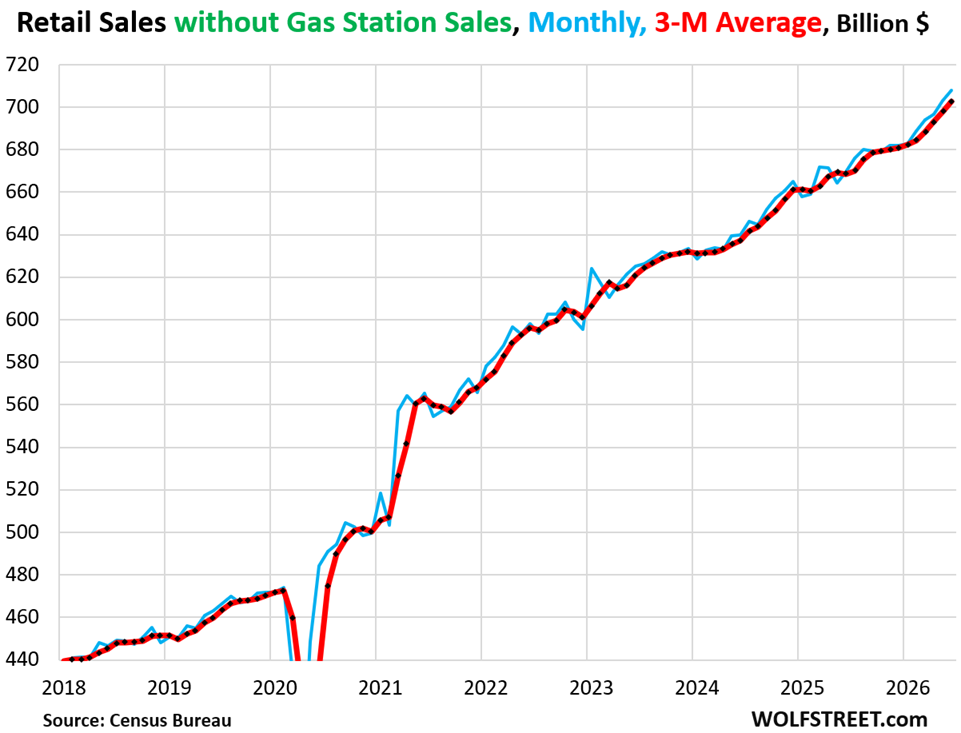
On a year-over-year basis, retail sales without gasoline stations jumped by 7.4%, reaching a non-seasonally adjusted $712 billion. This marks the most significant annual increase since December 2022. The three-month moving average, a tool used by analysts to smooth out month-to-month volatility or "squiggles," rose by 0.67%. This consistent upward trajectory suggests that despite broader economic concerns regarding interest rates and the housing market, the American consumer remains in a high-spending mode.
Critically, this growth was not driven by inflation. While the headline CPI has remained a point of contention for the Federal Reserve, "core" goods inflation—which excludes food and energy—was actually negative in June, dipping by 0.1%. On a year-over-year basis, core goods prices rose by a negligible 0.8%. This indicates that the 7.4% jump in sales represents a genuine increase in the volume of goods being purchased, rather than consumers simply paying more for the same amount of product.
The Rise of Ecommerce: The New Retail King
The standout performer in the June report was the ecommerce sector. Non-store retailers saw sales jump by 1.9% from May. On a year-over-year basis, the sector experienced an 18.0% surge, bringing the total to $140 billion. This performance was enough to propel ecommerce into the position of the number one retailer category in the United States, accounting for 17.9% of total retail sales.
The growth in ecommerce is driven by two distinct factors:
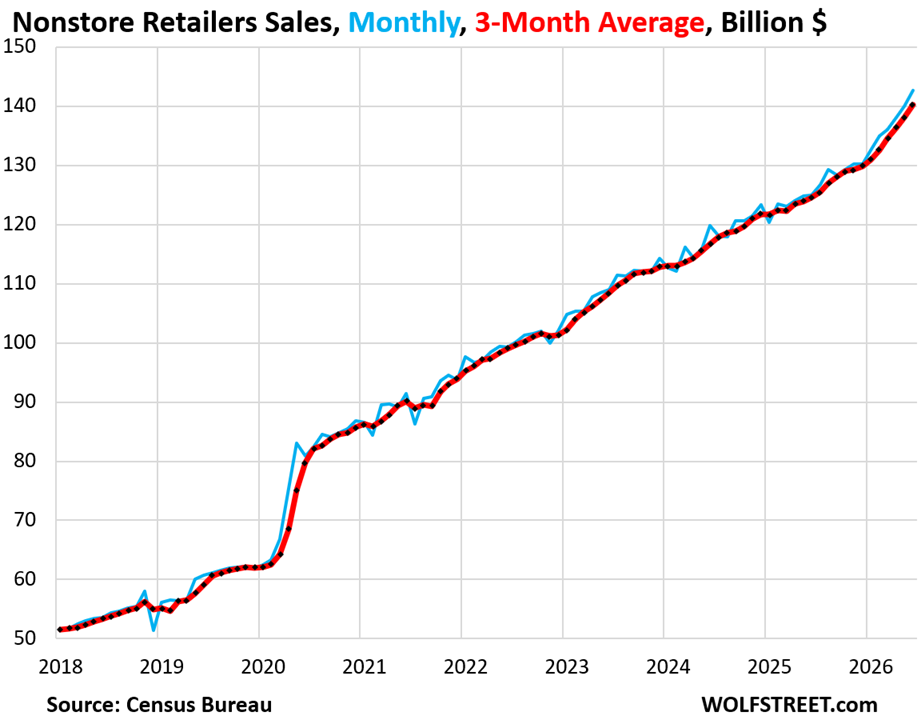
- Total Market Expansion: Consumers are spending more money overall, and a significant portion of that new spending is occurring online.
- Market Share Shift: A "zero-sum" battle for dominance continues as consumers migrate their existing spending habits away from traditional brick-and-mortar stores.
This category is no longer limited to online-only giants like Amazon. It includes the digital arms of traditional "big box" retailers such as Walmart, Target, and Macy’s. Even the grocery sector, long considered the final frontier for physical retail, is seeing a consequential migration toward online ordering and delivery services.
Automotive Sales: Defying High Interest Rates
Despite the highest borrowing costs in decades, the automotive sector showed surprising resilience. Sales at motor vehicle and parts dealers jumped by 2.0% in June from May, representing a 27% annualized growth rate. Year-over-year, the category rose by 8.5% to $134 billion.
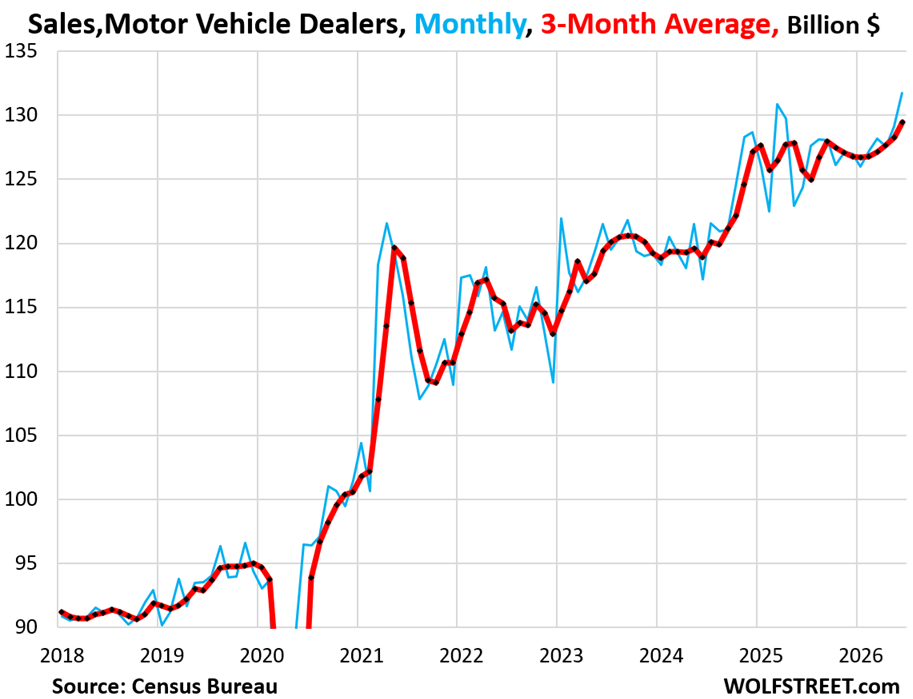
The strength in the auto sector is particularly noteworthy because, like core goods, it was not fueled by price hikes. The CPI for used vehicles was negative in June and fell 1.8% year-over-year. New vehicle prices also saw a monthly decline and were up only 0.5% compared to the previous year. This suggests that improved inventory levels and perhaps a pent-up demand for specific models are driving sales, even as consumers face higher monthly mortgage-style payments for their transport. Motor vehicle dealers, which include retailers of motorcycles, RVs, and ATVs, remained the second-largest retail category with a 17.2% market share.
The "YOLO" Economy and the Housing Deep-Freeze
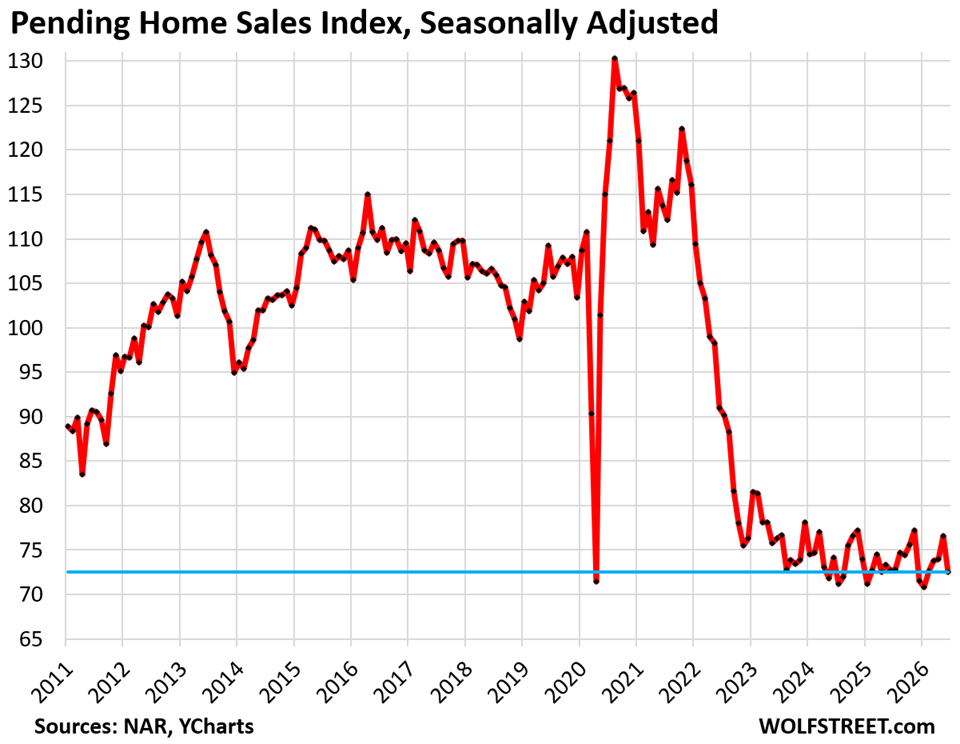
A compelling theory for the continued strength in retail spending, despite economic headwinds, lies in the stagnation of the U.S. housing market. Pending home sales have plunged to near-record lows, particularly in the West, as potential buyers are deterred by high mortgage rates, soaring insurance premiums, and elevated homeowners’ association (HOA) fees.
With the housing market in a "deep-freeze," many consumers who might otherwise have been saving for a massive down payment or spending on home-related debt appear to be adopting a "You Only Live Once" (YOLO) mentality. Instead of committing to a 30-year mortgage and the associated costs of homeownership, consumers are redirecting their disposable income toward immediate gratification: new cars, high-end electronics, and dining experiences.
Food Services and the Competitive Grocery Landscape
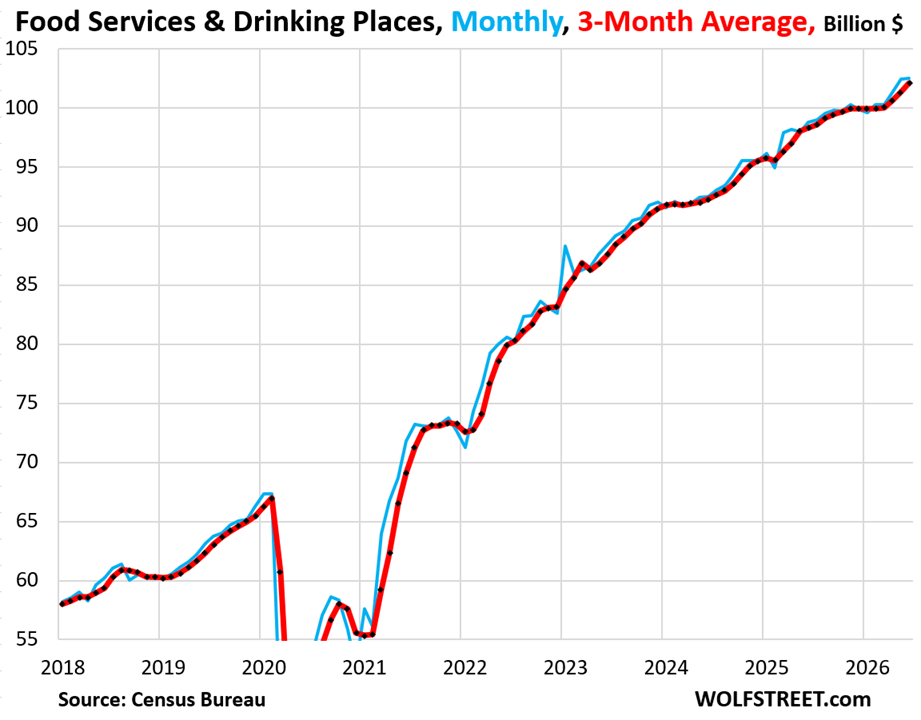
The dining sector continues to benefit from this shift in consumer priorities. Sales at restaurants and bars—formally known as "food services and drinking places"—inched up by 0.1% in June, following two months of significant gains. The three-month average for the sector jumped by 0.74%. On a year-over-year basis, spending in this category rose by 3.8% to $105 billion, making it the third-largest retail category with a 12.2% share.
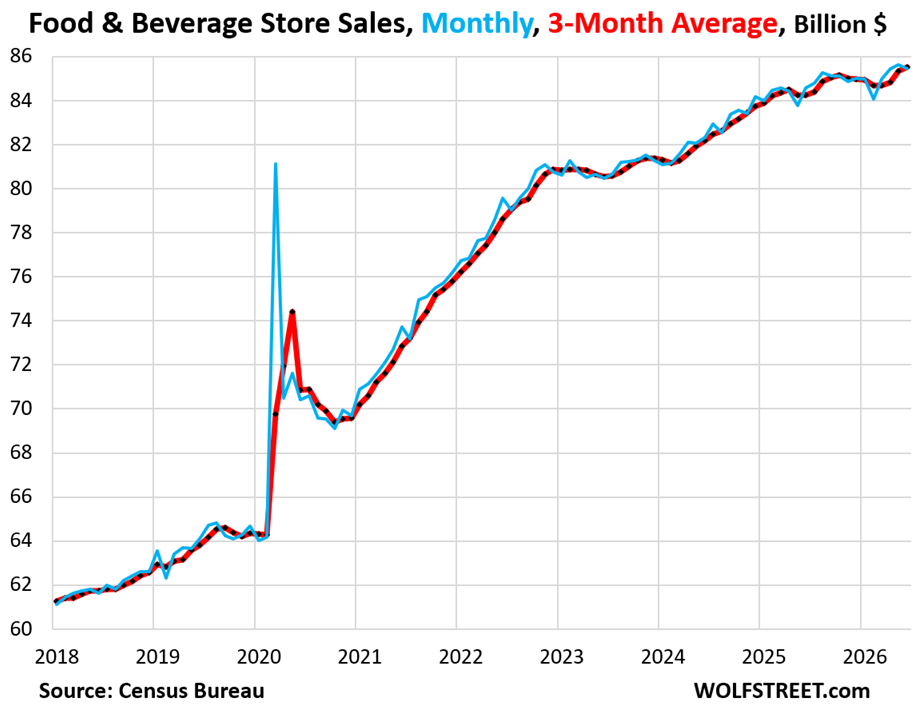
In contrast, traditional food and beverage stores (grocery stores) saw a slight dip of 0.2% in June. Year-over-year growth in this category was a mere 1.0%, totaling $85 billion. This growth rate is significantly below the 2.6% CPI inflation rate for "food at home," indicating a decline in real volume for traditional grocers. This stagnation is likely due to three factors:
- Migration to General Merchandise: Consumers are increasingly buying groceries at "one-stop" shops like Walmart and Costco.
- Ecommerce Growth: Online grocery delivery is siphoning off traditional foot traffic.
- Dining Out: A decades-long trend shows consumers spending more at restaurants than at grocery stores, a gap that has widened dramatically since 2019.
General Merchandise and Building Materials
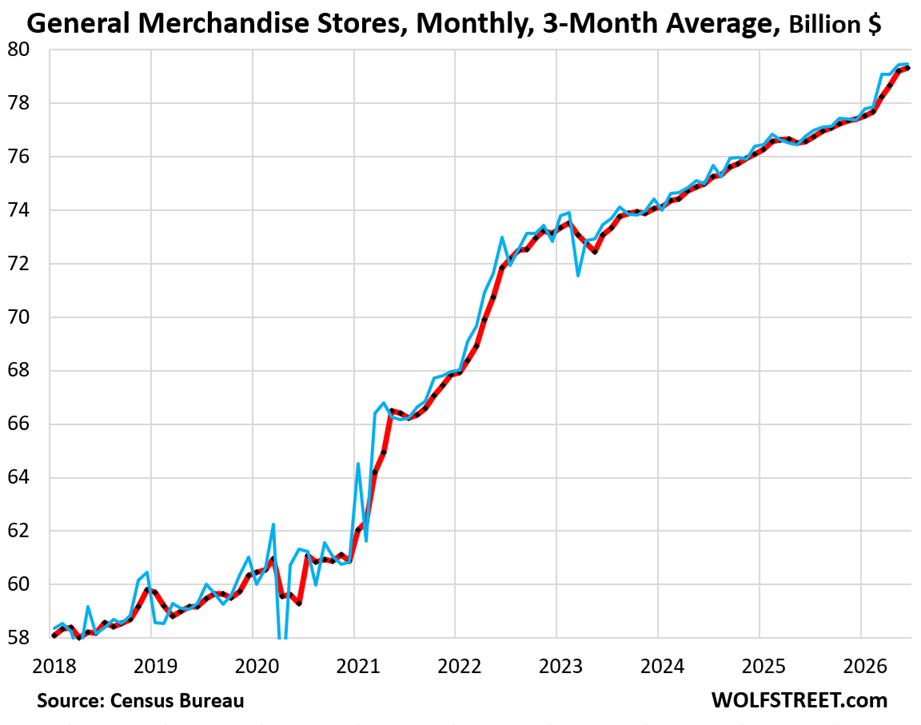
General merchandise stores, a category that includes the physical locations of giants like Walmart and Target, saw a marginal increase of 0.06% in June. Year-over-year, the category grew by 3.2% to $78 billion. While these stores are the primary destination for grocery shoppers, their total growth is often tempered by the fact that their own ecommerce sales are reported in the non-store retailer category.
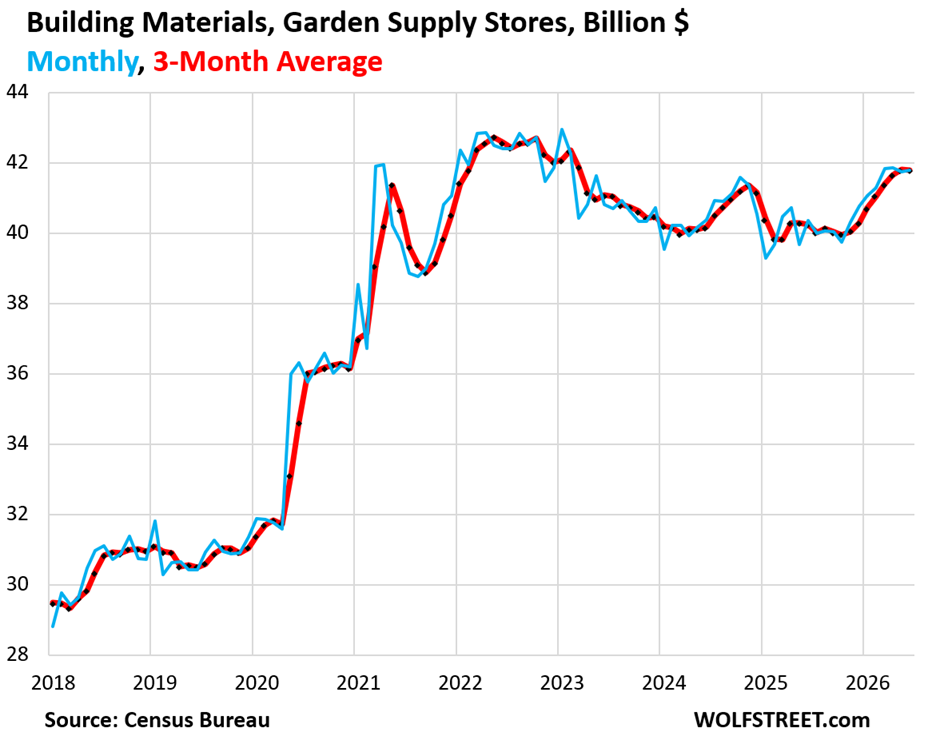
Building materials and garden supply stores saw a 0.11% increase in June, with a year-over-year rise of 6.9% to $47 billion. While these numbers seem healthy, the category has struggled to regain the momentum seen during the pandemic-era home improvement boom. With fewer people buying new homes or moving, the demand for large-scale renovation projects has stabilized, leaving these retailers in a state of "post-lockdown recovery."
Health, Personal Care, and Apparel
The remaining major categories showed signs of cooling in June. Health and personal care stores saw sales fall by 0.81% for the month, though they remain up 2.0% year-over-year. Clothing and accessory stores also saw a monthly decline of 0.31%, though they maintained a 4.8% year-over-year growth rate, reaching $28 billion. These categories are often the first to see a pull-back when consumers prioritize larger purchases like electronics or vehicles.
Economic Implications: A Balancing Act for the Fed
The June retail data presents a challenging narrative for policymakers. On one hand, the plunge in gasoline prices and the decline in core goods prices suggest that inflationary pressures in the "goods" economy are subsiding. On the other hand, the sheer volume of consumer spending—particularly in ecommerce and automotive—suggests that the economy is far from a recessionary "hard landing."
The strength of the consumer, fueled by a robust labor market and a shift away from housing-related savings, provides the Federal Reserve with a complicated backdrop. While the "goods" sector is showing signs of price stability, the persistent demand for services and discretionary items suggests that the "higher for longer" interest rate environment has yet to fully dampen the American appetite for spending. As the second half of 2026 begins, the retail sector stands as a testament to a consumer base that is increasingly choosing to live in the moment, prioritizing current consumption over long-term assets.