Cohort and multi touch attribution – Cohort and multi-touch attribution is a powerful combination for understanding customer journeys and optimizing marketing ROI. It allows businesses to go beyond basic campaign performance metrics, delving into how different customer groups (cohorts) interact with various marketing touchpoints (multi-touch). This detailed exploration will guide you through defining cohorts, understanding multi-touch attribution models, and demonstrating how to integrate these methods to gain actionable insights.
We’ll cover everything from defining different cohort types, like customer, user, and product cohorts, to exploring various multi-touch attribution models like linear, time decay, and position-based. The practical application of combining these two approaches will be illustrated with real-world examples and case studies, highlighting the impact on marketing campaigns and customer experiences.
Defining Cohort Analysis
Cohort analysis is a powerful marketing technique that groups customers or users based on shared characteristics or experiences. This allows marketers to track the behavior of these groups over time, providing valuable insights into customer lifetime value, product performance, and overall campaign effectiveness. By understanding how different groups of customers interact with your offerings, you can tailor strategies to optimize engagement and maximize profitability.
Defining Cohorts
Cohorts are groups of individuals who share a common characteristic or experience within a specific timeframe. This could encompass various categories, such as customers acquired during a particular promotional period, users who downloaded a specific app version, or products launched at the same time. Different types of cohorts exist, each with its own unique application.
Types of Cohorts
- Customer Cohorts: These groups are formed based on when customers joined your platform or made their first purchase. Analyzing customer cohorts reveals insights into acquisition patterns, initial engagement, and long-term customer behavior. For instance, customers acquired during a specific marketing campaign might exhibit different purchase patterns compared to those acquired through organic channels. This differentiation allows for targeted strategies to enhance retention and conversion within specific customer segments.
- User Cohorts: These cohorts are built around user behaviors, such as app version downloads, feature usage, or engagement frequency. Analyzing user cohorts can identify trends in user adoption, highlight specific features that resonate with users, and pinpoint potential areas for improvement in user experience.
- Product Cohorts: These cohorts categorize products based on launch dates or release cycles. Analyzing product cohorts provides insights into product performance, customer response, and potential areas for enhancement. This is especially relevant for companies with multiple product lines or features.
Importance of Cohort Analysis in Marketing
Cohort analysis is crucial for understanding customer behavior and optimizing marketing strategies. By segmenting customers based on shared characteristics, marketers can gain valuable insights into their behaviors and preferences. This allows for the creation of more effective marketing campaigns and product strategies. By tracking cohorts over time, you can see how customer behavior changes, identify emerging trends, and adjust strategies to keep up with customer demands.
Examples of Cohort Analysis in Understanding Customer Behavior
Analyzing cohort behavior can highlight crucial insights into customer journeys. For instance, a cohort of customers acquired through a specific social media campaign might exhibit higher initial engagement but lower long-term retention compared to customers acquired through organic searches. This disparity highlights the need to understand the strengths and weaknesses of different acquisition channels and adapt strategies to address specific cohort behaviors.
Identifying such patterns helps tailor marketing efforts to enhance engagement and maximize customer lifetime value.
Understanding cohort and multi-touch attribution is crucial for any business. It helps you track how different customer groups interact with your marketing campaigns over time. Knowing this data can be a game-changer in strategies to not only retain your current customers but also steal your competition’s followers by identifying their winning strategies. This insightful article on strategies to steal your competitors’ followers can provide valuable tips to improve your own campaigns.
Ultimately, using cohort and multi-touch attribution effectively can dramatically improve marketing ROI.
Key Metrics in Cohort Analysis
Tracking key metrics is essential for measuring the effectiveness of cohort analysis. These metrics provide valuable data points for decision-making and strategic planning. The metrics help gauge the overall health and performance of customer segments, facilitating the development of tailored strategies to address specific cohort needs.
| Metric | Definition | Example |
|---|---|---|
| Retention Rate | Percentage of customers returning for subsequent purchases or engagement. | If 100 customers joined in January, and 80 returned in February, the retention rate is 80%. |
| Churn Rate | Percentage of customers who discontinue engagement or stop making purchases. | If 100 customers joined in January, and 20 stopped using the platform in February, the churn rate is 20%. |
| Average Order Value (AOV) | Average value of orders placed by a specific cohort. | If a cohort placed 50 orders with a total value of $5000, the AOV is $100. |
| Customer Lifetime Value (CLTV) | Projected revenue generated by a customer over their relationship with the company. | Forecasting CLTV helps estimate the potential value of different customer segments. |
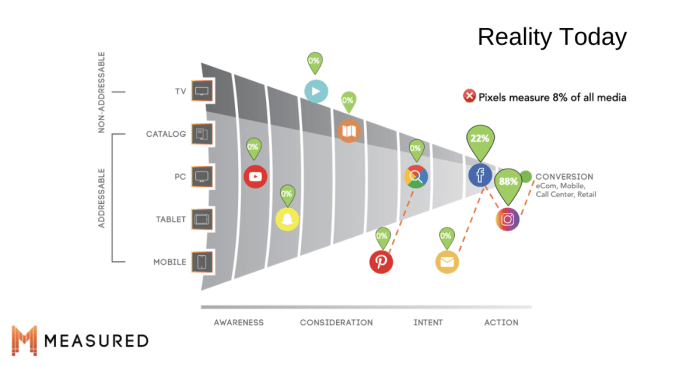
Understanding Multi-Touch Attribution
Multi-touch attribution (MTA) is a powerful technique for understanding how different touchpoints in the customer journey contribute to conversions. It moves beyond the simplistic “last-click” model, recognizing that a customer’s path to purchase often involves multiple interactions with a brand. By assigning credit across these touchpoints, businesses gain a more comprehensive understanding of marketing campaign effectiveness.MTA is crucial for optimizing marketing strategies.
By pinpointing the most impactful touchpoints, businesses can allocate resources effectively, focus on high-performing channels, and improve overall marketing ROI. This detailed analysis allows for more nuanced campaign adjustments, driving better outcomes.
Multi-Touch Attribution Models
Various models exist for distributing conversion credit across multiple touchpoints. These models differ in how they allocate credit, reflecting different assumptions about the customer journey. Choosing the right model is essential for accurate attribution and informed decision-making.
Linear Model
The linear model distributes conversion credit equally across all touchpoints in the customer journey. This is a straightforward approach, suitable for situations where every interaction contributes equally to the conversion. This model assumes that each touchpoint is equally important in moving a customer from initial awareness to a purchase. It’s relatively simple to implement and understand. However, this model may not accurately reflect the varying influence of different touchpoints.
Time Decay Model
The time decay model assigns more weight to touchpoints closer to the conversion. Touchpoints occurring earlier in the journey receive less credit, reflecting the diminishing influence of past interactions. This model reflects the natural tendency for customer engagement to decrease over time. For instance, a touchpoint from a month ago might have less impact on the conversion than one from yesterday.
This model often provides a more realistic representation of the customer journey, but requires careful consideration of the appropriate decay rate.
Position-Based Model
The position-based model assigns varying weights based on the touchpoint’s position in the customer journey. Early touchpoints (e.g., awareness) receive less credit, while those closer to the conversion (e.g., final purchase) receive more. This model assumes a progression in the customer journey, recognizing that some touchpoints have a greater impact on moving the customer toward a purchase. The position-based model often delivers a better understanding of which touchpoints drive conversions at various stages of the funnel.
Example Applications of MTA
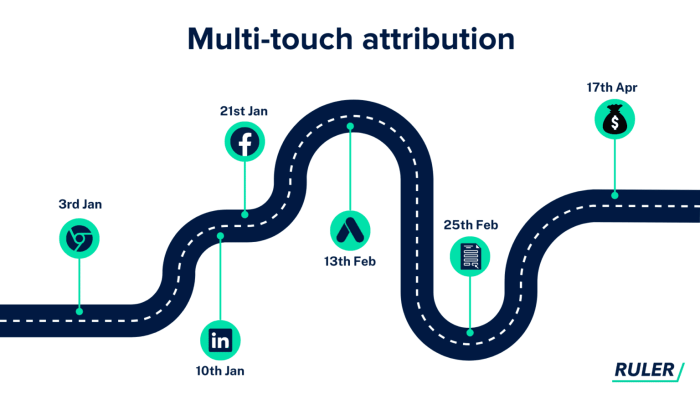
MTA can be applied to various marketing channels, from social media to email marketing. For instance, a user might see an advertisement on Facebook (touchpoint 1), read a blog post on the company website (touchpoint 2), and then make a purchase through a phone call (touchpoint 3). MTA can analyze these interactions and assign credit to each channel.
This allows marketers to identify which channels are most effective in driving conversions.
Comparison of MTA Models
| Model | Credit Allocation | Advantages | Disadvantages |
|---|---|---|---|
| Linear | Equal credit to all touchpoints | Simple to implement, easy to understand | May not accurately reflect varying touchpoint influence |
| Time Decay | More weight to touchpoints closer to conversion | More realistic representation of customer journey | Requires careful consideration of decay rate |
| Position-Based | Varying weights based on touchpoint position | Better understanding of touchpoint impact at different funnel stages | Can be complex to implement and interpret |
Connecting Cohort Analysis and MTA
Cohort analysis, by itself, provides a valuable snapshot of user behavior over time. However, to truly understand the drivers behind that behavior, especially within a marketing context, multi-touch attribution (MTA) data is essential. Integrating these two powerful analytical tools allows for a deeper dive into customer journeys and a more nuanced understanding of campaign effectiveness.By combining cohort analysis with MTA, marketers can identify not only which users convert, but
- why* and
- how* they converted. This synergy provides a more holistic view of the customer experience, allowing for more targeted and effective marketing strategies. This integration allows for dynamic adjustments based on observed patterns, rather than relying on static assumptions.
Integrating MTA Data into Cohort Analysis
Cohort analysis excels at identifying patterns within user groups over time. Adding MTA data allows for the identification of specific touchpoints that influenced conversions within each cohort. This deeper understanding of the conversion path reveals opportunities for optimization within individual cohorts. For example, a cohort might show a high conversion rate on a specific landing page, but if MTA data reveals that a different ad campaign drives the most conversions to that landing page, the campaign can be prioritized or adjusted to optimize performance for that specific cohort.
Segmenting Cohorts Based on MTA Data
MTA data provides the granularity needed to segment cohorts beyond simple demographics. By analyzing which marketing channels and touchpoints influence conversions most for each cohort, marketers can create segments based on user behavior. This enables targeted marketing campaigns to resonate more effectively with the unique needs and preferences of each segment. For example, one cohort might convert predominantly through social media ads, while another might respond more strongly to email marketing.
Key Metrics to Track for Cohorts Using MTA Data
Tracking key metrics like conversion rate, average order value, and customer lifetime value (CLTV) across cohorts using MTA data provides valuable insights. This analysis allows marketers to evaluate the impact of different campaigns on different cohorts, pinpointing which campaigns yield the highest ROI for specific groups. For instance, a cohort might have a significantly higher CLTV after engaging with a specific webinar series.
Improving MTA Model Accuracy with Cohort Analysis
Cohort analysis can enhance the accuracy of MTA models by identifying potential biases or inaccuracies. By observing how different cohorts respond to various marketing touchpoints, marketers can identify and address these biases, leading to a more accurate and reliable MTA model. This is especially important in industries where customer journeys are complex and variable. For example, if a particular cohort is consistently underperforming in an MTA model, cohort analysis might reveal a specific marketing channel or touchpoint that is causing issues.
Adjusting Marketing Strategies Based on MTA and Cohort Insights
Combining cohort analysis and MTA data allows for the development of more targeted and effective marketing strategies. By understanding the specific touchpoints and channels that influence conversion for each cohort, marketers can tailor their campaigns to resonate more effectively with individual groups. This dynamic approach can lead to higher conversion rates and a stronger return on investment (ROI).
For instance, if a cohort responds particularly well to a specific type of content, marketers can adjust their content strategy to focus on similar content for that cohort.
Workflow of Integrating Cohort Analysis and MTA Data
| Step | Description |
|---|---|
| 1. Define Cohorts | Identify the criteria for creating cohorts (e.g., acquisition date, demographics). |
| 2. Gather MTA Data | Collect data on touchpoints and conversions for each user. |
| 3. Analyze MTA Data for Cohorts | Determine the most influential touchpoints for each cohort. |
| 4. Segment Cohorts Based on MTA | Identify key behavioral patterns and segment cohorts based on these insights. |
| 5. Track Key Metrics | Monitor conversion rate, average order value, and CLTV for each cohort and segment. |
| 6. Refine Marketing Strategies | Adjust marketing strategies based on the observed patterns and insights from the analysis. |
Practical Applications of Combined Analysis
Combining cohort analysis and multi-touch attribution (MTA) provides a powerful lens for understanding customer journeys and optimizing marketing campaigns. This combined approach allows businesses to move beyond simple campaign performance metrics to a deeper understanding of how different customer segments interact with their marketing efforts over time. It’s about understanding not just
- what* worked, but
- why* and
- for whom*.
This detailed exploration will showcase how businesses leverage these tools together to refine strategies, personalize experiences, and ultimately, boost marketing return on investment (ROI). We’ll dive into practical examples, case studies, and a critical evaluation of the challenges involved in successfully implementing this powerful technique.
Examples of Combined Analysis in Action
Understanding how different customer segments respond to marketing campaigns is crucial for optimizing strategies. Cohort analysis identifies these segments, while MTA tracks the touchpoints within those segments that drive conversions. By combining these insights, businesses can tailor their messaging and channels for optimal impact.For example, a SaaS company might observe that a cohort of users acquired through a specific webinar series shows significantly higher churn rates than other cohorts.
MTA analysis could reveal that while the webinar initially generated enthusiasm, users lacked sufficient onboarding materials and support post-purchase. By combining the insights, the company can develop targeted onboarding programs specifically for users acquired through that channel, addressing the identified pain points and potentially reducing churn. Another example is an e-commerce company using cohort analysis to segment customers based on their purchase frequency and MTA to pinpoint the specific marketing channels influencing each segment’s purchasing decisions.
This allows the company to optimize product recommendations, personalized emails, and promotional offers for each group.
Improving Marketing ROI through Combined Analysis
The combined approach directly impacts marketing ROI by providing actionable insights for improvement. Analyzing the customer journey, the effectiveness of various touchpoints, and the behavior of specific cohorts allows businesses to optimize their marketing spend. For instance, a company selling high-value products could find that while social media advertising initially attracts customers, a subsequent email nurture campaign is crucial for conversions.
By understanding this through combined analysis, they can allocate resources more efficiently, reducing spend on channels that aren’t driving desired results and amplifying the impact of those that are.Another example is a retail company targeting customers with a specific discount. They can use cohort analysis to see which customers are most likely to respond positively to such discounts and use MTA to understand the channels that led those customers to make a purchase.
By focusing on those channels and customer segments, they can improve their marketing ROI significantly.
Personalizing Customer Experiences
A key benefit of the combined approach is the ability to create highly personalized customer experiences. By understanding which touchpoints resonate most strongly with different cohorts, businesses can tailor their communications and offers. For instance, a financial services company could identify that a specific cohort of customers who engage with their educational resources online tend to have a higher interest in long-term investment products.
They can then personalize their marketing messages and product recommendations accordingly. This fosters customer loyalty and drives higher engagement. This level of personalization goes beyond simply recognizing a customer; it’s about anticipating their needs and providing solutions aligned with their journey.
Challenges in Implementing Combined Analysis
While powerful, implementing cohort analysis and MTA together presents challenges. Data integration and accuracy are crucial. Data silos, disparate systems, and inconsistencies in data formats can make it difficult to combine the insights effectively. The sheer volume of data can also be a hurdle, demanding sophisticated analytical tools and expertise.Another challenge is the need for skilled personnel who can interpret the data and translate it into actionable strategies.
Cohort and multi-touch attribution are crucial for understanding customer journeys. However, a significant part of any marketing campaign is figuring out why some customers don’t convert, which is a challenge often overlooked. Understanding the specific behaviours of these customers, as detailed in this article on customer who doesnt convert , can provide valuable insights to refine your cohort analysis and multi-touch attribution models.
Ultimately, a more precise understanding of the customer journey through improved cohort and multi-touch attribution is key to driving better conversion rates.
The analysis also requires an iterative approach. What works for one cohort may not work for another, demanding continuous refinement based on real-time feedback.
Potential Challenges and Solutions, Cohort and multi touch attribution
| Challenge | Solution |
|---|---|
| Data Integration and Accuracy | Establish a centralized data warehouse, standardize data formats, and implement data quality checks. |
| Data Volume and Complexity | Invest in advanced analytics tools and hire data scientists with expertise in handling large datasets. |
| Lack of Skilled Personnel | Invest in training programs for existing employees or hire specialized personnel with expertise in cohort analysis and MTA. |
| Iterative Approach | Establish a feedback loop between data analysis and marketing strategy, implementing A/B testing and continuous monitoring. |
Visualizing Cohort and MTA Data: Cohort And Multi Touch Attribution
Understanding cohort and multi-touch attribution (MTA) data is crucial for effective marketing analysis. However, raw data alone often lacks the impact needed to communicate insights effectively. Visualizations are key to translating complex data into actionable strategies, allowing stakeholders to quickly grasp trends and patterns. This section explores the power of visualization techniques to present cohort and MTA data clearly and persuasively.
Visualizing Cohort Analysis Results
Cohort analysis reveals how different user groups behave over time. Effective visualization helps to pinpoint trends and patterns in customer behavior. Visual representations should clearly depict the evolution of cohorts and highlight any significant differences between them. Visualizations can range from simple line charts to more complex area charts or stacked bar graphs.

- Line Charts: These are excellent for showcasing the progression of cohort metrics over time. For example, a line chart can display the average revenue generated by different cohorts over a period of six months. Each cohort’s revenue trend can be plotted on the same chart for easy comparison. Different colors can differentiate each cohort, while trendlines can highlight the overall pattern of revenue growth or decline.
- Area Charts: Similar to line charts, area charts visualize the cumulative total for each cohort over time. They’re particularly useful when you want to show the total accumulated value of a cohort over a period, such as total sales generated by a particular cohort over a year. By visually filling the area beneath the lines, area charts emphasize the overall magnitude of the change.
- Stacked Bar Charts: Stacked bar charts are useful for displaying cohort performance across different categories, such as acquisition channel. Each bar represents a cohort, and the segments within the bar illustrate the proportion of revenue or conversions originating from different channels. For example, a stacked bar chart can show the percentage of sales attributed to different channels for different cohorts, revealing patterns in channel effectiveness.
Visualizing MTA Data Across Channels
MTA data helps determine the contribution of each touchpoint in a customer’s journey. Visualizing this data across channels provides a clear understanding of how various marketing efforts influence conversions.
Understanding cohort and multi-touch attribution is crucial for any business looking to optimize their marketing efforts. Knowing how different customer segments (cohorts) interact with your site, from initial awareness to conversion, is key. A well-designed pricing page that converts, like the one described in this detailed guide pricing page that converts , can significantly impact your conversion rates, which in turn, improves the accuracy of your cohort and multi-touch attribution data.
This data allows for more precise analysis of marketing campaigns and customer journeys.
- Heatmaps: Heatmaps are particularly effective for visualizing MTA data. Different colors can represent the impact of each touchpoint, allowing stakeholders to quickly identify high-performing and underperforming channels. The intensity of the color indicates the strength of the touchpoint’s influence. For example, a heatmap can show the conversion rates of various touchpoints, allowing you to identify which touchpoints are most important for conversions.
- Bar Charts: Bar charts can effectively illustrate the contribution of different channels to conversions. Each bar can represent a channel, and the height of the bar corresponds to the percentage of conversions attributed to that channel. This visualization allows for a direct comparison of channel performance.
- Funnel Charts: Funnel charts are helpful for illustrating the customer journey through various touchpoints. The stages of the funnel can be different channels (e.g., website, social media, email), and the width of each stage represents the number of users who completed that stage. This visualization can reveal bottlenecks in the conversion process.
Combining Cohort and MTA Data Visualizations
Combining cohort and MTA data visualizations provides a more comprehensive view of customer behavior.
- Line Charts with MTA Data: For example, a line chart showing the revenue generated by a cohort can be enhanced by incorporating MTA data as a secondary axis. This dual axis displays the percentage of revenue attributed to each channel for each cohort over time. This combined visualization enables a better understanding of how channels contribute to the revenue generated by different cohorts over time.
- Interactive Dashboards: Interactive dashboards can display various visualizations simultaneously, allowing stakeholders to drill down into specific cohorts or channels. These dashboards can connect cohort analysis with MTA data to identify which channels are most effective for specific cohorts.
Chart Type Recommendations
| Data Type | Best Chart Type | Description |
|---|---|---|
| Cohort Revenue Trend | Line Chart | Visualizes the revenue generated by different cohorts over time. |
| MTA Channel Contribution | Bar Chart | Illustrates the percentage of conversions attributed to each channel. |
| Cohort Performance Across Channels | Stacked Bar Chart | Shows the proportion of revenue or conversions from different channels for each cohort. |
| Customer Journey Through Touchpoints | Funnel Chart | Visualizes the stages of the customer journey and the number of users completing each stage. |
Tools and Technologies for Implementation
Successfully implementing cohort analysis and multi-touch attribution (MTA) requires the right tools and technologies. Choosing the appropriate platforms allows for efficient data collection, processing, and analysis, leading to actionable insights. This section details various tools and their integration possibilities.
Cohort Analysis Tools
Cohort analysis tools are crucial for segmenting users and tracking their behavior over time. They often come integrated with marketing platforms or are standalone solutions. These tools often offer robust reporting features, enabling detailed visualizations and analysis of key metrics.
- Google Analytics 4 (GA4): GA4 is a powerful tool for collecting and analyzing user data. It allows defining cohorts based on various criteria, such as acquisition date, demographics, or specific actions. GA4 provides detailed reports on cohort behavior over time, including retention rates, conversion rates, and engagement metrics.
- Amplitude: Amplitude is a popular platform for user engagement analysis. It allows the creation of cohorts based on diverse criteria and the tracking of various user interactions within an application. Detailed reporting capabilities enable deep dives into user behavior and cohort performance.
- Mixpanel: Mixpanel is another comprehensive platform designed for understanding user behavior. It allows the creation of custom cohorts, offering a wealth of data points and visualizations for analyzing trends and patterns across user groups.
- Heap Analytics: Heap is a powerful tool for understanding user journeys and identifying trends. It excels in tracking user interactions across a website or application and allows for defining cohorts based on these interactions.
MTA Tools
Multi-touch attribution (MTA) tools are vital for understanding the impact of various marketing channels on conversions. They attribute conversions to multiple touchpoints rather than just the last interaction. Advanced MTA models analyze data to determine the value of each touchpoint.
- Google Analytics 4 (GA4): GA4 offers various MTA models (e.g., linear, time decay, position-based) to understand the influence of different touchpoints on conversions. This feature is built into the core platform, streamlining the process.
- Kochava: Kochava provides a comprehensive platform for mobile attribution and analytics, enabling granular analysis of the role of various marketing channels in app installs and conversions.
- Adjust: Adjust is another prominent mobile attribution solution. It offers advanced attribution models, providing valuable insights into campaign performance and the contribution of different channels.
- AppsFlyer: AppsFlyer is a powerful mobile attribution tool that offers sophisticated reporting and analysis of app install and user engagement data. It also offers various MTA models.
Integrating Cohort and MTA Tools
Integrating cohort analysis and MTA tools enables a holistic view of customer journeys. This combined approach reveals how different user segments respond to marketing campaigns and which channels are most effective for each cohort.
- Data Integration: Tools like Zapier or similar integrations can link data from cohort and MTA platforms to facilitate cross-platform analysis.
- Custom Reporting: Many platforms allow for custom reporting or the creation of dashboards that combine cohort and MTA metrics, providing a unified view of campaign performance.
Combined Tools and Platforms
Some platforms offer both cohort and MTA functionalities. These integrated solutions streamline the analysis process and provide a unified view of user behavior and campaign performance.
- Google Analytics 4 (GA4): GA4, as mentioned earlier, allows for both cohort analysis and MTA, streamlining the process for marketers.
Summary Table
| Tool | Cohort Analysis Features | MTA Features | Integration |
|---|---|---|---|
| Google Analytics 4 | Cohort segmentation, reporting, visualizations | Various MTA models, channel attribution | Built-in, seamless integration |
| Amplitude | Cohort creation, reporting, user segmentation | Attribution modeling | Requires external integration for comprehensive MTA |
| Mixpanel | Custom cohort creation, user journey analysis | Attribution modeling | Requires external integration for comprehensive MTA |
| Kochava | Cohort segmentation | Advanced mobile attribution | Mobile-centric integration, likely requiring custom configurations |
Final Summary

In conclusion, mastering cohort and multi-touch attribution is key to crafting effective marketing strategies that resonate with specific customer segments. By integrating these powerful analytical tools, businesses can gain a more granular understanding of customer behavior, optimize marketing campaigns, and ultimately drive significant improvements in ROI. This comprehensive guide provides a structured approach to successfully implementing this powerful combination.