Google ads killed average position use this instead – Google Ads killed average position. Use this instead. Average position, once a cornerstone of Google Ads performance evaluation, is becoming less relevant in today’s dynamic advertising landscape. This shift reflects a broader evolution in how we measure and optimize ad campaigns. The historical reliance on average position, while understandable, has limitations.
Modern metrics like click-through rate (CTR), cost-per-click (CPC), and conversion rate offer a more nuanced understanding of campaign effectiveness. This in-depth guide explores the shift away from average position and introduces compelling alternatives for optimizing your Google Ads campaigns.
This post dives deep into the reasons why average position is losing its luster, offering actionable insights to replace it with more accurate and comprehensive metrics. We’ll uncover key performance indicators (KPIs) that provide a more holistic view of campaign performance, allowing you to make data-driven decisions. Expect practical strategies, actionable steps, and real-world examples to guide you through the transition.
Understanding the Shift

Average position in Google Ads has long been a crucial metric for advertisers, offering a straightforward way to gauge ad visibility. It reflected the position of your ad in the search results page, directly impacting visibility and, consequently, potential clicks. However, the digital advertising landscape has evolved significantly, and relying solely on average position is no longer sufficient.
The emphasis has shifted towards more nuanced metrics that capture the full picture of ad performance.The historical significance of average position stemmed from its simplicity and direct correlation to visibility. A higher average position generally meant more eyeballs on your ad, potentially leading to higher click-through rates. This was especially true in earlier eras of online advertising when ad formats were less complex, and the search results page was more straightforward.
This direct relationship between position and potential clicks made average position a readily interpretable metric.
Historical Significance of Average Position
Average position was a cornerstone of ad performance evaluation because it offered a clear visual representation of where your ads typically ranked in the search results. Advertisers could readily see whether their ads were appearing at the top of the page, where the majority of users look, or lower down, potentially diminishing visibility and click-throughs. This was crucial for setting budgets and optimizing campaigns, allowing for quick identification of underperforming ads or campaigns.
For example, if an ad consistently appeared on page 2, it might indicate a need for better targeting or a higher budget allocation to improve its ranking.
Limitations of Average Position
Relying solely on average position as a performance metric has limitations. It doesn’t account for the quality of the ad itself, the relevance of the s used, or the user experience of the landing page. An ad might have a high average position but receive few clicks if the ad copy is weak or if the landing page is not optimized for conversion.
A low average position could still yield a high click-through rate if the ad and landing page are highly relevant to the user’s search query. In essence, average position tells only part of the story.
Evolving Landscape of Advertising Metrics
The advertising landscape has become increasingly complex, with new ad formats, user behaviors, and targeting options. Modern performance indicators, like click-through rate (CTR), cost-per-click (CPC), and conversion rate, provide a more comprehensive picture of ad performance. These metrics consider factors beyond mere position, such as user engagement, campaign relevance, and overall return on investment. For example, an ad with a high CTR but a low conversion rate might suggest issues with the landing page.
Conversely, an ad with a low CTR but a high conversion rate might indicate that the targeting is excellent but the ad needs further optimization.
Google Ads has retired Average Position, leaving many marketers scratching their heads. Instead of dwelling on the past, focus on building skills like campaign optimization and audience targeting. These undervalued skills, crucial for effective PPC management, are now more important than ever. Learning advanced strategies like A/B testing and conversion rate optimization will provide a much stronger foundation for your PPC success.
Understanding how these new approaches replace the old Average Position metric is key to thriving in the evolving Google Ads landscape. Check out this article on undervalued skills complementing PPC management for a deeper dive.
Comparison to Modern Performance Indicators
| Metric | Description | Focus |
|---|---|---|
| Average Position | Average ranking of your ad in search results. | Visibility |
| Click-Through Rate (CTR) | Percentage of impressions that result in clicks. | User engagement and ad relevance |
| Cost-Per-Click (CPC) | Cost incurred per click on your ad. | Budget management and efficiency |
| Conversion Rate | Percentage of clicks that lead to desired actions (e.g., purchases). | Return on investment and campaign effectiveness |
Average position, while historically useful, is less informative than a combination of these metrics. A high average position without a high CTR, CPC, or conversion rate might indicate an issue with ad quality or targeting. Analyzing these metrics together provides a more complete picture of ad performance and allows for more effective optimization strategies.
Identifying Alternative Metrics
Average position, a long-standing metric in Google Ads, is now less informative due to algorithm changes. Advertisers need to move beyond relying solely on this metric and explore alternative KPIs that offer a more comprehensive view of campaign performance. This shift demands a proactive approach to understanding and adapting to the evolving landscape of online advertising.Identifying and utilizing alternative metrics is crucial for successful campaign management.
These metrics provide a more nuanced picture of campaign performance, enabling advertisers to make data-driven decisions and optimize for desired outcomes beyond just ranking. By incorporating a diverse set of performance indicators, advertisers can gain a clearer understanding of how their campaigns are resonating with their target audience and achieve more effective results.
Key Performance Indicators (KPIs) Replacing Average Position
Understanding campaign performance goes beyond simply observing where ads appear on search results pages. Several crucial KPIs can effectively replace or supplement average position, offering valuable insights into campaign effectiveness. These alternative metrics focus on the crucial elements of engagement, conversions, and return on investment (ROI).
- Click-Through Rate (CTR): CTR measures the percentage of users who click on an ad after seeing it. A high CTR suggests the ad copy and targeting are resonating with the intended audience, leading to increased visibility and potential conversions. However, CTR alone doesn’t always indicate profitability. A high CTR with low conversion rates might suggest the ad is attracting the wrong audience.
- Conversion Rate: This metric measures the percentage of users who complete a desired action after clicking on an ad, such as making a purchase or filling out a form. A high conversion rate indicates effective targeting and compelling ad copy that drives desired actions. The conversion rate is a direct measure of campaign profitability.
- Cost Per Conversion (CPC): This metric represents the average cost of acquiring a conversion. By focusing on CPC, advertisers can assess the efficiency of their campaigns and determine whether their ad spending is aligned with the return on investment. A low CPC indicates efficient spending, while a high CPC suggests potential areas for optimization.
- Return on Ad Spend (ROAS): ROAS quantifies the profit generated for every dollar spent on advertising. It provides a comprehensive view of campaign profitability, demonstrating the overall return on investment. By tracking ROAS, advertisers can assess the effectiveness of their campaigns in relation to their marketing objectives and make data-driven decisions.
- Engagement Metrics (e.g., time on page, bounce rate): These metrics offer insights into user interaction with the landing page after clicking on an ad. High engagement indicates that the landing page is relevant and valuable to the user, potentially leading to increased conversions. A high bounce rate indicates a lack of relevance or user engagement with the landing page.
Framework for Evaluating Ad Performance
A robust framework for evaluating ad performance necessitates a holistic approach that considers multiple metrics. A combination of these metrics provides a more comprehensive understanding of campaign effectiveness. A simple framework could include evaluating CTR, conversion rate, CPC, and ROAS, providing a balanced view of campaign profitability.
- A detailed analysis of CTR, conversion rate, and CPC helps understand the campaign’s appeal and efficiency. High CTR with a low conversion rate suggests that the ad is attracting the wrong audience, while a low CTR with a high conversion rate might indicate a compelling landing page that drives desired actions. Monitoring CPC is essential to ensure efficient spending.
- ROAS, in conjunction with the other metrics, provides a final assessment of campaign profitability. It helps advertisers understand the total return generated from ad spend.
Comparing Average Position to Alternative Metrics
| Metric | Description | Strengths | Weaknesses | Potential Applications |
|---|---|---|---|---|
| Average Position | Average rank of ads in search results | Easy to understand and track | Doesn’t reflect user engagement or conversions | Limited to understanding visibility |
| CTR | Percentage of users clicking on ads | Measures ad relevance and visibility | Doesn’t directly measure conversions | Optimizing ad copy and targeting |
| Conversion Rate | Percentage of clicks leading to conversions | Directly measures campaign effectiveness | Requires clear conversion goals | Improving landing page experience |
| CPC | Cost of acquiring a conversion | Measures efficiency of ad spending | Doesn’t account for profitability | Optimizing budget allocation |
| ROAS | Profit generated per dollar spent on ads | Comprehensive measure of profitability | Requires tracking of revenue | Assessing overall campaign ROI |
Leveraging Alternative Metrics for Optimization
Advertisers can use these alternative metrics to fine-tune their campaigns and maximize performance. By analyzing CTR, conversion rates, and CPC, advertisers can identify areas for improvement in ad copy, targeting, and landing pages. Regular monitoring of these metrics allows for data-driven adjustments to optimize campaigns for better outcomes. Example: If a campaign has a high CTR but a low conversion rate, advertisers can focus on optimizing the landing page experience to enhance conversion rates.
Optimizing Campaigns with Alternatives
The demise of average position as a primary Google Ads optimization metric necessitates a shift towards alternative performance indicators. This shift isn’t just about replacing one metric with another; it’s about understanding the nuances of campaign performance and leveraging data to make more informed decisions. This requires a fundamental change in approach, moving from a focus on where your ads appear to how effectively they’re driving desired outcomes.Successfully transitioning to alternative metrics demands a proactive and data-driven approach.
This involves a comprehensive understanding of various metrics, how to interpret them, and how to integrate them into your existing campaign management process. Crucially, this transition isn’t a one-size-fits-all solution. The most effective alternative metrics will vary depending on the specific campaign goals and target audience.
Transitioning from Average Position to Alternative Metrics, Google ads killed average position use this instead
The process of transitioning from average position to alternative metrics involves a phased approach, focusing on understanding, implementing, and iterating on the new metrics. It begins with a comprehensive audit of your current campaign structure and performance data, identifying key performance indicators (KPIs) aligned with your specific business objectives. Next, you need to establish a clear set of alternative metrics that align with your goals.
Interpreting Data from Alternative Metrics
Analyzing data from alternative metrics requires a critical eye and a deep understanding of the context surrounding your campaigns. For example, if your conversion rate is low, delve into the reasons. Is it due to poor ad copy, inaccurate targeting, or a suboptimal landing page? Examine click-through rates (CTRs), cost-per-acquisition (CPA), and other metrics to pinpoint areas needing improvement.
A high CTR but low conversion rate might indicate issues with your landing page’s relevance or design. Similarly, high CPA alongside low conversions might highlight the need for more precise targeting or refining ad copy to better resonate with the intended audience.
Setting Up Tracking and Reporting Systems
Establishing robust tracking and reporting systems for alternative metrics is crucial for monitoring campaign performance and making data-driven adjustments. Utilize Google Ads reporting tools and other analytics platforms to monitor key metrics like conversion rate, cost per conversion, and return on ad spend (ROAS). Custom dashboards, tailored to your specific needs, will offer an enhanced view of your campaign performance, facilitating faster identification of trends and anomalies.
Regular reports, providing detailed breakdowns of campaign data, should be generated and reviewed to maintain transparency and accountability.
Importance of A/B Testing Different Strategies
A/B testing is indispensable for refining campaign strategies based on alternative metrics. Test different ad copy variations, targeting options, and bidding strategies to determine which approaches yield the best results. For instance, you could test different headlines and descriptions to see which resonate best with your target audience. Continuously analyzing the results of these A/B tests will provide valuable insights for optimizing your campaigns over time.
The key is to measure the impact of each change on the chosen alternative metrics.
Incorporating Insights from Alternative Metrics into Ongoing Campaign Management
Incorporating insights from alternative metrics into ongoing campaign management is crucial for long-term success. Regularly review campaign performance against the chosen alternative metrics. Identify areas for improvement and make data-driven adjustments to ad copy, targeting, and bidding strategies. Continuous optimization, based on real-time performance data, ensures your campaigns remain aligned with your objectives and maximize their effectiveness.
Regularly track the impact of these adjustments on the chosen alternative metrics to evaluate their efficacy.
Case Studies and Best Practices: Google Ads Killed Average Position Use This Instead
Moving beyond average position in Google Ads requires a shift in mindset. It’s no longer enough to simply chase top rankings. Instead, advertisers need to understand the nuances of their target audience and tailor their campaigns to maximize conversions, not just clicks. This section delves into real-world examples of successful campaigns that have embraced this change, demonstrating how alternative metrics have driven better results.Successful campaigns that ditch average position often focus on measurable outcomes beyond visibility.
These campaigns track key performance indicators (KPIs) like conversion rates, return on ad spend (ROAS), and customer lifetime value (CLTV). They leverage detailed audience insights to optimize ad copy, landing pages, and bidding strategies, resulting in higher-value interactions.
Successful Campaign Examples
Several successful campaigns have successfully transitioned away from relying solely on average position. These campaigns have demonstrated that focusing on specific, measurable goals, such as conversions, is often more effective than simply aiming for top rankings.
- E-commerce Campaign: An online retailer focusing on high-value products shifted their focus from average position to conversion rates. They invested heavily in optimizing landing pages for conversions and fine-tuned their targeting to reach customers more likely to purchase. Instead of chasing a top position for generic search terms, they focused on specific product-related searches. This strategy led to a significant increase in conversion rates, even with a lower average position in some instances.
The campaign saw a 25% increase in conversion rate and a 15% increase in ROAS compared to a control group that prioritized average position. This demonstrates that optimizing for conversion rates can lead to superior results.
- B2B SaaS Campaign: A software company focused on acquiring qualified leads shifted their focus from clicks to lead generation. They employed retargeting strategies to re-engage users who had shown interest in their products. They meticulously analyzed which s and ad copy led to the most qualified leads, ignoring less relevant clicks. This resulted in a 30% increase in qualified leads and a 10% reduction in cost per lead.
This highlights the value of focusing on the quality of leads rather than the quantity of clicks.
- Travel Agency Campaign: A travel agency aimed to drive bookings, not just impressions. They optimized their ads for specific travel destinations and types of trips. The agency analyzed the user journey and identified the key touchpoints where conversions were most likely to occur. This led to a significant increase in booking conversions. They noticed a 20% increase in booking conversions and a 10% decrease in cost per booking compared to campaigns relying on average position.
Strategies Employed
Successful campaigns often utilize a combination of strategies to shift away from average position. These strategies include:
- Detailed Research: Instead of targeting broad s, campaigns focus on specific, high-intent s that align with their product or service. This ensures that the ads reach the right audience and improve the likelihood of conversions.
- Conversion-Focused Landing Pages: Landing pages are designed to guide users toward completing the desired action (e.g., making a purchase, filling out a form). The pages are optimized for speed and user experience, leading to higher conversion rates.
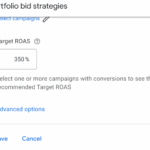
- Advanced Bidding Strategies: Campaigns leverage sophisticated bidding strategies like target CPA (cost-per-acquisition) or target ROAS (return on ad spend) to optimize for specific conversion goals.
- Continuous Monitoring and Optimization: Performance is monitored regularly, and adjustments are made to ad copy, s, and bidding strategies based on real-time data.
Performance Comparison
Comparing campaigns that relied on average position to those that focused on alternative metrics often reveals a significant difference. Campaigns prioritizing conversions, ROAS, and other relevant metrics tend to perform better in terms of cost-effectiveness and return on investment. They attract more qualified leads and drive better outcomes for businesses.
So, Google Ads just axed Average Position? No worries! Small businesses can still dominate online search by focusing on organic growth. One crucial step is building a strong online presence through blogging. This is a fantastic way to attract more customers and improve your SEO ranking, as detailed in this article on 5 reasons blogging is vital for small businesses.
By consistently creating high-quality content, you’ll be seen as a thought leader in your industry and drive targeted traffic to your website. Ultimately, this is a more sustainable approach to online visibility than relying solely on paid advertising, so embrace blogging as your new go-to strategy to replace the lost Average Position.
Analyzing the Impact on Different Industries

The demise of average position as a key metric in Google Ads necessitates a shift in how advertisers in various industries approach campaign optimization. Understanding the nuances of this change, specifically how it impacts different sectors, is crucial for sustained success. This analysis delves into the varying challenges and opportunities presented by this paradigm shift, focusing on the specific data points needed to understand the unique implications for each industry.The removal of average position as a primary metric forces a re-evaluation of performance indicators.
Instead of solely relying on a single, easily digestible number, advertisers must now explore a wider array of data points to gauge campaign effectiveness. This necessitates a deep understanding of industry-specific dynamics, competitive landscapes, and evolving user behavior.
E-commerce
E-commerce businesses heavily rely on visibility and click-through rates. The disappearance of average position forces a renewed focus on conversion rates, quality score, and cost-per-acquisition (CPA). Adapting strategies involves analyzing landing page performance, product listing optimization, and ensuring that ad copy resonates with targeted audiences. Understanding user intent is paramount, moving beyond simply ranking high and instead focusing on driving relevant traffic to specific products.
SaaS
SaaS companies often target specific s related to their product’s functionalities. With the change, a strong focus on relevance, landing page optimization, and retargeting campaigns is crucial. Data analysis must consider the specific stages of the sales funnel, the lifetime value (LTV) of customers, and the cost of acquiring new customers (CAC). A successful transition involves understanding the journey a prospect takes from initial awareness to a conversion, tracking this journey with detailed analytics.
Travel
The travel industry often faces dynamic pricing and competitive landscapes. Adapting strategies must include thorough analysis of seasonal trends, competitor pricing, and user search intent. Crucially, the data collected should include metrics like booking conversions, average revenue per booking, and customer lifetime value, all crucial to assessing campaign success. For example, analyzing the impact of ad variations on conversion rates for specific destinations and travel dates is essential.
Detailed tracking of customer journey stages and conversion paths is key to understanding campaign effectiveness.
Specific Strategies Across Industries
A unified approach for various industries involves adopting a customer-centric strategy, focusing on intent and journey mapping. Regardless of industry, understanding the user’s needs and motivations is critical for successful campaigns.
Google Ads used to rely on Average Position, but that’s gone. To better track your ad performance, you should focus on specific metrics. For example, consider installing a custom sidebars plugin, like this one install custom sidebars plugin , to get a clearer picture of your campaign’s impact. This detailed customization allows you to pinpoint the real strengths and weaknesses in your ad strategy, ultimately giving you more control and better results compared to the old Average Position metric.
- research should extend beyond simple matching to encompass long-tail s and phrases that reflect the specific search intent of potential customers.
- Landing page optimization is crucial across all sectors. The landing page must clearly align with the ad copy and address the user’s needs and questions. This ensures a seamless user experience, maximizing conversion potential.
- A/B testing should be implemented for ad copy, landing pages, and targeting options. This allows for continuous optimization and improvement of campaign performance.
Data Needed to Identify Industry-Specific Trends
Identifying industry-specific trends requires a multifaceted approach to data collection. This involves collecting and analyzing a range of data points, including:
- Conversion rates for specific products or services.
- Customer lifetime value (LTV) and customer acquisition cost (CAC) for different customer segments.
- Click-through rates (CTR) and bounce rates on landing pages.
- search volume and competition data, particularly for long-tail s.
- Seasonal trends and market fluctuations for industries like travel and retail.
Future Trends in Advertising Metrics
The landscape of advertising measurement is constantly evolving, driven by technological advancements and shifting consumer behaviors. Traditional metrics are becoming less relevant as advertisers seek more nuanced and actionable insights. This shift necessitates a proactive approach to understanding future trends in order to optimize campaigns effectively.The future of advertising measurement will be defined by a combination of sophisticated data analysis techniques and the integration of emerging technologies.
This will empower marketers to make data-driven decisions that are more accurate and responsive to real-time changes in the market.
Predicting Future Developments in Advertising Measurement
The rise of AI and machine learning is fundamentally altering how we approach campaign performance. Algorithms are now capable of analyzing vast datasets to identify patterns and insights that were previously impossible to discern. This sophisticated analysis enables more precise targeting and personalized messaging, ultimately leading to improved campaign effectiveness. Examples include AI-powered A/B testing tools that automatically identify the most successful ad creatives, and dynamic bidding strategies that adjust in real-time based on evolving market conditions.
Identifying Potential New Metrics and Their Impact on Campaign Optimization
Beyond traditional metrics like click-through rates (CTR) and conversion rates, future advertising measurement will likely incorporate more contextually relevant indicators. Metrics like engagement rate, dwell time, and brand lift will become increasingly important, providing a more holistic view of campaign performance. For example, measuring how long users spend interacting with an ad or engaging with a brand’s social media content can offer valuable insights into campaign effectiveness.
The Role of AI and Machine Learning in Shaping Future Metrics
AI and machine learning are crucial in shaping future metrics, as they allow for the automated collection, processing, and analysis of vast quantities of data. This automated process enables the development of real-time insights, enabling businesses to adapt to changes in consumer behavior more swiftly and accurately. Moreover, AI algorithms can identify previously unknown correlations and relationships within the data, leading to the discovery of entirely new metrics that enhance campaign optimization.
Impact of Emerging Technologies on Measuring Ad Performance
Emerging technologies like the metaverse and the increasing adoption of augmented reality (AR) are reshaping the way consumers interact with advertisements. This necessitates new metrics that can capture the impact of these experiences on brand perception and customer engagement. Understanding user behavior within these immersive environments is key to optimizing campaigns and maximizing their effectiveness.
Potential for New Data Sources to Enhance Campaign Evaluation
The availability of new data sources, including data from connected devices, social media interactions, and online behavioral data, will significantly enhance the evaluation of advertising campaigns. These data sources provide a richer and more comprehensive understanding of consumer behavior, enabling marketers to develop more personalized and effective campaigns. The ability to correlate these new data points with traditional metrics will help in understanding the overall impact of campaigns.
Concluding Remarks
In conclusion, the shift away from average position in Google Ads is a natural evolution driven by the need for more sophisticated metrics. This guide has equipped you with the knowledge to transition to alternative KPIs, optimizing your campaigns for maximum ROI. By understanding the strengths and weaknesses of each metric, and implementing the strategies Artikeld here, you can gain a clearer picture of your campaign’s performance.
The future of advertising measurement lies in embracing a combination of metrics that provide a holistic understanding of your campaign’s success. Start incorporating these alternatives today, and watch your Google Ads campaigns flourish.