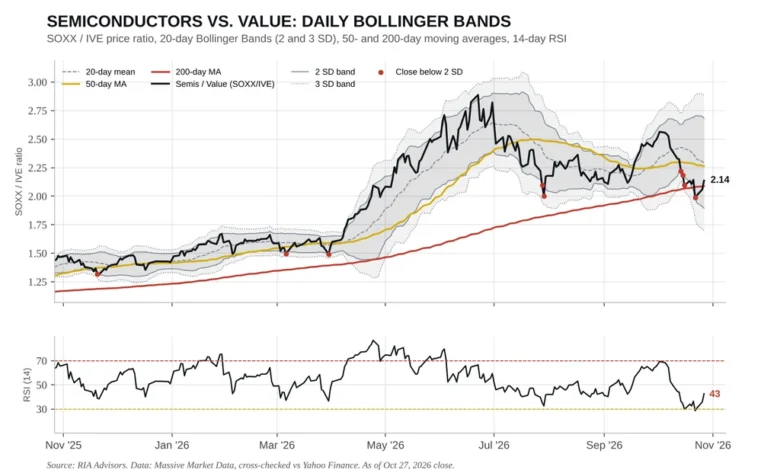
Financial markets often present a facade of calm stability while profound shifts occur underneath the surface. This paradox has defined the trajectory of the S&P 500 over a recent five-month period ending in late October 2026. While headline indices suggest a market moving sideways with a marginal gain of roughly 1%, a granular analysis reveals a much more volatile reality. Driven by aggressive sector rotations between growth and value assets, a stealth bear market has quietly impacted a significant portion of the index’s individual constituents, raising important questions about portfolio positioning, macroeconomic data, and potential Federal Reserve policy errors.
Understanding the Mechanics of the Stealth Bear Market
To the casual observer monitoring the S&P 500 on a daily basis, the index’s performance since June 1, 2026, appears remarkably unremarkable, hovering near a flat line with an approximate 1% increase. However, this headline stability masks a high-frequency churn driven by fierce rotations.

Market data from the period indicates that at some point during these five months, 182 S&P 500 stocks—accounting for 36% of the index—suffered declines of 20% or more from their 2026 highs. Compounding this undercurrent, another 108 companies had already plunged 20% from their respective peaks prior to June. In total, nearly 58% of the entire index experienced a peak-to-trough drop of at least 20% over the course of the year. In traditional financial terminology, a 20% decline defines a bear market. Consequently, the sheer breadth of these corrections indicates that a majority of the index’s underlying equities have endured a bear market, even as the capitalization-weighted headline index remained afloat.
This divergence is largely explained by the shifting dynamics between growth and value equities. The S&P 500 Growth ETF (IVW) dropped 2.6% over the five-month span, while the corresponding Value ETF (IVE) advanced 5.4%. These aggregate numbers only scratch the surface of the underlying volatility. The ratio of growth-to-value (IVW:IVE) experienced wild oscillations: it fell 11% into late July, rebounded sharply by 14% through early October, and subsequently gave back 9%. Each violent swing in this ratio punished one segment of the market while rewarding the other. These offsetting movements effectively balanced each other out, keeping the aggregate S&P 500 index deceptively flat.
Constructive Corrections Versus Systemic Risks
Market strategists and portfolio managers frequently debate whether such rolling corrections are healthy or harmful. On one hand, this continuous churning can act as a constructive pressure valve. By allowing individual stocks to unwind their valuation excesses sector by sector, the broader market reduces its vulnerability to a sudden, synchronized crash.
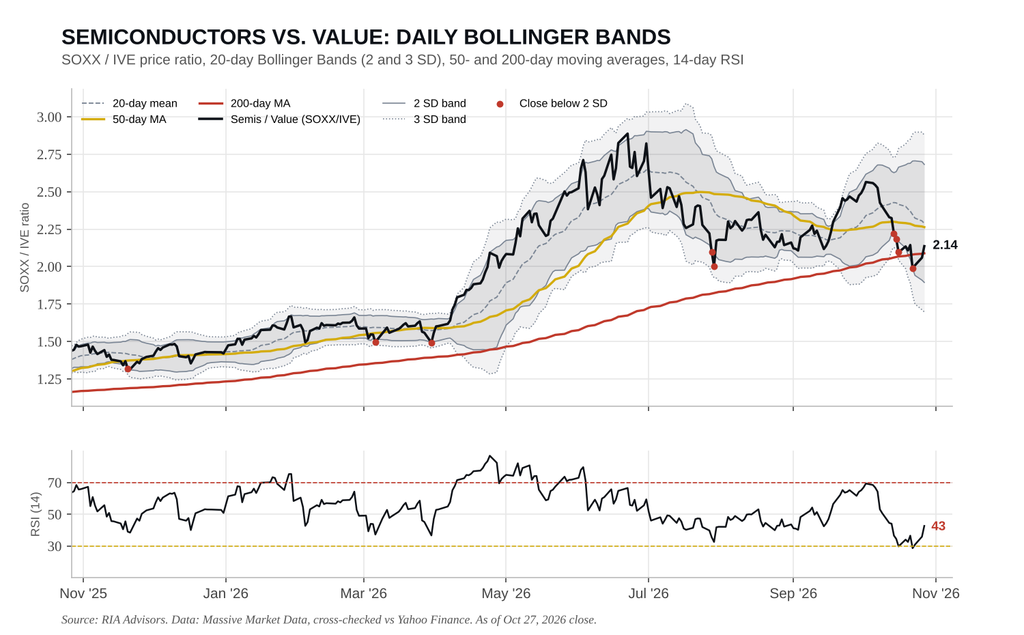
However, analysts caution that this high-intensity rotation does not render the S&P 500 immune to a broader systemic correction. For the headline index to break its sideways pattern and move lower, both growth and value assets would likely need to experience simultaneous downward pressure—a scenario that has thus far been prevented by capital rotating seamlessly between the two camps.
Sector Divergence: Tech Disruption and Value Resilience
The debate over market breadth has naturally filtered down to tactical asset allocation. Investors and institutional analysts assessing portfolio risk have grappled with whether to trim outperforming value holdings to capitalize on battered technology stocks.
By late October 2026, the S&P 500 Value ETF sat within a fraction of a percent of its 52-week high. Conversely, technology sub-sectors faced steep corrections. The iShares Semiconductor ETF (SOXX), for instance, closed at $511.06, sitting 22% below its June peak. Technical indicators during late October flashed oversold signals not seen since the tariff-related panic of April 2025, with relative strength indices and moving average ratios pointing toward extreme capital flight from specific tech segments.
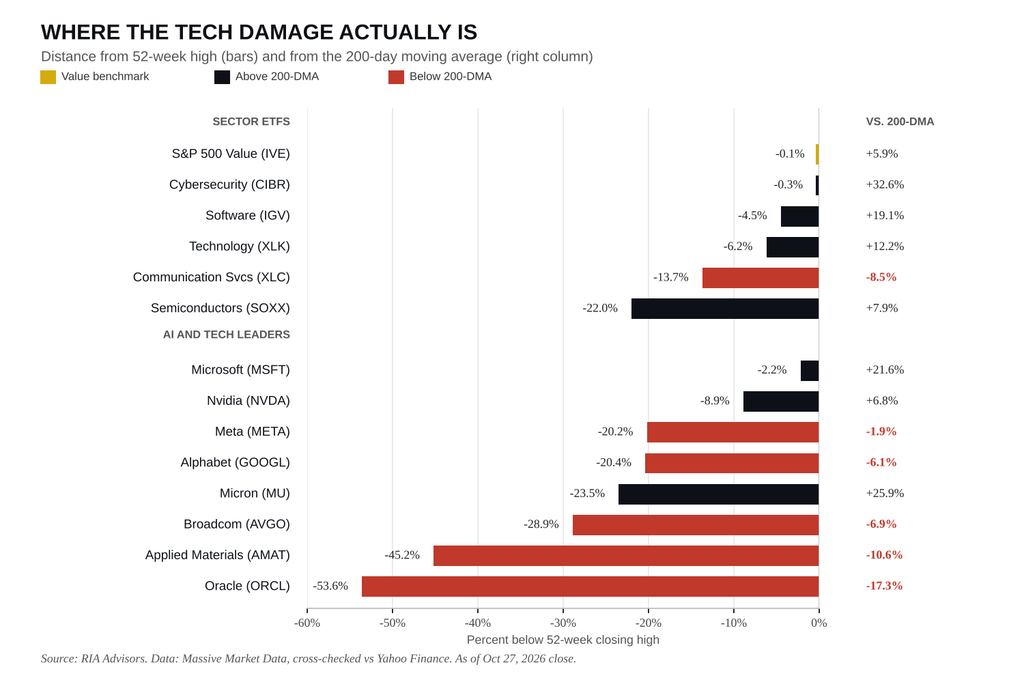
Yet, market participants emphasize that treating technology as a single monolithic block is a analytical error. While semiconductors, custom silicon manufacturers, and hardware platforms suffered immense damage—with companies like Applied Materials down 45% from their highs and Broadcom lower by 29%—other areas of technology proved resilient. Software and cybersecurity equities, tracked by indices such as IGV and CIBR, continued to trade near their all-time highs. This divergence occurred as hedge funds pared back exposure to cyclical tech components at the fastest pace seen in a decade, leaving retail investors and defensive allocators to absorb the shifting liquidity.
Economic Data Releases Shape the Macro Landscape
As market participants navigated these micro-level rotations, a heavy slate of macroeconomic data releases on Thursday, October 29, 2026, provided fresh insights into the health of the United States economy.
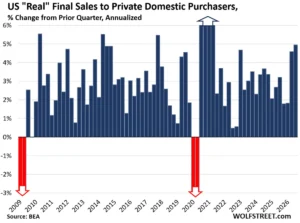
The Bureau of Economic Analysis released its advance estimate for third-quarter Gross Domestic Product (GDP) growth, alongside critical inflation indicators. The annualized Q3 GDP growth rate came in at an estimated 3.1%, closely matching consensus expectations of 3.2% and improving upon the prior quarter’s 2.2% reading. However, inflationary metrics remained closely watched. The GDP Price Index rose at an annualized rate of 3.6%, cooling from the prior quarter’s hot 6.1% print but highlighting persistent price pressures.

Simultaneously, the Personal Consumption Expenditures (PCE) price index—the Federal Reserve’s preferred inflation gauge—showed the headline PCE rising 3.6% year-over-year for September. The core PCE index, which strips out volatile food and energy costs, printed at a 3.1% annual rate, matching consensus forecasts. Additional reports released concurrently showed personal income increasing by 0.3% in September, while personal spending rose by a more modest 0.3%, signaling a slight cooling in consumer demand relative to previous months. Initial jobless claims for the week ending October 24 registered at 196,000, underscoring a persistently tight labor market.
Federal Reserve Policy and the Energy Price Dilemma
The intersection of sticky inflation data and corporate earnings reports has renewed scrutiny surrounding Federal Reserve monetary policy. Financial analysts have increasingly questioned whether the central bank risks engineering a policy error by aggressively tightening monetary conditions in response to inflation driven primarily by supply-side commodity shocks rather than domestic demand overheating.
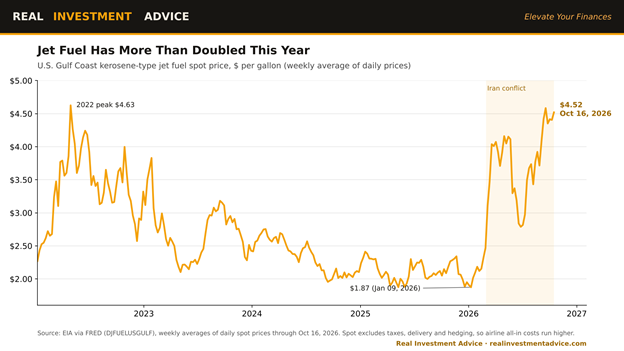
Corporate disclosures have provided real-world illustrations of these inflation transmission mechanisms. During its corporate earnings presentation, United Airlines reported a dramatic 62% surge in fuel expenses compared to the previous year, with the average price paid for jet fuel climbing to $3.90 per gallon. Crucially, United’s executive leadership noted that the company would not be able to recapture 100% of these soaring fuel costs through ticket pricing alone in the fourth quarter.

While airlines and transportation firms absorb portions of these costs, a significant share is inevitably passed along to consumers through higher fares, feeding directly into broader transportation and service inflation metrics. Market critics argue that if the Federal Reserve interprets cost-push inflation—fueled by elevated global energy prices—as a sign of excessive domestic demand requiring higher interest rates, the central bank risks tightening financial conditions into an already slowing industrial sector, potentially aggravating the rolling corrections observed across equity markets.
Fixed Income Dynamics: The 20-Year Treasury Yield Anomaly
Beyond the equity markets, fixed-income investors have focused heavily on shifting yield curve dynamics. A recurring point of discussion among institutional and retail investors has been the relative attractiveness of long-duration sovereign debt, particularly the 20-year United States Treasury bond.
During late October 2026, the yield on the 20-year Treasury bond stood at 5.343%, notably higher than the 30-year bond yield at 5.280% and the 10-year Treasury yield at 4.995%. This unusual "hump" in the middle of the long end of the yield curve has prompted queries regarding why investors would bypass shorter or longer durations in favor of the 20-year issue.
Financial experts clarify that this yield premium is not a reflection of heightened credit risk, as all standard United States Treasury securities share identical sovereign backing. Instead, the discrepancy is driven entirely by structural liquidity and demand dynamics. Institutional buyers such as pension funds and life insurance companies typically target 30-year bonds to match ultra-long-term liabilities extending beyond three decades. Furthermore, the 30-year bond commands deep liquidity due to continuous, massive trading volumes across global markets.
By contrast, the 20-year Treasury lacks a comparable natural buyer base. Although the United States Department of the Treasury halted issuance of the 20-year bond in 1986 before reviving it in May 2020, auction sizes remain considerably smaller than those of benchmark 10-year and 30-year offerings. Consequently, the extra yield offered by the 20-year security functions as a liquidity risk premium, compensating investors for holding an asset that may be marginally less liquid during periods of market stress.
Outlook and Strategic Implications
As corporations continue to release third-quarter financial results—including tech giants such as Amazon, Intel, and major healthcare and industrial firms—market participants are forced to balance headline stability against internal sector turbulence.

While the S&P 500 index continues to project an image of calm endurance, the underlying asset rotations demonstrate that a stealth bear market has quietly reshaped portfolios throughout 2026. Whether investors choose to rebalance out of extended value plays into oversold technology equities, or navigate the complex signals emerging from Federal Reserve policy and macroeconomic indicators, risk management and disciplined execution remain paramount in an environment where average index performance conceals extraordinary underlying volatility.
Related posts: