Retrospective Simulation: Mitigating Overfitting Risks in Financial Trading Strategies Through Probabilistic Path Analysis

In the pursuit of alpha, quantitative traders and portfolio managers often fall prey to the "flaw of averages" and the dangers of curve-fitting. A common pitfall in algorithmic development is the reliance on a single historical price trajectory to optimize strategy parameters. This approach, often described as being "fooled by randomness," assumes that the realized path of an asset is the only one that could have occurred. To counter this, a robust methodology known as retrospective simulation—utilizing non-parametric Brownian bridge techniques—offers a way to stress-test trading strategies against thousands of plausible, alternate market realities.
The Problem of Path Dependency
Financial markets are stochastic by nature. While a historical backtest provides a clear view of how a strategy performed between 2000 and 2020, that performance is inextricably linked to the specific, singular sequence of geopolitical events, macroeconomic shifts, and liquidity shocks that occurred during that period. By relying on this "realized" data alone, developers risk creating models that are perfectly calibrated for a ghost of the past but entirely unprepared for the variations of the future.
The retrospective simulation framework addresses this by treating the historical path as just one of many potential outcomes. By anchoring the start and end dates of a dataset and simulating the "meandering" in-between prices using a Brownian bridge—modified with non-parametric bootstrapping—researchers can generate a spectrum of scenarios. This process does not rely on the assumption of a Gaussian distribution, which often fails to capture the "fat-tail" events or market crashes that define real-world financial risk.
Chronology of Data and Simulation Methodology
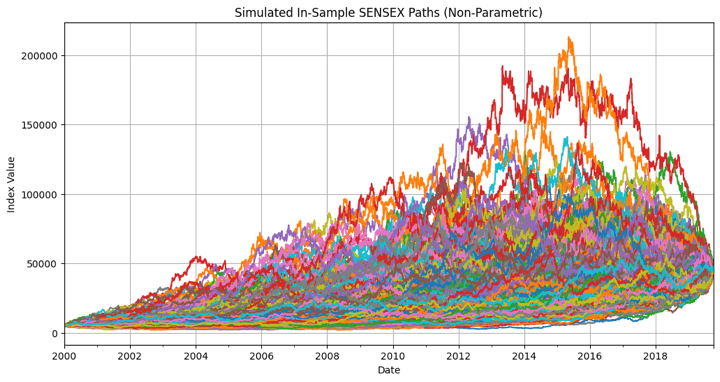
To examine this, an analysis of the SENSEX index (the benchmark index of the Bombay Stock Exchange) was conducted using data from January 2000 to November 2020 as the in-sample training period, followed by an out-of-sample testing period from December 2020 to April 2025.
The simulation engine generated 1,000 alternate price paths for the in-sample period. Unlike standard Monte Carlo simulations that might ignore the terminal value, this Brownian bridge approach ensures all simulated paths converge at the actual observed closing price of November 2020. This constraint is predicated on the Efficient Market Hypothesis, suggesting that regardless of the path taken, market forces would eventually arrive at a similar valuation by a specific point in time. By using bootstrapping with replacement on realized returns, the model retains the authentic "character" of market volatility, including its kurtosis and skewness, rather than imposing artificial statistical constraints.
Performance Analysis: In-Sample vs. Out-of-Sample
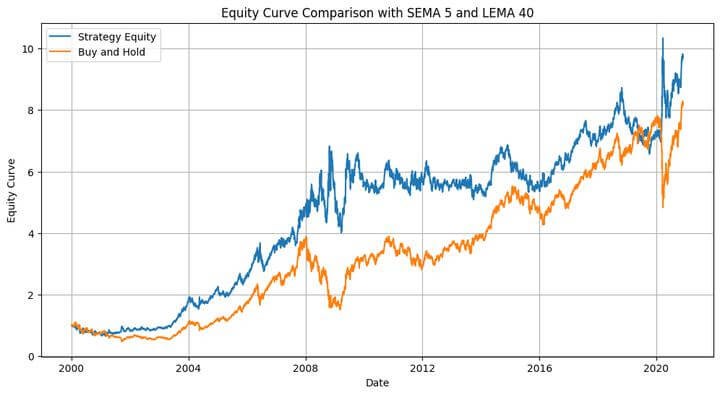
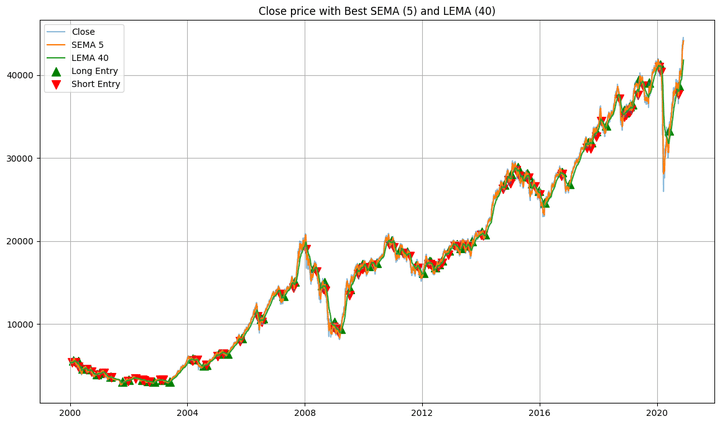
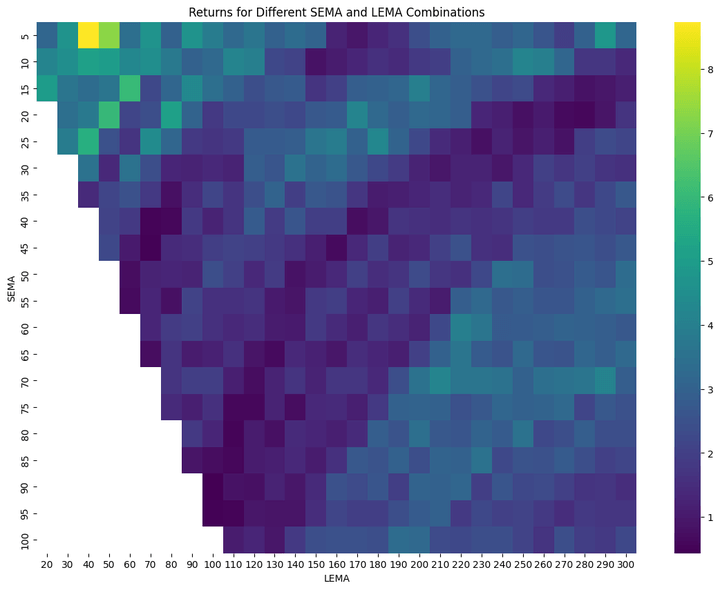
The strategy selected for this validation was a standard Exponential Moving Average (EMA) crossover. In the in-sample testing phase, the strategy was optimized by iterating through various short-period (SEMA) and long-period (LEMA) combinations. The results were impressive: the optimized parameters (SEMA 5, LEMA 40) yielded a total return of 873.43% with a Sharpe ratio of 0.59.
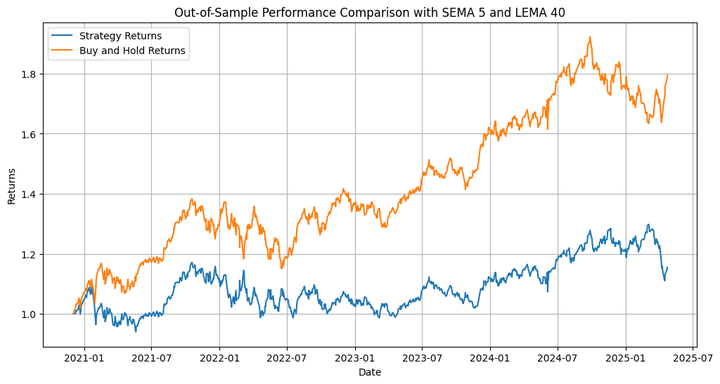
However, when these "optimal" parameters were applied to the out-of-sample data (2020–2025), the strategy failed significantly, producing a total return of 15.46%, vastly underperforming the buy-and-hold benchmark return of 79.41%. This divergence is a classic indicator of overfitting. The model had effectively "memorized" the in-sample noise rather than capturing a genuine predictive signal.
Expanding the Horizon with Multi-Path Optimization
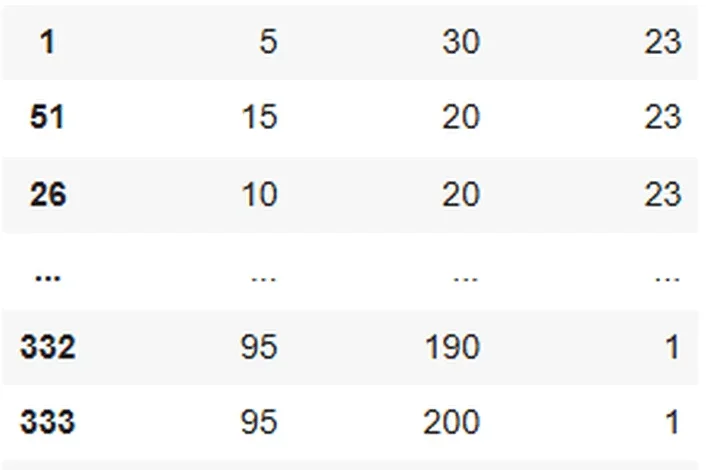
The primary innovation of the retrospective approach is the move away from optimizing for one path. By running the backtest across all 1,000 simulated paths, one can identify which parameter combinations are the most resilient. In this study, the SEMA 5 and LEMA 20 combination emerged as the most frequently successful configuration across the simulated landscape.
When this "path-resilient" parameter set was applied to the out-of-sample data, it still resulted in a negative return of -7.73%. While this outcome remains suboptimal, it provides a crucial reality check for the developer. It demonstrates that the strategy is not inherently robust, regardless of the optimization method used. Identifying this failure before deploying capital is the primary value proposition of the retrospective simulation framework.
Quantifying Risk: VaR and CVaR
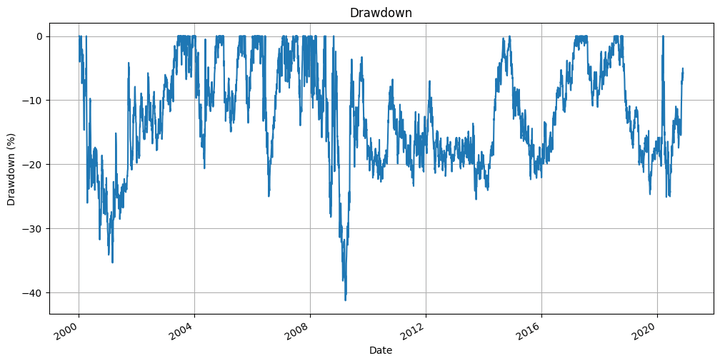
Beyond strategy performance, the framework provides a deeper understanding of risk through Value at Risk (VaR) and Conditional Value at Risk (CVaR). By aggregating over 5 million daily return points generated across the 1,000 simulated paths, the study revealed significant insights into the index’s tail risk.
The analysis found that at a 99% confidence level, the expected shortfall (CVaR) was -5.86%. This means that in the worst 1% of scenarios, losses significantly exceeded the -4.25% VaR threshold. The distribution of these simulated returns exhibited high kurtosis (9.59), confirming that extreme market events—the "black swans"—are far more frequent in reality than traditional normal distribution models would suggest.
Implications for Institutional Quantitative Research
The retrospective simulation model shifts the paradigm of backtesting from "what happened" to "what could have happened." For institutional quantitative research, this methodology has several practical implications:
- Robustness Testing: It forces a strategy to prove its efficacy across a wide range of market conditions, rather than a single historical sequence.
- Dynamic Risk Assessment: By calculating VaR and CVaR through simulation, firms can better estimate capital requirements for extreme volatility events.
- Overcoming Data Scarcity: In emerging markets or for new financial instruments where historical data is limited, generating synthetic but grounded paths can provide the necessary volume of data for machine learning models to train effectively.
- Strategy Validation: It serves as a filter. If a strategy consistently fails across 1,000 simulated paths, it is likely that the underlying logic is flawed, saving the firm from unnecessary live-market exposure.
Limitations and Future Directions
While the retrospective simulation approach provides a more realistic stress-test, it is not without limitations. The Brownian bridge, while effective, assumes that macroeconomic variables remain relatively stable or that their impact is captured within the historical returns used for bootstrapping. In reality, structural breaks—such as the COVID-19 pandemic or geopolitical conflicts—often change the fundamental distribution of returns in ways that simple bootstrapping might not fully capture.
Future iterations of this framework could incorporate "regime-switching" models, where simulated paths are subjected to different market conditions (e.g., high volatility, low liquidity) to further challenge the strategy. Additionally, scaling these simulations for complex machine learning models remains a computational challenge, often requiring high-performance computing clusters or GPU acceleration to process thousands of iterations within a reasonable timeframe.
Conclusion
The quest to eliminate the influence of chance in trading remains the "Holy Grail" of quantitative finance. While no simulation can perfectly predict the future, the retrospective simulation framework significantly narrows the gap between idealized backtesting and the chaotic reality of market movements. By embracing the uncertainty of historical paths, traders can move beyond the comfort of overfitted models and toward strategies that are statistically grounded, risk-aware, and built to survive the unpredictable nature of global markets. As evidenced by the results of this study, the most important function of a backtest is not to confirm that a strategy works, but to rigorously test under what conditions it fails.