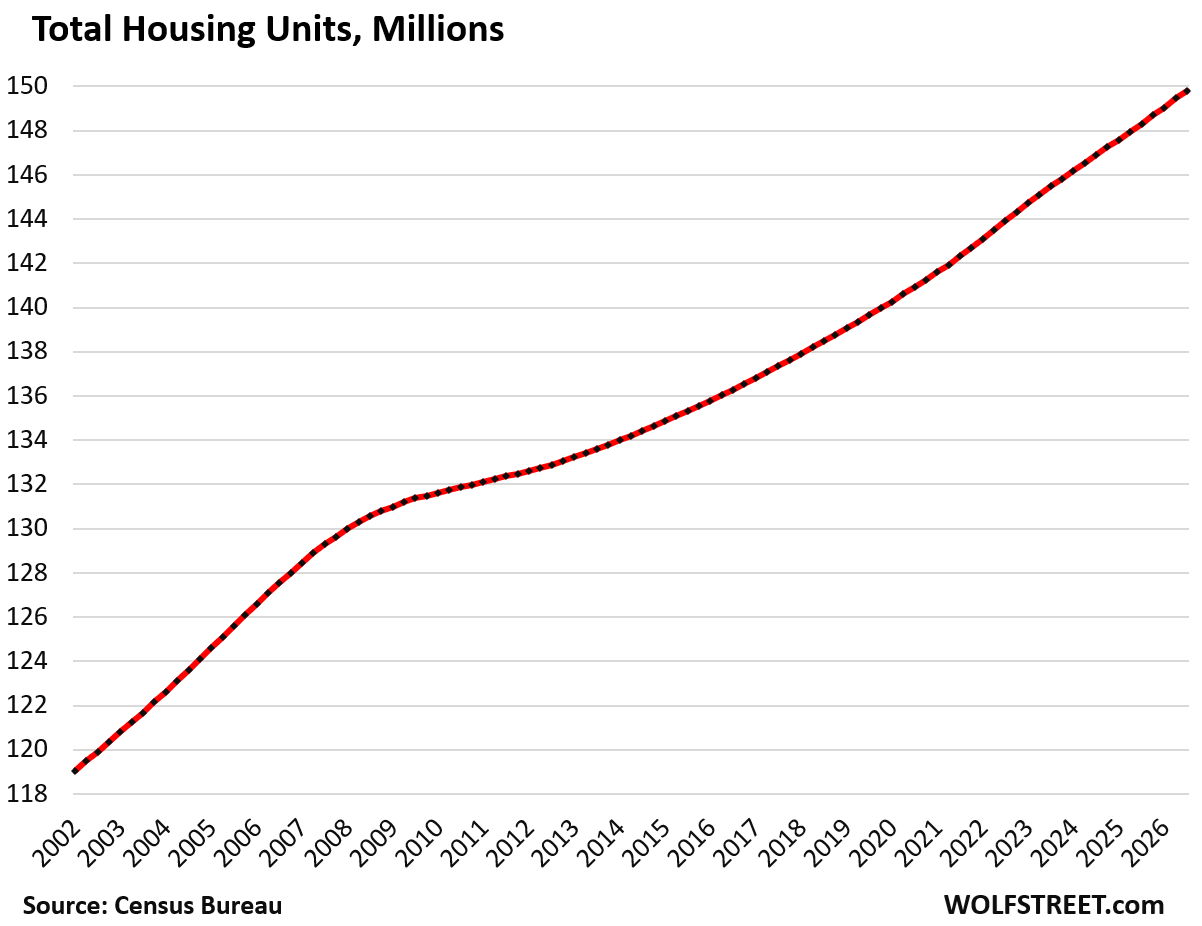
The United States housing market is undergoing a significant structural shift as the national inventory of housing units continues to expand at a rate that is rapidly outpacing the current growth in population. According to the latest data released by the U.S. Census Bureau, the total domestic housing stock increased by 358,000 units during the third quarter of 2026 alone. When looking at the broader picture, the past four quarters have seen a net addition of 1.512 million units, bringing the total national count to 149.8 million homes. This figure represents the net growth calculated after accounting for new construction completions and deducting units lost to demolition or other permanent removals.
The Divergence Between Housing Growth and Population Trends
This net increase in housing stock provides theoretical capacity for an additional 3.78 million residents, based on the national average household size of approximately 2.5 people. However, this robust supply-side expansion arrives at a time when the demographic demand side of the equation has cooled significantly. Federal data indicates that the pace of population growth has slowed to a crawl, influenced by more stringent immigration enforcement and a recalibration of legal migration policies. Estimates from earlier this year show the national population grew by only 757,000 people over the 12-month period ending in July 2026.
The resulting mismatch—where housing units are being added at a rate far exceeding the rate of new household formation—has led to a noticeable "ballooning" of the vacant housing stock. When housing supply significantly exceeds the absorption capacity of the population, the market inevitably faces pressure on occupancy rates and pricing.
Understanding the Vacant Housing Stock
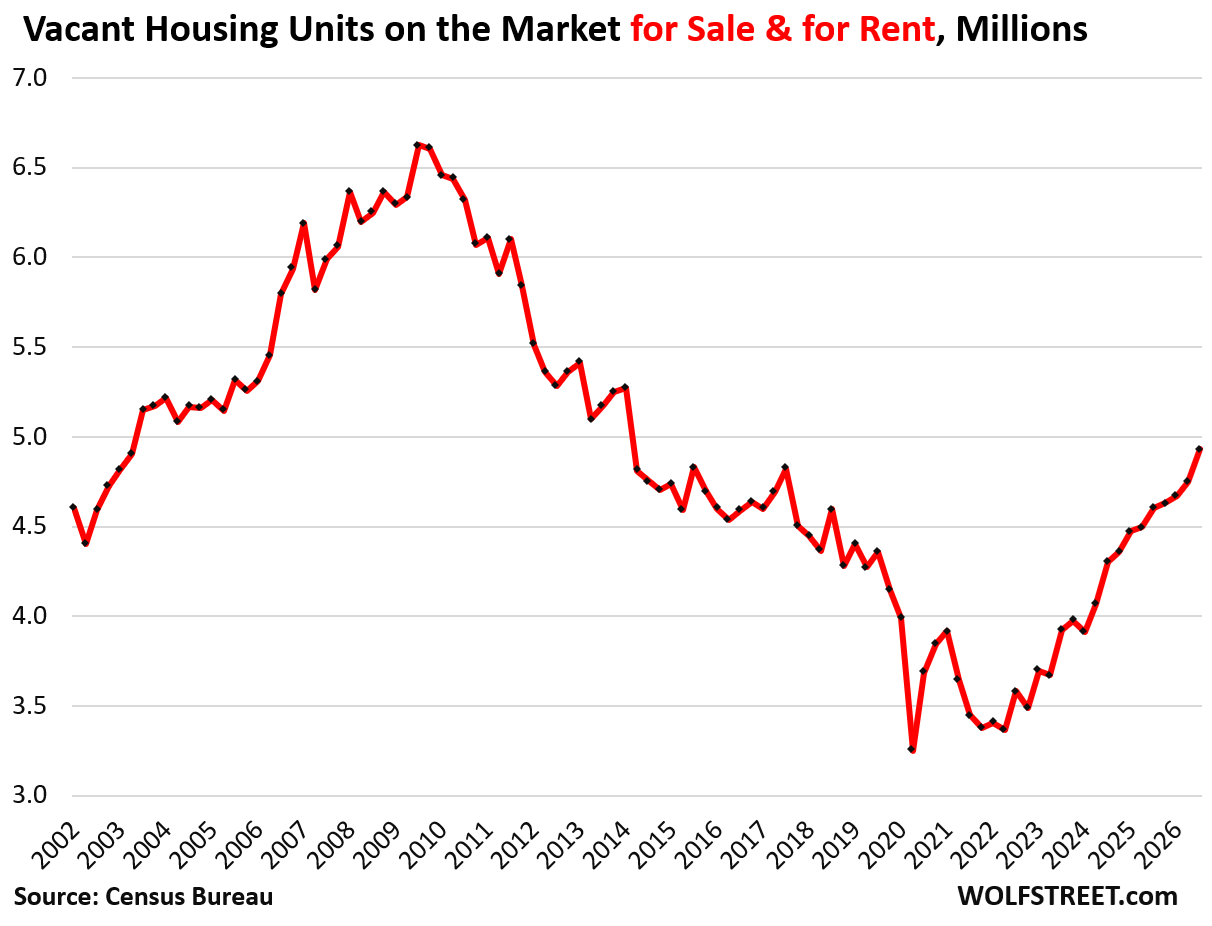
As of the third quarter of 2026, there were 15.81 million vacant housing units across the United States, an increase of 169,000 units from the previous quarter and a year-over-year jump of 591,000 units. To analyze this data accurately, it is essential to distinguish between different types of vacancy. Of that total, 12.34 million units are classified as "year-round vacant," representing 8.2% of the entire national housing inventory.
It is a common misconception that "year-round vacant" implies a property has sat empty for an entire calendar year. In census terminology, this category includes any unit intended for occupancy at any time, distinguishing them from "seasonal vacant" units, of which there are 3.47 million, specifically designed for intermittent or vacation-style living. The year-round category is the primary indicator of the health of the active housing market, and its growth by 1.0% quarter-over-quarter and 3.9% year-over-year suggests that a greater proportion of the national housing stock is failing to find occupants.

The Rise of Market-Available Inventory
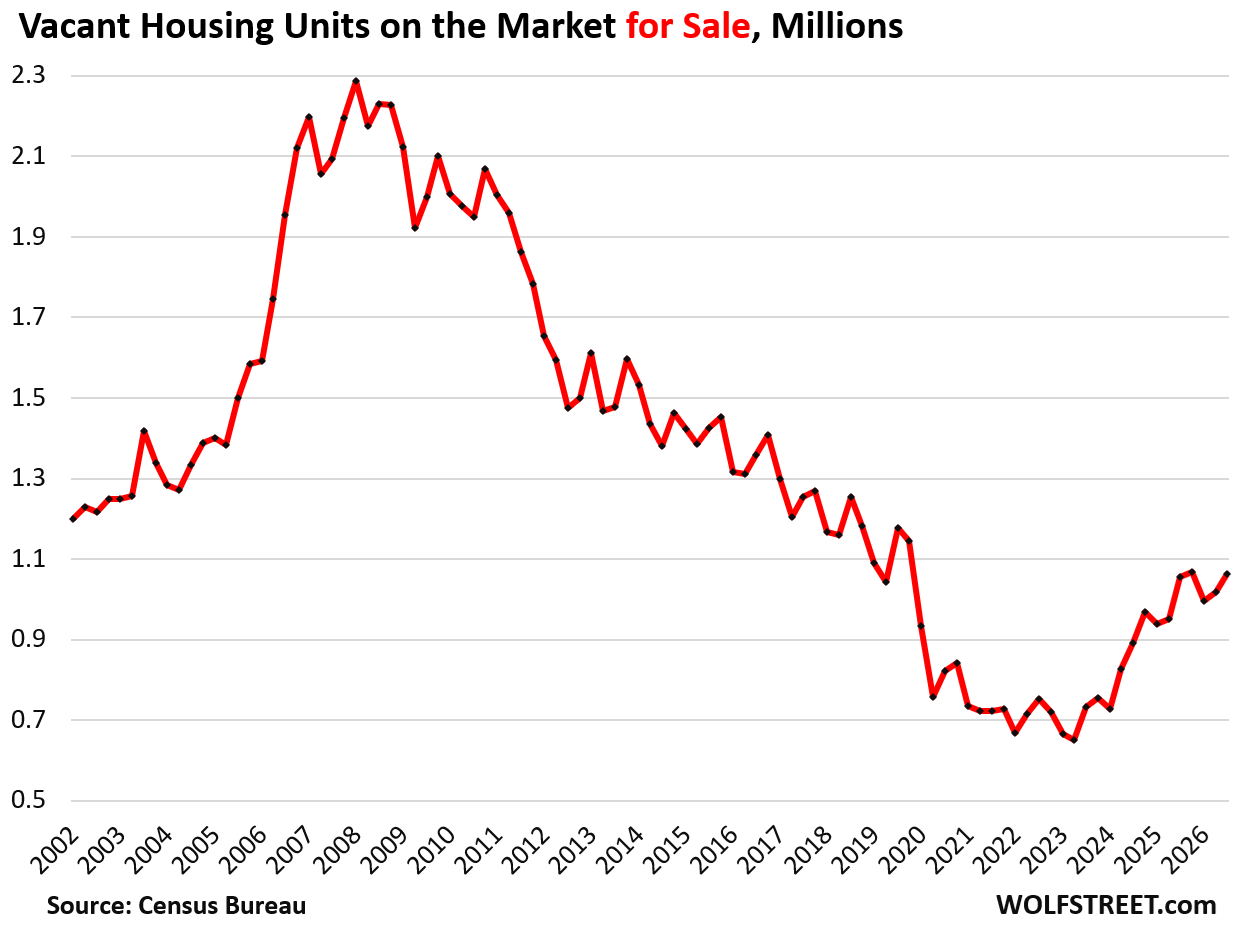
The most critical sub-segment within the year-round vacancy data is the count of units explicitly listed for sale or for rent. This metric has surged by 7.1% year-over-year to reach 4.93 million units. This is the highest level of market-available vacancy observed since 2013, a year that marked the final stages of the post-2008 housing crisis recovery. Over the last five years, the supply of vacant units for sale or rent has ballooned by approximately 1.48 million, highlighting a fundamental change in the liquidity of the residential real estate market.
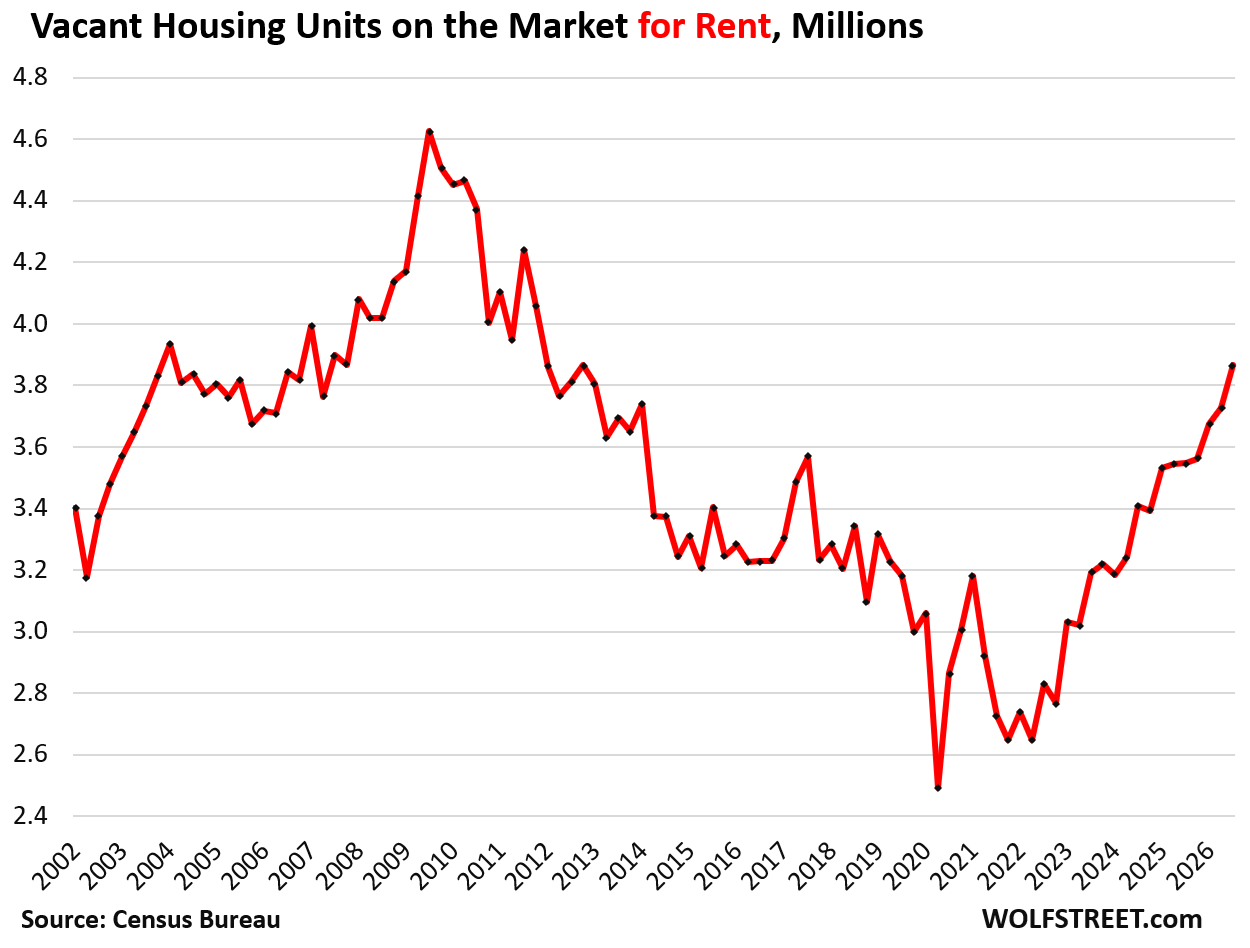
This increase is largely driven by a combination of high interest rates, elevated home prices, and a shifting strategy among property owners. Many homeowners who find themselves unable to secure a buyer at their desired price point are choosing to transition their properties into the rental market. This phenomenon creates a class of "accidental landlords" who are attempting to offset carrying costs by securing tenants. However, the data suggests that these efforts are meeting resistance; the number of vacant units listed for rent has spiked to 3.87 million, the highest level since 2011. This trend indicates that in many regions, the asking rents remain misaligned with the purchasing power of prospective tenants.
Market Dynamics: The "Accidental Landlord" and Shadow Inventory
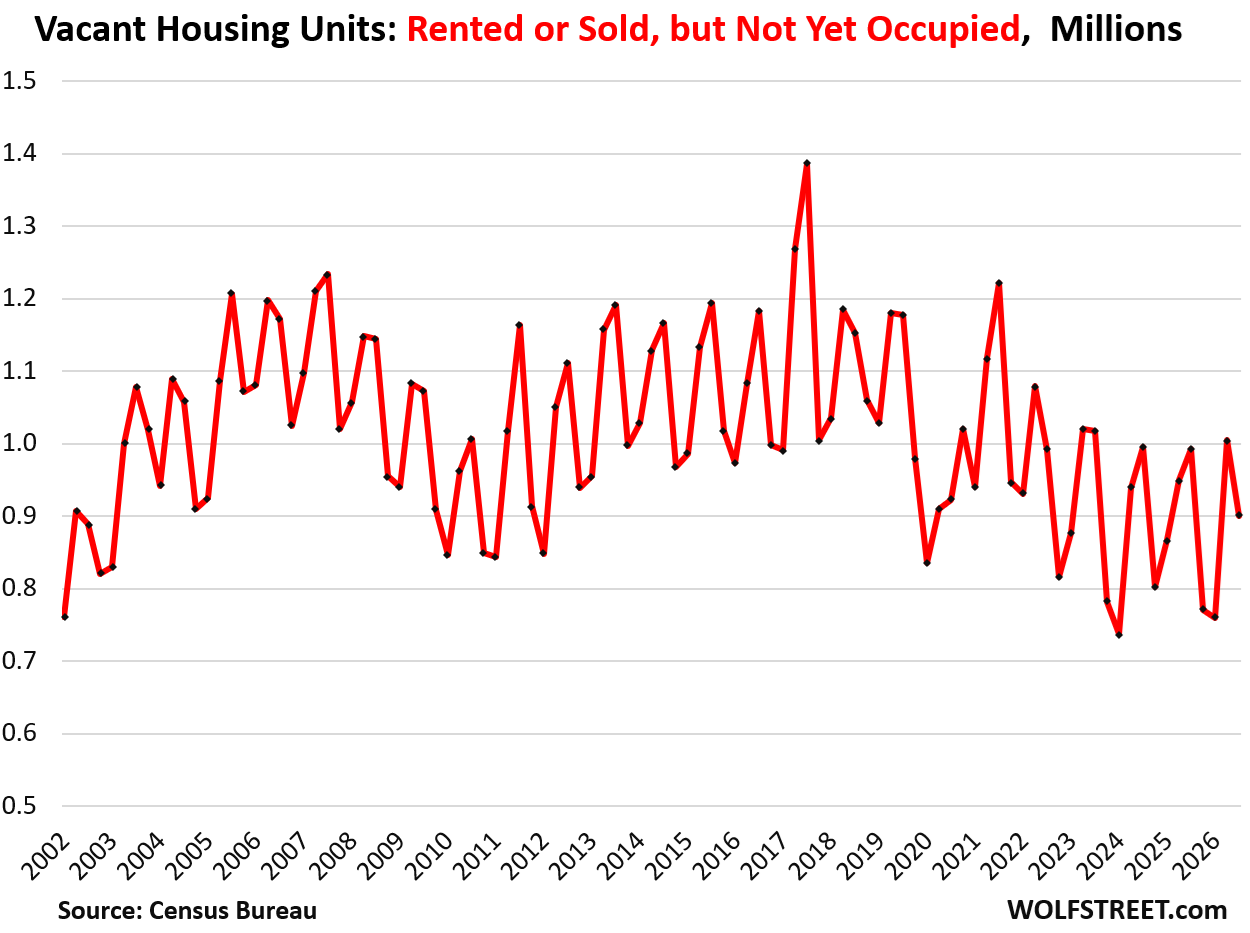
The struggle to achieve market equilibrium is further reflected in the "held off the market" category. Of the 12.84 million year-round vacant units, 6.51 million are not currently listed for sale or rent. These units are held off the market for various reasons, including legal disputes, ongoing renovations, or owners choosing to wait for more favorable economic conditions.
While the "shadow inventory"—the pool of potential supply waiting to enter the market—has generally decreased over the past five years as property owners attempted to capitalize on rising home values, the third quarter of 2026 saw a reversal. This segment grew by 43,000 units in the quarter and by 227,000 units over the past year. The expansion of this shadow inventory suggests that a growing number of owners are opting to remove their properties from the active market entirely rather than lower their prices or rents to meet current demand.
Economic Implications and Future Outlook
The implications of these trends for the broader economy are multifaceted. Historically, high vacancy rates in the for-sale and for-rent sectors serve as a leading indicator of price corrections. When inventory levels rise while population growth remains sluggish, the pricing power of sellers and landlords inevitably weakens.
Economists point to several factors driving this current divergence:
- Price Rigidity: Many sellers remain anchored to the price expectations formed during the period of rapid appreciation, leading to a stalemate between buyers and sellers.
- Investment Shifts: Large institutional investors, who were major drivers of the residential market in previous years, have begun to pull back and, in some cases, act as net sellers. While smaller investors continue to acquire properties, the overall momentum of institutional capital has decelerated.
- Rent Normalization: In various metropolitan areas, the rapid rent growth observed in the early 2020s is facing downward pressure as the supply of vacant rental units increases, creating a more competitive environment for landlords.
The current housing cycle appears to be entering a phase of correction. The "housing shortage" narrative, which dominated market discourse for several years, is being challenged by the reality of rising inventories in specific sectors. As new construction continues to deliver units to the market, the interplay between the total supply of housing and the actual rate of household formation will likely dictate the path of home values and rental costs through the remainder of 2026 and into 2027.
While the housing market remains resilient in many respects, the statistical evidence of rising vacancy rates suggests that the era of chronic under-supply is giving way to a more complex environment defined by over-supply in specific, high-priced tiers. Whether this leads to a soft landing or a more pronounced adjustment in prices remains a subject of intense debate among housing analysts, but the census data provides a clear picture of a market currently struggling to absorb the sheer volume of available residential inventory.