Unlocking Market Regimes: How Gamma Exposure GEX Signals Shape Modern Algorithmic Trading Strategies

The modern financial marketplace operates on an intricate web of derivative hedging, liquidity provisions, and institutional positioning. Among the myriad quantitative indicators utilized by systematic traders, Gamma Exposure (GEX) has emerged as one of the most powerful regime-defining metrics in contemporary finance. Originally popularized by boutique research firm SqueezeMetrics, GEX provides a dollar-denominated estimate of the capital options dealers—frequently referred to as market makers—must deploy in the underlying stock or futures markets to maintain delta-neutral portfolios. As retail and institutional participation in options has ballooned over the past two decades, understanding the mechanical feedback loops driven by dealer gamma has shifted from an academic curiosity to an essential component of professional alpha generation.
To comprehend the mechanics of GEX, one must first examine the structural role of market makers. When everyday investors and large institutional funds purchase options contracts, they are typically buying them from major financial intermediaries and market-making desks. Because these institutions operate under strict risk-management mandates, they systematically hedge their directional exposure—measured by delta—continuously throughout the trading session. The rate of change in an option’s delta relative to the underlying asset’s price movement is known as gamma. Consequently, the aggregate gamma of all open option contracts, weighted by open interest and mapped across various strike prices and expiration dates, dictates how aggressively dealers must buy or sell the underlying asset as market prices fluctuate.
The implications of this continuous hedging create distinct structural environments known in quantitative trading as market regimes. These regimes are generally bifurcated into positive gamma and negative gamma environments, each eliciting vastly different behavioral characteristics from the broader index.
Positive Gamma Regimes and Volatility Dampening
When the aggregate GEX across the market sits comfortably in positive territory, option dealers are net long gamma. This positioning enforces a stabilizing, mean-reverting feedback loop on the underlying index. As the market price rises, long gamma positions force dealers to systematically sell the underlying asset to reduce their delta exposure. Conversely, when prices decline, dealers are compelled to step in and buy the underlying asset to maintain neutrality.
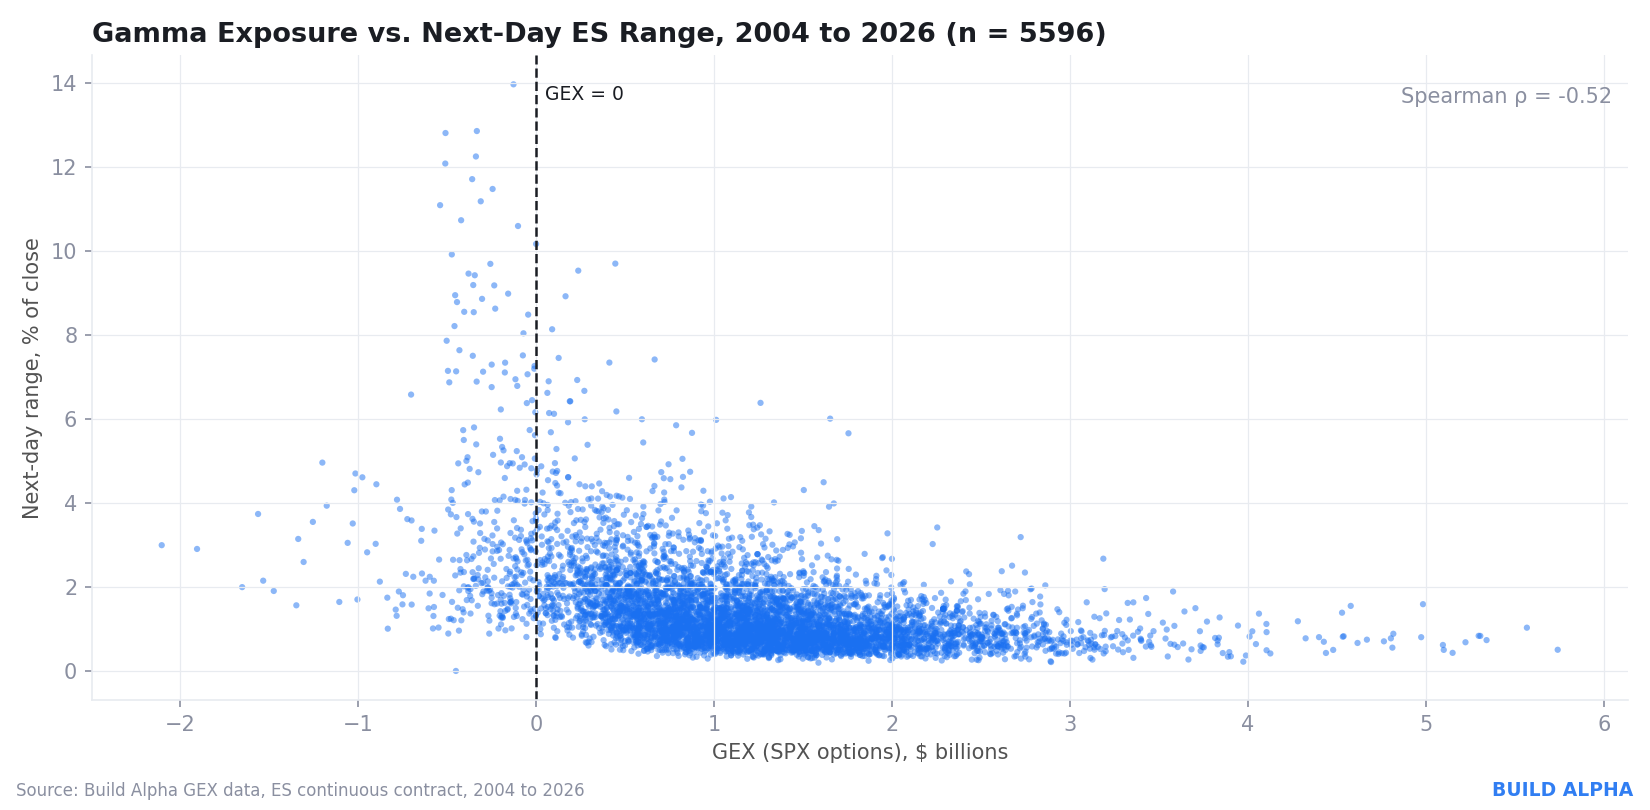
This counter-cyclical hedging activity effectively dampens intraday price movements, compresses trading ranges, and forces asset prices to pin near heavy strike concentrations. Historically, quantitative backtests on S&P 500 futures (ES) demonstrate that realized volatility reaches its cyclical nadir during periods of high positive GEX. For systematic traders, positive gamma environments are exceptionally well-suited for mean-reversion strategies, range-bound fading tactics, and options premium-selling frameworks.
Negative Gamma Regimes and Volatility Expansion
Conversely, when aggregate GEX falls below zero, option dealers find themselves net short gamma. This dynamic flips the mechanical hedging obligations of market makers, turning them into trend-amplifying participants rather than volatility stabilizers. In a negative gamma environment, if the market begins to rally, dealers must buy the underlying asset to stay hedged, pushing prices higher. If the market sells off, dealers must sell into the decline, exacerbating downward momentum.
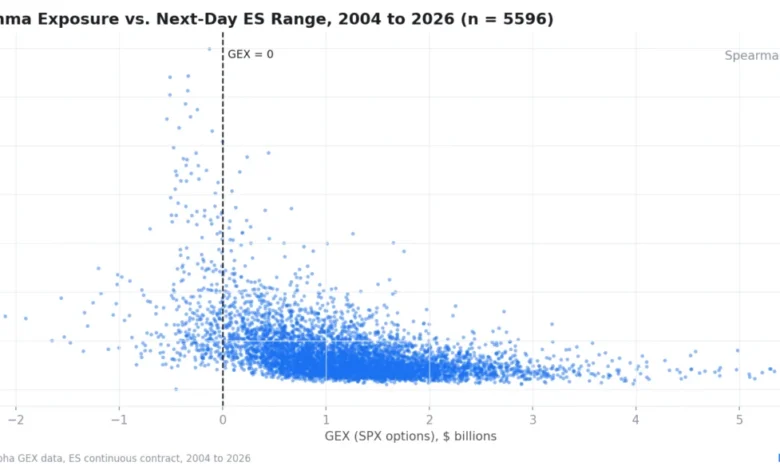
Empirical market data reveals that the largest intraday price drops and explosive trend days overwhelmingly cluster in negative-gamma conditions. During these sessions, realized volatility spikes, trends extend rapidly, and traditional mean-reversion models often fail. Systematic trading operations leverage negative GEX readings as a trigger to transition from fade strategies to breakout entries, adopting wider stop-losses and expanded profit targets to capture outsized directional moves.
Empirical Validation Across Two Decades of Market Data
To evaluate the long-term viability of GEX as a predictive regime indicator, quantitative researchers have analyzed extensive historical datasets spanning from January 2004 through September 2026. Encompassing more than 5,500 trading sessions, backtesting of daily GEX and GEX500 readings against subsequent session ranges on the S&P 500 E-mini futures contract yields striking results.
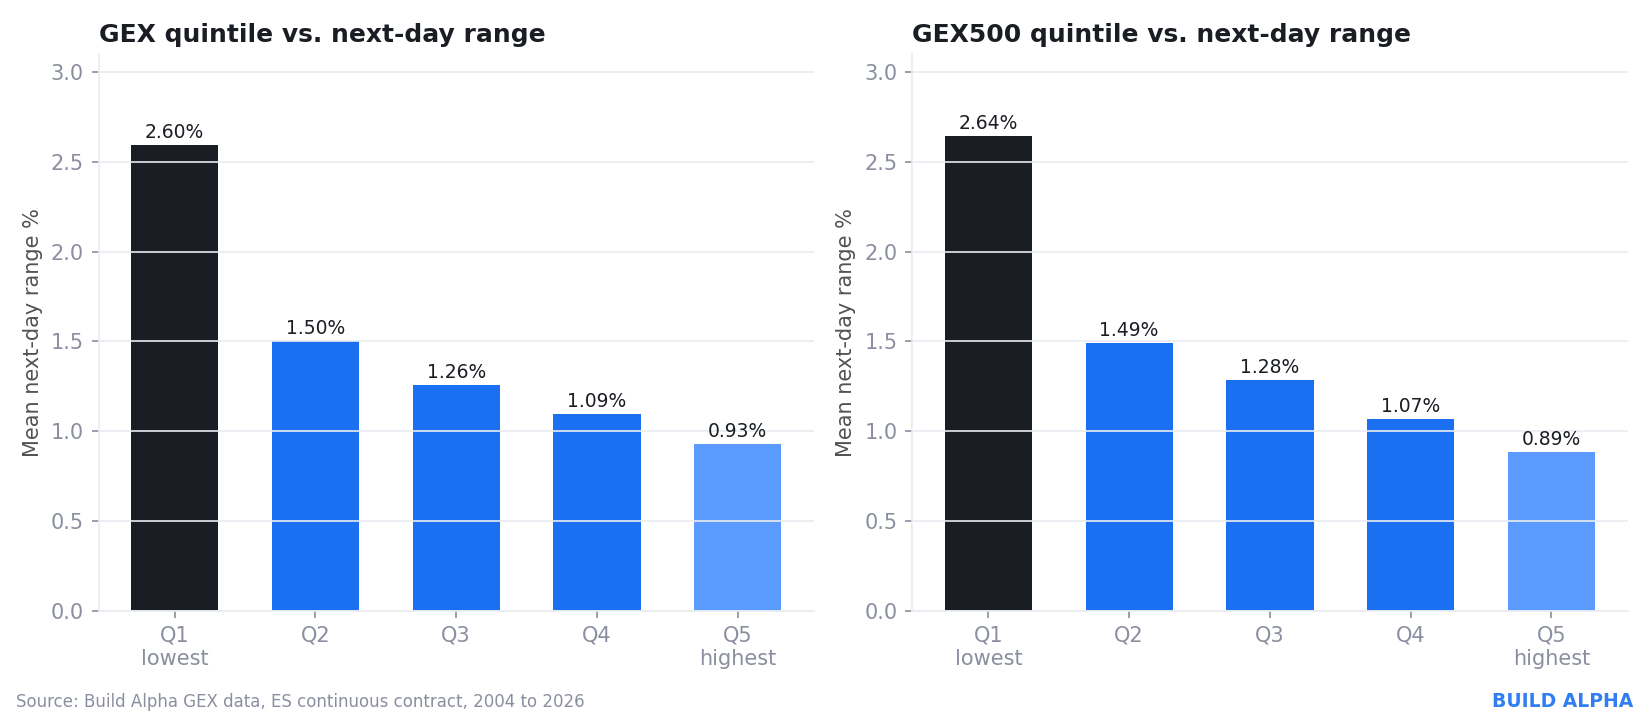
When historical trading sessions are sorted into GEX quintiles, a pronounced monotonic relationship emerges. The lowest GEX quintile (Q1), representing the most negative or compressed gamma conditions, exhibits a mean next-day trading range nearly three times larger than that of the highest GEX quintile (Q5). Specifically, sessions landing in the lowest GEX bucket averaged a next-day range of 2.60%, compared to just 0.93% for sessions in the highest quintile. Furthermore, sessions with strictly negative GEX values recorded an average next-day range of 3.6%, highlighting the extreme volatility expansion associated with short dealer gamma.
Critics often argue that such indicators might simply be proxies for standard, recent realized volatility—essentially measuring the echo of a wild market day. However, controlled testing isolating next-day ranges against the prior 20-day Average True Range (ATR) confirms that GEX carries independent informational value. Even when normalized against recent volatility clusters, the lowest GEX quintile consistently out-ranges the highest quintile by approximately 30%. This confirms that GEX captures unique positioning data regarding dealer risk exposure that traditional price-based volatility indicators miss.
Evolution of GEX Data and Custom Signal Architectures
As options volume has expanded exponentially over the years, raw dollar-denominated GEX values have naturally drifted higher. A gamma exposure figure considered exceptionally low or high in 2015 may appear entirely pedestrian in the modern trading landscape. To ensure signals remain robust across changing market eras, quantitative platforms normalize raw GEX data utilizing statistical transformations similar to the Commitments of Traders (COT) Index.
Modern algorithmic platforms incorporate advanced normalization techniques, including rolling 252-period percentile rankings and Z-score calculations. By evaluating where today’s GEX reading sits relative to a full year of historical data, or measuring how many standard deviations it deviates from its rolling mean, traders can accurately identify statistically rare positioning extremes regardless of absolute dollar growth.
Furthermore, quantitative frameworks frequently analyze dual series: GEX derived strictly from S&P 500 index options (SPX), and GEX500, which aggregates gamma exposure across the option chains of all individual S&P 500 component stocks. Because index options and single-stock options are often traded by distinct participant pools for disparate motivations, the spread between GEX and GEX500 serves as a critical barometer of market breadth. When both metrics align, dealer positioning is uniformly distributed across the capitalization spectrum; when they diverge, the resulting spread offers deep insights into underlying structural stress or sector-specific positioning anomalies.
Integration into Systematic Trading Models
Rather than serving as a standalone directional trigger, advanced quantitative practitioners utilize GEX primarily as a contextual regime filter. By embedding GEX conditions into algorithmic strategy design—such as forcing breakout logic to execute exclusively during negative gamma regimes, or restricting fade strategies to high positive gamma environments—systematic traders significantly enhance the win-rate and risk-adjusted return profiles of their models.
Ultimately, gamma exposure bridges the gap between derivative market mechanics and underlying equity price action. As quantitative finance continues to evolve, the integration of dealer positioning metrics into automated strategy development provides a sophisticated lens through which market participants can navigate shifting volatility landscapes and optimize execution timing across diverse asset classes.