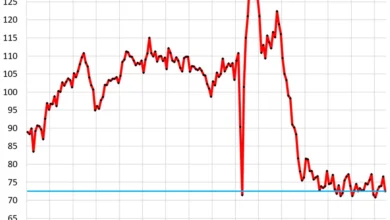
Nasdaq up by 60% since Liberation Day Selloff and by 100% in 3 Years. People Are Just Having Fun
The momentum behind the Nasdaq has been relentless since the market bottomed following the "Liberation Day" selloff on April 8, 2025. In the span of just over one year, the index has appreciated by 60%, a rate of growth that financial historians suggest may be unprecedented outside of the post-pandemic recovery or the height of the Dotcom era. While market participants have celebrated the "to the moon" trajectory of tech stocks, the sheer velocity of the ascent has raised questions about the decoupling of financial assets from macroeconomic reality.
The Widening Gap Between Markets and GDP
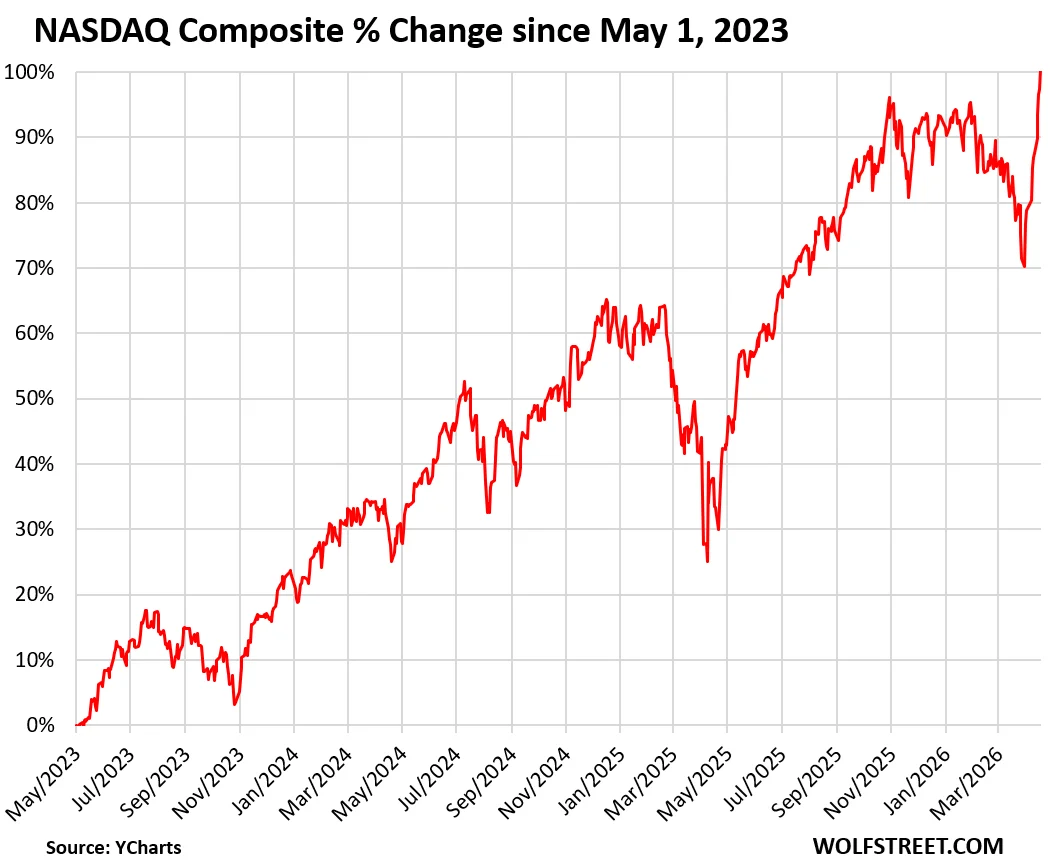
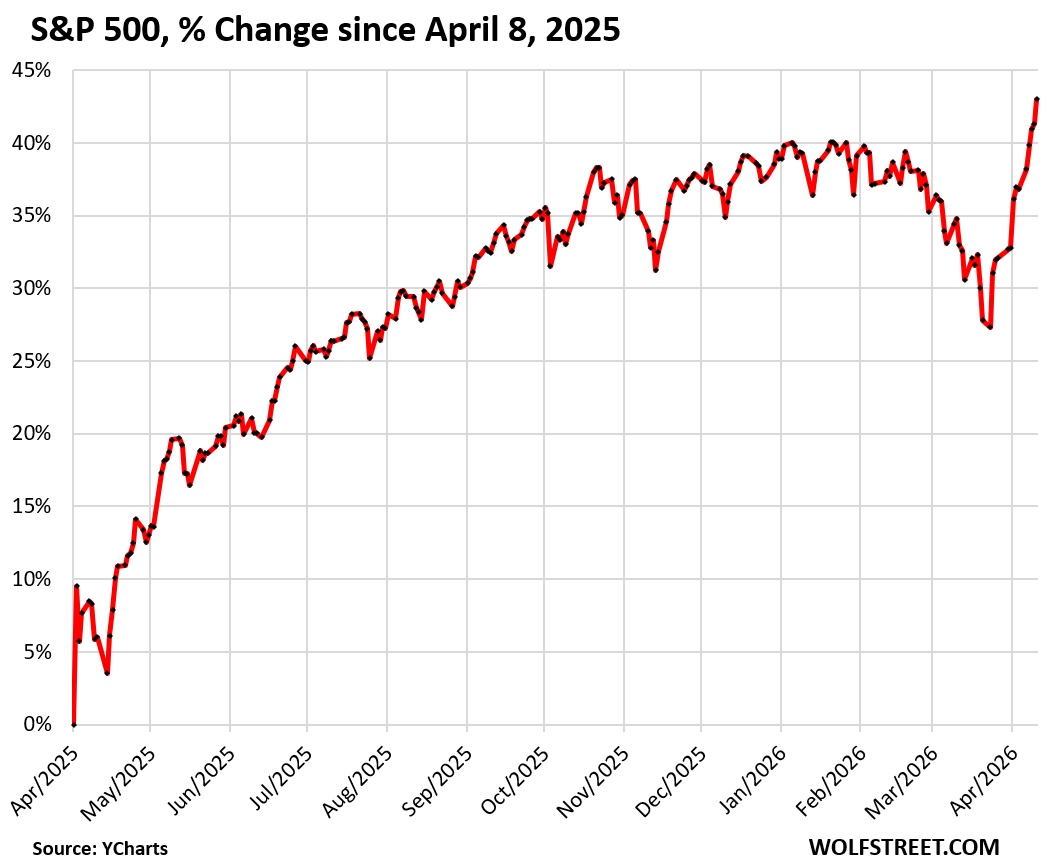
A comprehensive look at the last three years reveals a staggering divergence between the stock market and the real economy. Since May 1, 2023, the Nasdaq Composite has effectively doubled, posting a 100% gain despite significant volatility and the mid-2025 trough. During this same period, the S&P 500, often considered a broader barometer of American corporate health, rose by 71%.
In stark contrast, the United States economy, measured by nominal Gross Domestic Product (GDP), grew by only 15% over the same timeframe. Because nominal GDP is not adjusted for inflation, this figure represents the total dollar value of all goods and services produced. When the 100% growth of the Nasdaq is placed alongside the 15% growth of the nominal economy, the "valuation gap" becomes one of the most pronounced in modern financial history.
Economists typically look for a correlation between corporate earnings growth, GDP growth, and stock prices. When stock prices outpace economic output by a factor of nearly seven to one, it suggests that the primary drivers of the market are no longer fundamental economic expansion, but rather liquidity, speculative fervor, and perhaps a fundamental shift in how investors perceive risk.
A Chronology of the Recent Rally
The current market environment can be traced back through several pivotal stages over the last three years:
- The Accumulation Phase (May 2023 – March 2025): Stocks began a steady climb as inflation began to cool and the Federal Reserve signaled a pause in interest rate hikes. The Nasdaq benefited from the initial "AI Revolution," which saw massive capital inflows into a handful of mega-cap technology firms.
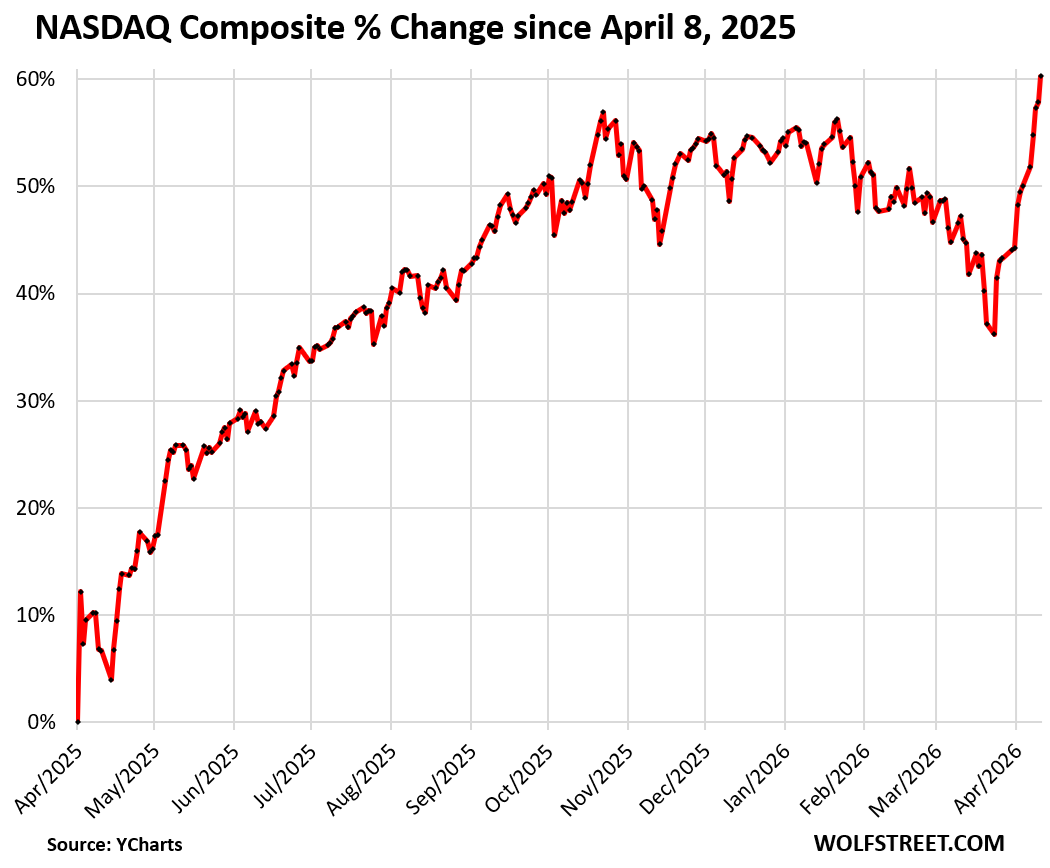
- The Liberation Day Selloff (April 2025): A sharp, sudden correction occurred in early 2025, bottoming on April 8. This "Liberation Day" event saw a rapid liquidation of leveraged positions, which many analysts at the time believed would lead to a prolonged bear market.
- The Vertical Recovery (April 2025 – April 2026): Contrary to bearish expectations, the market rebounded with extreme vigor. The Nasdaq gained 60% in the twelve months following the bottom, driven by a renewed speculative appetite and the "gamification" of retail trading platforms.
- The 13-Day Streak (April 2026): The most recent leg of the rally saw the Nasdaq gain 17.7% in just over two weeks, culminating in the record-breaking streak ended this Friday.
The Gamification of the Modern Exchange
The Wall Street Journal recently addressed this phenomenon in an article titled, “It’s Getting Harder to Tell Investing from Gambling, and it’s Not Your Fault.” This sentiment captures the current zeitgeist of the trading floor. The distinction between long-term capital allocation and short-term speculative wagering has become increasingly blurred.
Historically, investing was defined by the systematic evaluation of risk and the expectation of returns based on the productive capacity of an asset. Gambling, conversely, relied on price action and the hope that a "greater fool" would purchase the asset at a higher price. In the current market, these two motivations have fused.
The rise of zero-days-to-expiration (0DTE) options, high-frequency retail trading apps, and social-media-driven "meme" stocks has transformed the stock market into a venue that mirrors the volatility and psychological allure of a casino. This shift is most evident in the way investors have transitioned from high-risk cryptocurrencies back into equities.
Case Study: The Allbirds Pivot and Speculative Extremes
The case of Allbirds [BIRD] serves as a quintessential example of the current market’s speculative mechanics. Originally a high-profile sneaker retailer that went public in November 2021 with a $4 billion valuation, the company saw its shares collapse by 99.5% over several years. By mid-April 2026, the company’s market capitalization had withered to approximately $21 million, with shares trading at $2.50.
On April 15, the company announced a radical pivot, rebranding itself as an "AI infrastructure" provider. Simultaneously, it announced a $50 million potential investment structured as a "death-spiral" convertible stock offering. In a rational market, such a dilutive and desperate financing measure might be viewed with caution. Instead, the stock spiked by 890% to $24.31 almost overnight.
While the stock has since surrendered more than half of those gains, the event illustrates a broader trend: the "AI" label has become a powerful catalyst for speculative spikes, regardless of the underlying business’s viability. These "to the moon" movements are no longer exclusive to the crypto markets; they are now a routine feature of the New York Stock Exchange and the Nasdaq.

Cryptocurrencies vs. Equities: A Shift in Sentiment
For several years, Bitcoin and other digital assets were the primary outlet for pure speculation. However, the allure of crypto has faded as the stock market has provided even greater "excitement" with less perceived structural risk. Bitcoin has declined by approximately 38% since its peak in October 2025, leading many retail and institutional speculators to rotate back into tech stocks.
Wall Street’s move to integrate cryptocurrencies into traditional retirement accounts has further institutionalized the "gambling" aspect of finance. When brokerage houses facilitate the inclusion of highly volatile, non-productive assets into 401(k)s and IRAs, the traditional definition of "retirement planning" undergoes a fundamental change. Many investors now view their portfolios not as a collection of businesses, but as a series of tickers designed to be traded for momentum.
Market Analysis and Implications
The current disconnect between the 100% Nasdaq gain and the 15% nominal GDP growth carries several significant implications for the future of the financial system:
1. Valuation Compression Risks
When stock prices grow at six times the rate of the economy, the resulting "Price-to-Earnings" (P/E) ratios often reach levels that require decades of perfect economic conditions to justify. If the economy does not accelerate to meet these valuations, a "mean reversion" is statistically likely, which could result in a significant market correction.
2. The Wealth Effect and Inflation
The "wealth effect"—where consumers spend more because their portfolios are up—can drive demand-pull inflation. If the Nasdaq continues to soar while GDP growth remains modest, the Federal Reserve may find it difficult to maintain price stability, as the perceived wealth of investors outpaces the actual supply of goods and services.
3. Structural Fragility
The reliance on "death-spiral convertibles" and AI-pivot narratives suggests a market that is increasingly dependent on "financial engineering" rather than organic growth. If liquidity dries up or interest rates remain "higher for longer," the speculative floor under many of these stocks could give way.
4. Comparison to the Dotcom Bubble
The current 13-day winning streak and the 100% three-year gain bear a striking resemblance to the period between 1998 and 2000. During that era, the Nasdaq Composite similarly doubled before collapsing by 78% between March 2000 and October 2002. While "this time is different" is a common refrain among bulls, the mathematical reality of the GDP-to-Market cap ratio remains a persistent concern for value-oriented analysts.
Conclusion
As of late April 2026, the US stock market remains in a state of euphoria. The 1.5% jump on Friday and the record-setting streak have solidified the Nasdaq’s position as the preferred venue for those seeking rapid capital appreciation. However, the data remains clear: the economy is growing at a fraction of the pace of the market.
While the "fun" of the stock market has temporarily eclipsed the volatility of the crypto world, the fundamental question remains: can a financial system sustain a 100% increase in asset prices on the back of 15% economic growth? For now, investors seem content to ignore the disconnect, focused instead on the next 13 days of gains and the promise of the "moon." Whether this represents a new paradigm in finance or a classic speculative bubble remains to be seen, but the historical precedents suggest that such a wide gap between reality and valuation rarely closes gently.


