Quantitative Analysis of Insider Purchase Filings Reveals Significant Short-Term Market Correlation

Form 4 reporting remains one of the most uniquely transparent, structured, and deadline-driven data sources available to modern quantitative researchers. Under SEC regulations, corporate insiders—including officers, directors, and significant beneficial owners—must report reportable transactions by the end of the second business day following the trade. Because these filings are public, machine-readable, and tied to strict regulatory timelines, they serve as a primary instrument for studying the information content of executive behavior. However, as a new comprehensive study covering the period from January 1, 2022, through June 30, 2026, demonstrates, the reality of analyzing this data is far more nuanced than the simplistic view of "one insider, one trade."
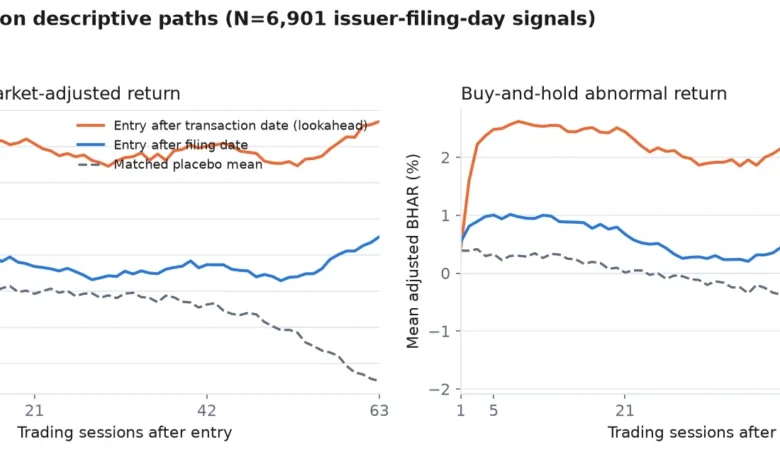
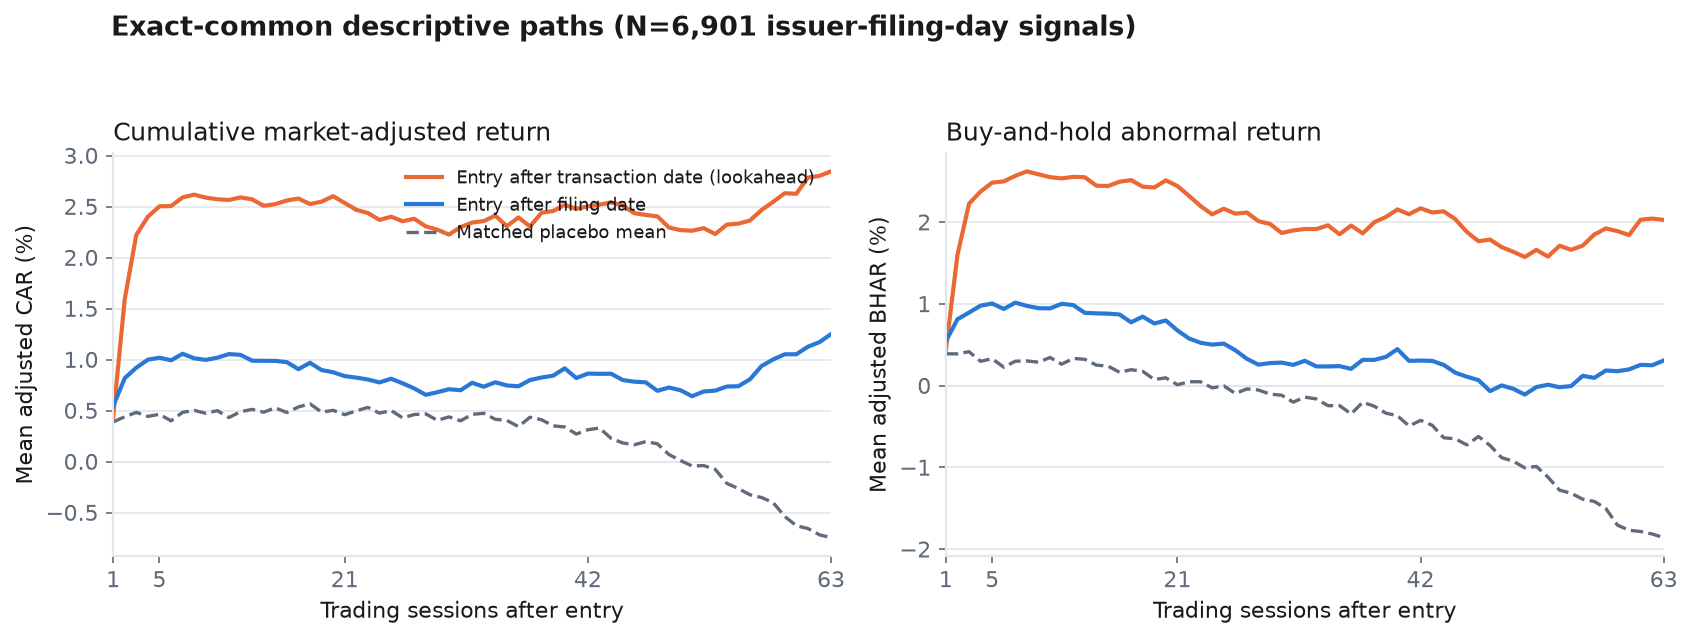
The research, which meticulously processed over 1.34 million transaction rows, highlights that the path from raw SEC disclosure to actionable market signal is fraught with technical complexity. After filtering for non-derivative purchases, validating fill prices, and aggregating data at the issuer-day level, the study distilled a final set of 7,406 public signals. The findings suggest a clear, though short-lived, market reaction to C-suite purchases, with an SPY-adjusted mean cumulative abnormal return (CAR) of +0.534% for the next trading session and +1.009% over the first five sessions.
The Anatomy of an Insider Signal
The study underscores the necessity of moving beyond the "open-market buy" narrative. SEC transaction codes, particularly code "P," cover both open-market and private transactions. By treating every "P" code as an on-exchange trade, researchers risk introducing significant noise into their datasets. Furthermore, the prevalence of joint filings—where multiple beneficial owners report the same transaction—presents a significant challenge for attribution. To maintain rigor, this study adopted a conservative approach, excluding all multi-owner filings. This choice, while reducing the sample size, ensures that each identified event is a clean, attributable signal.
A critical component of this investigation was the handling of Rule 10b5-1 plans. Following the SEC’s April 2023 mandate requiring the explicit flagging of transactions conducted under such plans, researchers gained a more precise tool for filtering out routine, non-discretionary trades. By removing transactions affirmatively marked as 10b5-1, the study focused on discretionary purchases that are more likely, though not definitively, information-driven.
Chronology and Methodology: The Funnel Approach
The research pipeline utilized a multi-stage "funnel" to ensure data integrity. The process began with 1,345,036 non-derivative rows, which were winnowed down to 11,957 component events after applying criteria such as security type (common stock only), officer status, and the exclusion of Rule 10b5-1 plans.
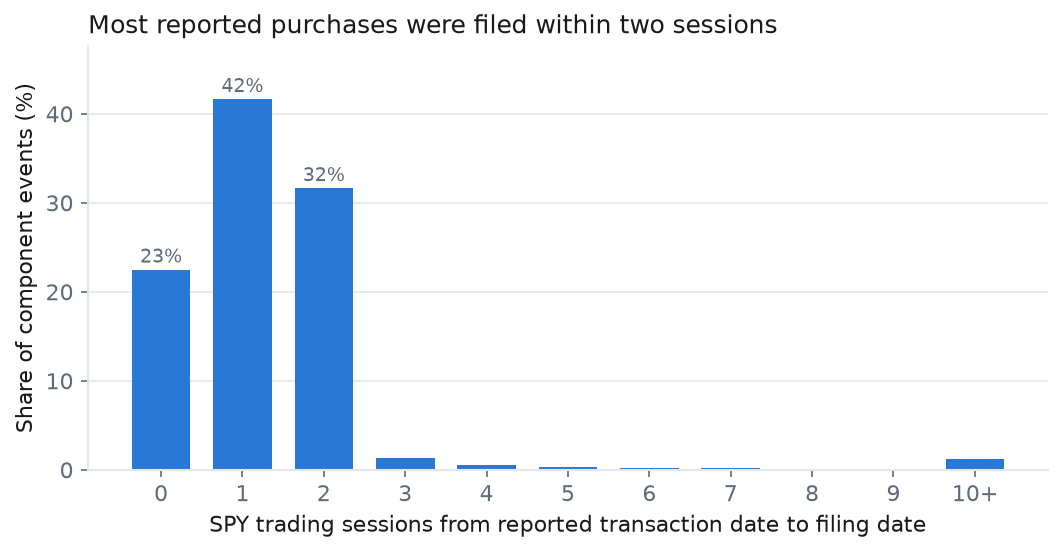
This methodology is essential because the raw data provided by the SEC is not a substitute for the underlying source filings. A key observation from the study is that the lag between transaction and filing is generally short, with a median of one session and 95.8% of filings submitted within two business days. By utilizing the filing date as the anchor for the event study—rather than the transaction date—the research avoids the common trap of "lookahead bias," where pre-publication price movements are incorrectly attributed to the filing event.
Statistical Inference and Market Sensitivity
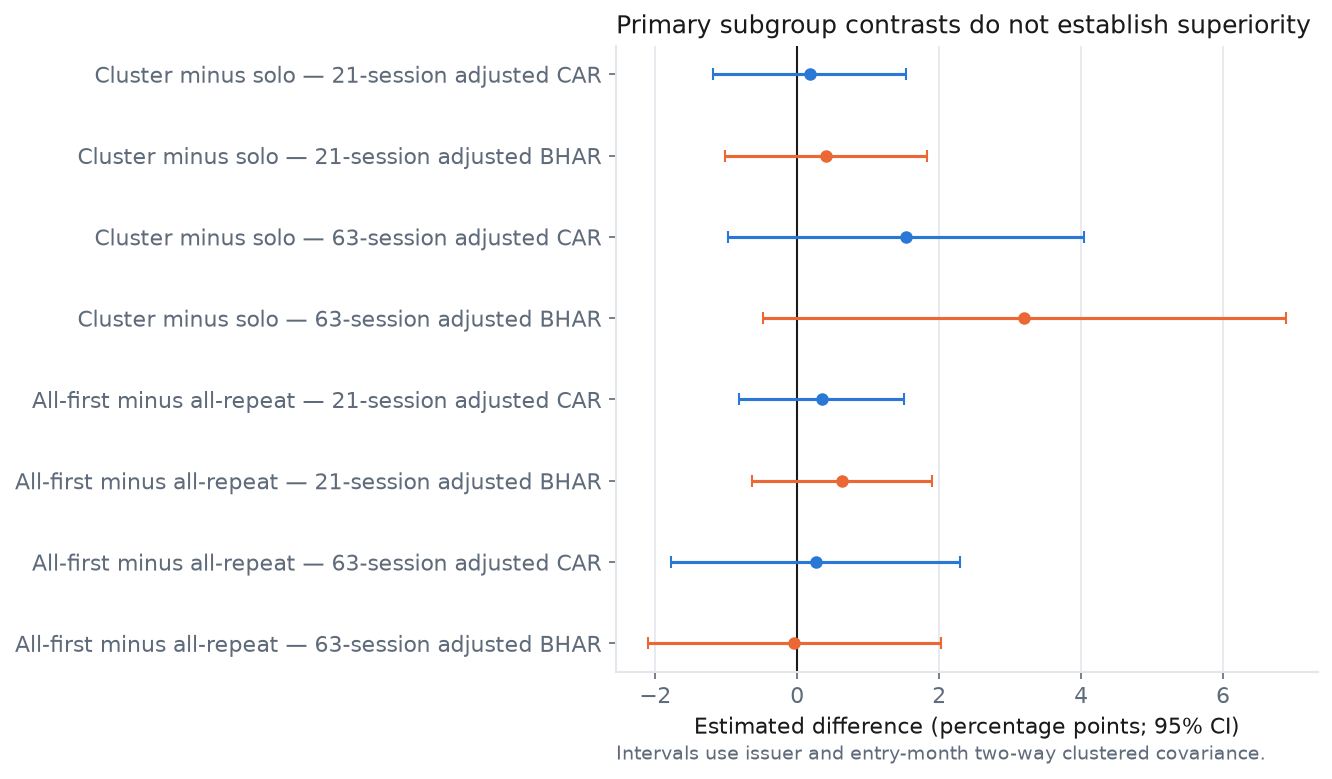
The study employed robust statistical methods to account for the dependencies inherent in financial data. Given that many issuers share the same market month, treating every signal as independent would lead to severely overstated precision. Instead, the research utilized Cameron-Gelbach-Miller two-way clustered covariance, which accounts for clustering at both the issuer and the month level.
The results offer a cautionary tale for those seeking a "silver bullet" for market alpha. While the short-term CAR of +0.534% is statistically significant with a t-statistic of 6.460, the long-term outlook is far more ambiguous. At 21 and 63 sessions, the confidence intervals for both CAR and Buy-and-Hold Abnormal Returns (BHAR) frequently include zero. This suggests that while insider purchases are associated with immediate price appreciation, they do not necessarily predict a sustained, multi-month drift.
Furthermore, the study highlights the sensitivity of results to the chosen market model. When applying a standard market model, the observed returns at 63 sessions appear much higher (+6.560%). However, the researchers treat this as a sensitivity check rather than a headline finding, noting that the model’s reliance on negative pre-event alpha—which is common in these datasets—mechanically inflates the results.
The Role of Corporate Actions and Data Quality
A significant hurdle in longitudinal event studies is the management of corporate actions, such as stock splits or dividends, which can distort price histories. The study’s methodology involved a manual classification of over 700 recorded actions. By comparing raw and adjusted returns, the researchers were able to identify and repair nominal price jumps in the historical data. This event-local validation—where only the affected intervals are excluded—provides a more granular and reliable approach than simply discarding entire tickers due to potential data quality concerns.
Implications for Market Participants
For market participants, the study’s findings offer three primary takeaways:
- Immediate Reaction is Not Strategy: The documented 0.5%–1.0% short-term gain following an insider purchase filing is a historical association, not a guaranteed return. It lacks any model for transaction costs, execution slippage, or portfolio management.
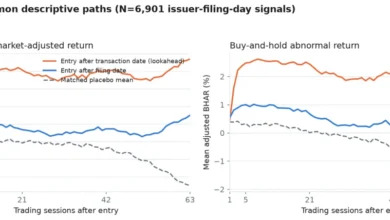
- The "Lookahead" Trap: Many historical studies inadvertently include returns from the period between the transaction and the filing. By demonstrating that transaction-date entry leads to higher, but biased, returns compared to filing-date entry, the study clarifies that much of the "insider edge" is actually just the inclusion of non-public information.
- Liquidity Constraints: A substantial portion of insider purchase volume occurs in securities where the purchase value represents a significant percentage of daily volume. For an institutional investor, this creates a liquidity ceiling that precludes the possibility of treating these filings as the basis for a high-capacity strategy.
Conclusion and Future Directions
The research concludes that while Form 4 data is an invaluable resource for understanding executive sentiment, its application requires extreme methodological discipline. The "modest" results reported here—distinguishable short-term correlations coupled with uncertain long-term drift—reflect the inherent complexity of markets.
By making the entire codebase, including the "funnel" logic and the result artifacts, publicly available via GitHub, the researchers have provided a blueprint for how to approach public-data event studies. This transparency is vital. In an era where alternative data is often sold as a "black box," the emphasis on reproducibility and the explicit listing of limitations serve as a model for future financial research.
Ultimately, the study does not suggest that insiders possess a magical ability to move markets for months on end. Instead, it illustrates a market that is generally efficient enough to digest the information contained in a Form 4 filing within a few trading sessions. For researchers and investors alike, the value of this data lies not in finding a simple predictive signal, but in the rigorous, systematic interrogation of the information as it becomes available to the public. As the study notes, the most important work in quantitative finance is not the headline backtest result, but the construction of a pipeline that allows for the honest, reproducible interrogation of market realities.