Harnessing Large Language Models for Risk-Managed Algorithmic Trading Strategies

The landscape of algorithmic trading has undergone a paradigm shift as developers move away from the elusive goal of predictive price forecasting toward the more pragmatic objective of risk management. For decades, quantitative researchers have grappled with the inherent difficulty of predicting next-day returns for liquid large-cap stocks. As noted by industry experts like Ernest Chan, the efficient market hypothesis renders the prediction of market direction—whether a stock will rise or fall—a task that remains notoriously unreliable for standard machine learning models. A new methodology proposed by Jose Carlos Gonzales Tanaka suggests that Large Language Models (LLMs), specifically the DeepSeek architecture, may provide a superior utility when repurposed as "risk managers" rather than market prognosticators.
This shift in strategy prioritizes the assessment of market regimes—evaluating whether current conditions favor full capital exposure or a defensive posture—over the attempt to divine the trajectory of specific assets like Apple Inc. (AAPL). By integrating LLM-assisted decision-making with automated, hard-coded guardrails, researchers are developing frameworks that allow traders to participate in positive market drift while mitigating the impact of catastrophic drawdowns.
The Shift from Prediction to Risk Governance
The fundamental failure of many LLM-based trading attempts lies in the framing of the prompt. When prompted to predict price direction, models often hallucinate patterns where only noise exists. The alternative approach involves providing the LLM with a comprehensive, compact summary of historical statistics—including mean returns, standard deviations, and Sharpe-like performance scores across discretized market states. By feeding this structured data into the model, the LLM acts as an analytical layer that outputs a "policy table," determining the optimal percentage of capital to deploy.
In this specific implementation, the model does not engage in short-selling or leveraged trading. Instead, it maintains a long-only position ranging from 50% to 100% exposure. This "cautious-long" approach is designed to ensure that the portfolio remains invested in the market’s inherent positive drift, a critical factor for long-term equity growth, while still retaining the flexibility to pull back when the LLM identifies elevated risk states.
Establishing the Technical Framework and Data Integrity
The efficacy of any algorithmic strategy is tethered to the quality of its underlying data. In the case of high-growth equities such as Apple, failing to account for historical stock splits results in significant artificial spikes that can derail volatility calculations and trend analysis. The current strategy mandates the use of auto-adjusted data to ensure that all rolling volatility, z-scores, and trend indicators are calculated against normalized historical price action.
The system relies on a multi-layered control panel that dictates:
- Data Parameters: Defining the historical lookback windows for feature extraction.
- Cost Assumptions: Factoring in slippage and transaction costs, which are vital for real-world viability.
- Exposure Mapping: The bridge between the LLM’s qualitative assessment and the quantitative position size.
By setting a "FLAT" exposure of 0.5 rather than 0.0, the strategy avoids the trap of total divestment during uncertain, yet ultimately bullish, periods. Historical backtesting indicates that moving to zero cash during minor pullbacks can result in a significant loss of CAGR, as the strategy misses the market’s recovery phases.
Feature Engineering and Market State Discretization
To make complex market data digestible for an LLM, the system utilizes feature engineering to describe the "mood" of the market. Seven distinct signals are derived from OHLCV (Open, High, Low, Close, Volume) data. These signals are then discretized into 12 distinct "market states."
This bucketing is essential because continuous data points are often too granular for effective pattern recognition. By grouping data into labeled states—such as "trending upward in a calm, overbought market"—the LLM can leverage its vast training data to infer risk profiles. The use of a rolling 252-day median to determine volatility thresholds ensures the strategy remains adaptive to changing macro environments, effectively distinguishing between the low-volatility regimes of 2017 and the post-COVID era.
Implementing Hard Guardrails and Avoiding Deadlock
Even the most sophisticated LLM is susceptible to "black swan" events or market behaviors that lack historical precedent. To address this, the framework incorporates hard-coded guardrails that function independently of the LLM’s policy.
These guardrails include:
- Volatility Stops: Automatically de-risking if realized volatility exceeds a specified threshold, confirmed by acceleration in short-term volatility.
- Drawdown Stops: Triggering a position reduction if equity falls below a defined limit, coupled with a trend-break filter (e.g., price dropping below the 50-day moving average).
- Re-entry Mechanisms: A critical component designed to prevent "guardrail deadlock," where a strategy remains in a flat position indefinitely because the lack of market participation prevents the equity curve from recovering.
A significant finding in recent research is that many automated strategies fail due to this deadlock. By incorporating a "cooldown" period of 10 trading days, the system forces a re-entry, ensuring the strategy continues to participate in the market and allowing the equity curve to potentially recover above the drawdown threshold.
Walk-Forward Methodology and Out-of-Sample Results
The strategy is verified through a monthly walk-forward loop, a rigorous testing standard that prevents lookahead bias. For every month from January 2023 onward, the model is trained exclusively on the preceding three years of data. This ensures that at any point in the backtest, the model only makes decisions based on information that would have been available to a trader at that time.
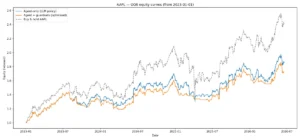
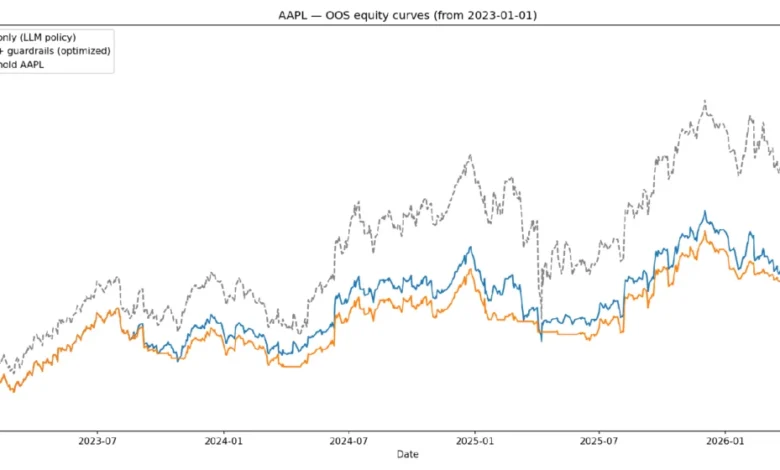
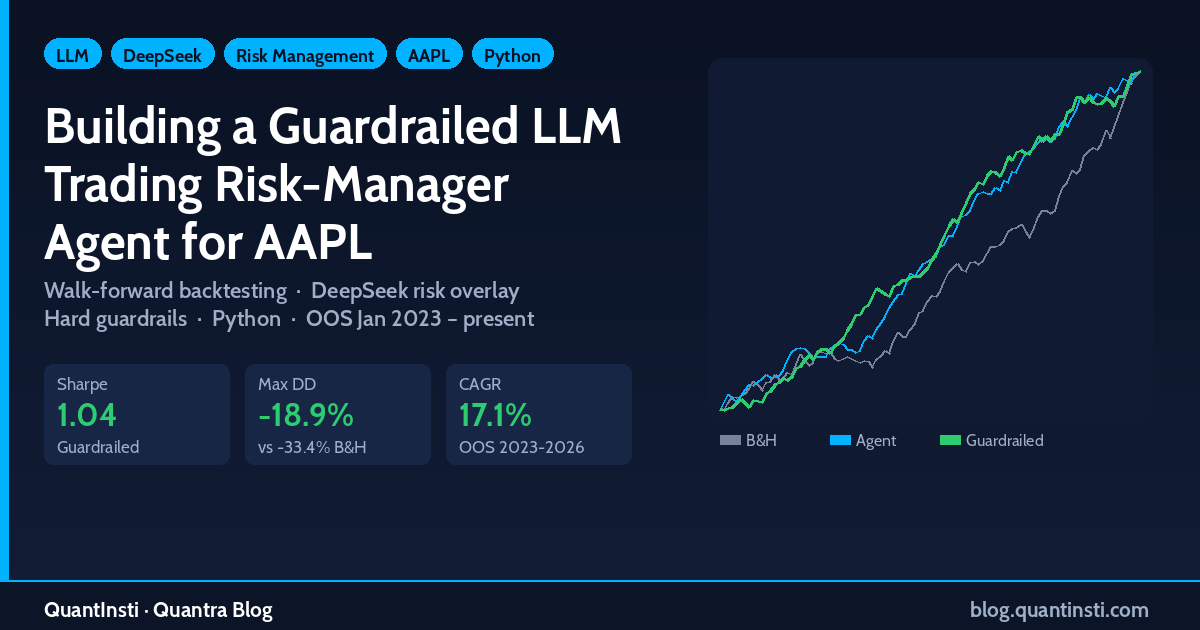
The results, while not necessarily generating "alpha" in the traditional sense of beating buy-and-hold returns on a raw CAGR basis, demonstrate significant success in risk-adjusted performance. The strategy successfully participates in the upward momentum of AAPL while significantly curbing maximum drawdown. Specifically, while buy-and-hold strategies might experience drawdowns of 22-33%, the guardrailed LLM-assisted strategy has demonstrated the ability to compress these losses to approximately 18%.
Implications and Future Directions
The core takeaway for quantitative analysts is that LLMs provide a robust, nuanced layer for risk modulation. As stated in the research, the value of the LLM lies in its ability to differentiate between market states with a level of sophistication that exceeds simple, rigid thresholds.
Future development is expected to focus on:
- Multi-Horizon Momentum: Integrating 5-day and 63-day trends to help the LLM distinguish between early-stage and late-stage trends.
- Earnings Blackout Filters: Automatically moving to a defensive position during known corporate earnings volatility.
- Macro Contextualization: Using broader indices, such as the S&P 500’s relationship to its 200-day moving average, to provide the LLM with a wider market perspective.
The transition toward LLM-based risk management signifies a maturing of AI in finance. Rather than viewing models as oracle-like predictors of the future, the industry is increasingly treating them as sophisticated decision-support tools. This evolution toward "human-in-the-loop" or "AI-assisted governance" frameworks represents a more sustainable, and ultimately more reliable, path for the next generation of algorithmic trading systems. While no system can eliminate market risk, the combination of LLM policy tables and disciplined, rule-based guardrails offers a path to more consistent, risk-managed participation in global financial markets.