The realm of algorithmic trading has long grappled with a fundamental challenge: how to build strategies that are not just profitable in the past, but resilient enough to navigate the unpredictable currents of the future. Historically, traders have relied almost exclusively on historical price data for strategy development and backtesting. However, this approach inherently limits the scope of testing to a single, known trajectory of market behavior. Build Alpha, a prominent platform in quantitative trading technology, is pioneering a shift towards a more robust methodology by introducing the concept of building trading strategies across a "multiverse of price paths" generated through synthetic data. This innovative approach aims to equip traders with systems that can survive and thrive irrespective of market conditions, moving beyond the limitations of a single historical data point.
The Peril of a Single Historical Path
The core tenet of Build Alpha’s enhanced strategy development lies in the understanding that historical data represents just one realization of market events. While this single path (often visualized in green) shows what did happen, it fails to account for the myriad of alternative price trajectories that could have occurred. These unobserved, yet plausible, paths (represented by black lines in conceptual diagrams) hold crucial lessons for strategy robustness. As the article highlights, relying solely on historical data means developing strategies that are implicitly betting on the persistence of a specific market environment. This is a precarious position, as markets are inherently dynamic, characterized by shifts in volatility, noise levels, and sequential price movements, often punctuated by unexpected shocks.
The goal of a truly robust trading strategy is its ability to perform consistently across a range of market conditions, rather than being optimized for a single, historical scenario. This implies a need to test strategies against variations in market noise, volatility regimes, and the sequence of price changes. The introduction of synthetic data into the strategy-building process offers a powerful solution to this challenge, enabling traders to simulate a broader spectrum of potential future market realities.
Exploring Alternate Realities: The Power of Synthetic Data
Synthetic data, in this context, refers to artificially generated price series that mimic the statistical properties of real market data but represent distinct price paths. These paths can be conceptualized as parallel universes, each with its own unique sequence of price movements. By training strategies across hundreds or even thousands of these synthetic price series, traders can move beyond the confines of a single historical record and develop systems that are inherently more adaptive and resilient.
Build Alpha champions three primary methods for generating this synthetic data:
-
Vs Shifted Data: This technique involves subtly altering the boundaries of trading bars. For instance, standard 15-minute data might create bars at the top of the hour, 15 minutes past, 30 minutes past, and 45 minutes past. Vs Shifted data creates new series by starting these bars at slightly different times (e.g., 3 minutes past the hour, 18 minutes past, etc.). While the underlying market dynamics and patterns remain similar, the precise open, high, low, and close (OHLC) values for each bar, as well as indicator calculations, will differ. This method tests a strategy’s sensitivity to the exact timing of price data capture.
-
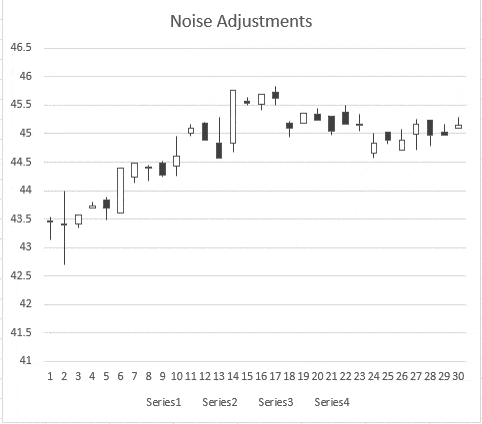
Noise-Adjusted Data: This approach introduces random variations in volatility to each price bar. By adding or subtracting a percentage of the Average True Range (ATR) to the open, high, low, or close prices, thousands of new synthetic series can be generated. This process helps prevent strategies from overfitting to the specific noise characteristics of a single historical dataset, forcing them to perform well even when the market experiences unexpected spikes or dips in volatility.
-
Monte Carlo Permutation (MCP): Drawing from established quantitative finance literature, the MCP method, as popularized by Timothy Masters, involves reshuffling the logarithmic increments of price changes within bars. These shuffled increments are then exponentiated back into raw OHLC prices. This technique preserves the fundamental statistical properties and distribution of the original data but creates entirely new, distinct price paths. It’s a powerful way to generate data with the same statistical fingerprint but a different sequential path.
Beyond these core methods, Build Alpha also embraces advanced techniques such as Generative Adversarial Networks (GANs) and other deep learning approaches. GANs, in particular, employ a competitive process between two neural networks: one generates synthetic data, and the other attempts to distinguish it from real data. This adversarial training can yield synthetic price data that is statistically indistinguishable from actual market data, offering a sophisticated way to expand training datasets. Furthermore, Build Alpha supports custom data imports, allowing traders to integrate their own synthetic data generated from proprietary models or external sources.
Pre-Simulation vs. Post-Simulation: A Paradigm Shift
Traditionally, robustness testing has been a "post-simulation" activity. Traders would develop a strategy based on historical data, and then, as a validation step, re-trade this strategy on various synthetic datasets to assess its resilience. Build Alpha’s innovation lies in enabling "pre-simulation" strategy building. This means that synthetic data is integrated into the strategy discovery process itself, directly within the genetic algorithm or optimization engine. Instead of testing a finished strategy, the system now actively builds strategies that are optimized to perform well across both the historical path and a multitude of synthetic paths simultaneously from the outset.
This pre-simulation approach is complemented by post-simulation testing. The ideal workflow, as recommended by Build Alpha, involves building strategies on synthetic data first, and then rigorously validating the survivors using post-simulation techniques such as the Noise Test, Monte Carlo simulations, and out-of-sample testing. This layered approach ensures that strategies are not only discovered in a more robust environment but also thoroughly vetted against potential market anomalies.
Setting Up Synthetic Data in Build Alpha
Integrating synthetic data into the strategy development workflow within Build Alpha is designed to be intuitive. After selecting the target market(s) for trading, users can access an "Additional Data" option. This feature allows for the generation of a specified number of synthetic data series using the available methods. For instance, a trader might choose to create nine additional data series for SP500 Emini Futures, with three series generated via Vs Shifted, three via Noise Adjusted, and three via Monte Carlo Permutation. The platform seamlessly scales this configuration if multiple symbols are selected, automatically generating the specified number of synthetic series for each.
Interpreting Results: Basket (BSK) and Equity Curves
The results of simulations incorporating synthetic data are presented in a comprehensive manner. Build Alpha introduces "BSK" (Basket) results, which highlight strategies that have demonstrated optimal performance across the entire basket of data series, including the original historical data and all generated synthetic series. Users can expand these BSK rows to examine the specific performance of a strategy on each individual data series, identified by suffixes like _NS for Noise Sample, _MCP for Monte Carlo Permutation, and +hhmm for Vs Shifted.
Visually, the platform offers a "Basket Equity Curve Graph." This feature allows traders to overlay the equity curve of a selected strategy across all the synthetic and historical data series. Each generation method is assigned a distinct color, providing an immediate visual assessment of how well the strategy performs across different simulated market realities. A strategy whose equity curve remains consistently profitable across all generated series and colors is a strong indicator of robustness.
Customizing Robustness: Filtering the Multiverse
Recognizing that not all synthetic scenarios are equally relevant to every trader’s risk profile, Build Alpha incorporates a powerful no-code rule builder. This feature allows traders to define specific criteria for qualifying synthetic data series to be included in the training or analysis process. These custom rules enable users to filter the "multiverse" and focus on stress scenarios that align with their particular concerns. Examples of these filters include:
- Correlation Filter: Selecting synthetic series that exhibit a specific correlation coefficient (e.g., between 0.25 and 0.75) with the original historical data.
- Larger Drawdown: Requiring synthetic series to exhibit deeper drawdowns than observed in the historical data.
- Slower Recovery: Setting conditions for synthetic series that take longer to recover from their maximum drawdown.
- Higher Volatility: Filtering for synthetic data that demonstrates increased volatility regimes.
These rules can be combined using logical operators (like "OR") and the results are often color-coded on charts, allowing for a nuanced understanding of how strategies perform under specific, user-defined stress conditions.
Integrating Synthetic Data into Walk-Forward Optimization
The utility of synthetic data extends to advanced optimization techniques like Walk-Forward Optimization (WFO). Build Alpha allows for the injection of synthetic data directly into the WFO process. Traders can configure the WFO to simulate with synthetic data, specifying the symbol, timeframe, and data generation methods. Crucially, qualifying rules can be applied here as well, meaning that only synthetic series meeting predefined criteria are considered.
In a typical WFO setup, parameters must not only perform well on historical data but also pass a set of synthetic scenarios. This ensures that the optimized parameters are not merely curve-fitted to the past but are robust enough to handle a range of simulated future market conditions. This approach is particularly valuable for stress-testing strategies against feared market shocks, preparing for the "probable future" rather than merely optimizing for the "certain past."
Broader Implications for Algorithmic Trading
The adoption of synthetic data in strategy development represents a significant evolution in algorithmic trading. By moving beyond the limitations of historical data, traders can achieve a more comprehensive understanding of their strategy’s potential performance and resilience. This methodology addresses a critical gap in traditional backtesting, which often fails to account for the full spectrum of market behavior.
The ability to generate and test strategies across a "multiverse of price paths" allows for the identification of underlying signals that are robust across various market regimes, rather than being susceptible to the specific noise or patterns of a single historical period. This is akin to building a ship designed not just for calm seas but for a variety of storms, ensuring its seaworthiness regardless of the weather.
The implications for portfolio construction are profound. By combining strategies built and tested across diverse data generation methods, traders can construct portfolios that are inherently more diversified and less vulnerable to unforeseen market events. The rigorous validation process, which includes synthetic data testing, noise tests, Monte Carlo simulations, and walk-forward optimization, creates a pipeline for deploying strategies with a higher degree of confidence.
Build Alpha’s platform aims to automate this entire workflow, from strategy generation across historical and synthetic data, through filtering based on out-of-sample performance, to validation and parameter optimization. The ultimate goal is to present traders with only those strategies that have demonstrably survived a gauntlet of simulated market conditions, including those derived from the vast possibilities of synthetic data. This systematic approach to building robustness is essential for long-term success in the ever-evolving financial markets.


