Demystifying Gamma Exposure (GEX): How Market Maker Hedging Drives Volatility Regimes and Systematic Trading Strategies

The modern financial marketplace operates under a complex ecosystem where derivative flows routinely dictate the behavior of underlying asset prices. Among the most sophisticated and powerful metrics utilized by quantitative researchers, systematic funds, and institutional desks is Gamma Exposure, commonly referred to as GEX. At its core, gamma exposure is a dollar-denominated estimation of the volume of stock or futures contracts option dealers must proactively buy or sell to maintain delta-neutral portfolios as the underlying market shifts. By aggregating the gamma of every open option contract—weighted heavily by open interest and mapped systematically across diverse strike prices and expiration dates—analysts can distill massive order book mechanics into a single, predictive daily figure.
Understanding the underlying structural mechanics requires looking at the commercial relationship between retail and institutional market participants and market makers. Typically, market makers act as the ultimate liquidity providers, selling the vast majority of options demanded by buyers. Because these options carry embedded risk, market makers continuously hedge their directional delta exposures. Whether this mandatory hedging activity actively suppresses market volatility by leaning against prevailing price movements or violently exacerbates trends by chasing price action depends entirely on the arithmetic sign of their net gamma inventory. Consequently, quantitative platforms utilize GEX as an indispensable regime signal to calibrate systematic algorithmic strategies across varying market conditions.
The Genesis and Empirical Evolution of Gamma Exposure
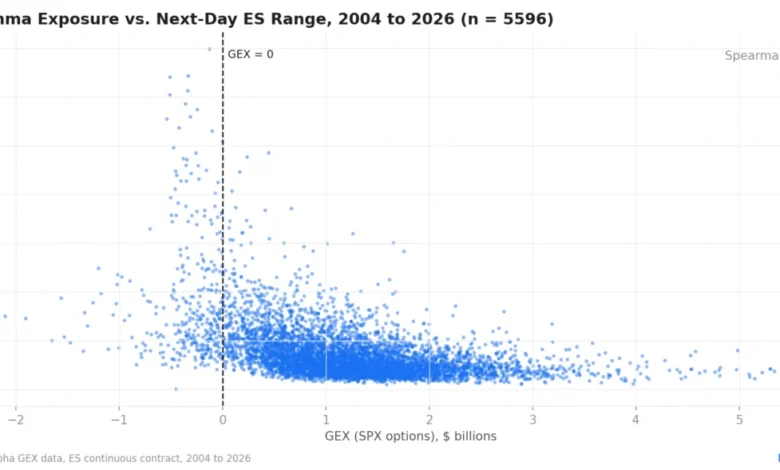
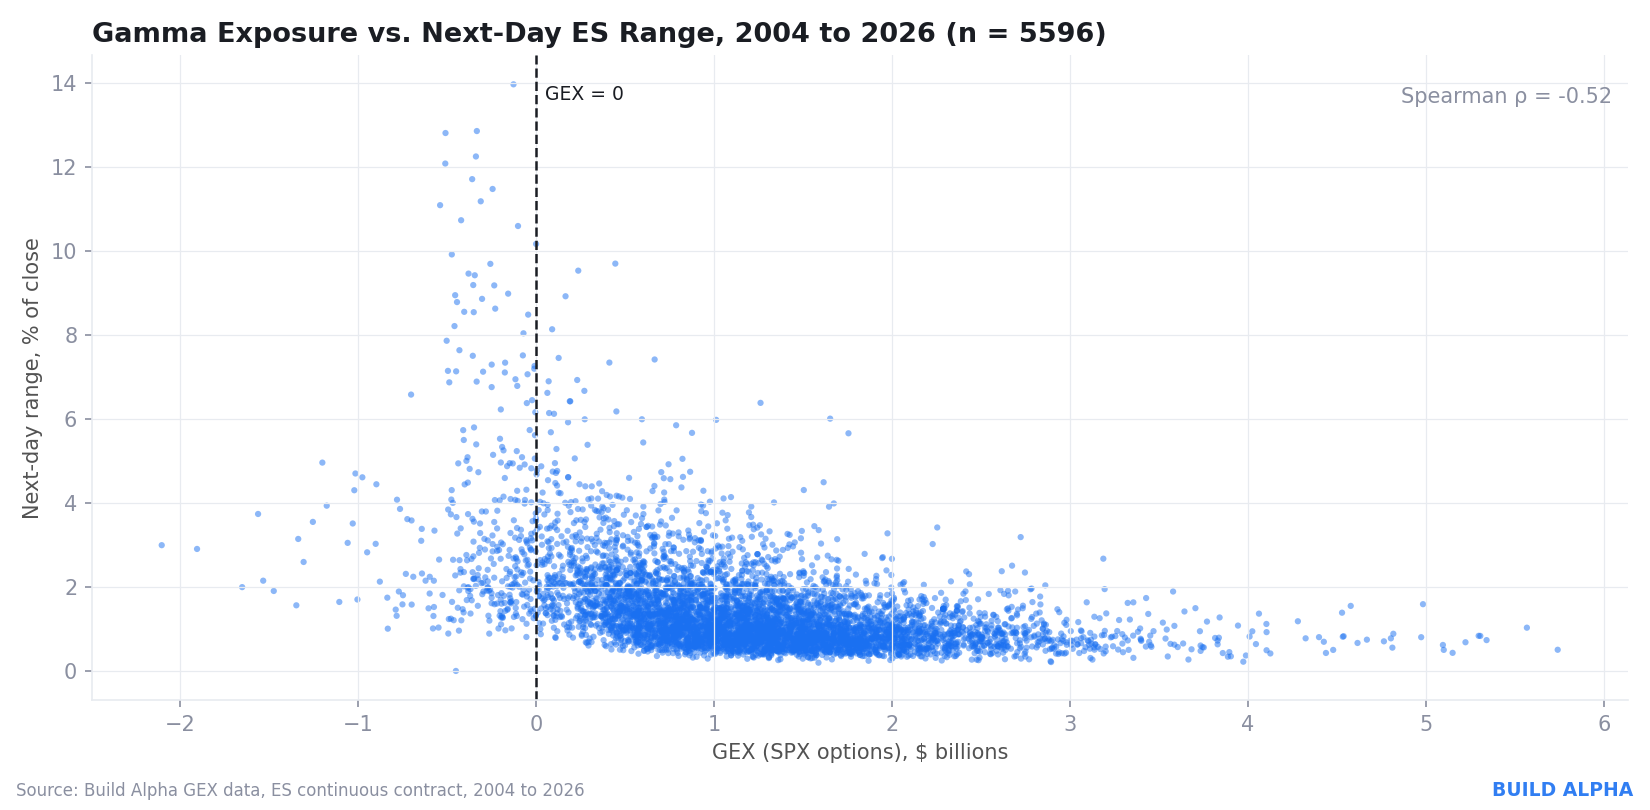
The popularization of GEX as a commercial and academic trading metric gained widespread traction following foundational white papers by quantitative research firm SqueezeMetrics. Their empirical evaluations demonstrated a profound inverse relationship between S&P 500 realized volatility and aggregate gamma exposure. Specifically, realized volatility consistently registers at its lowest structural levels during periods of high positive GEX, while experiencing exponential surges when GEX drops below zero. Furthermore, historical intraday market shocks and extreme price ranges heavily cluster within negative gamma environments. This structural realization transformed GEX from an obscure options desk metric into a premier regime-filtering tool for algorithmic developers worldwide.
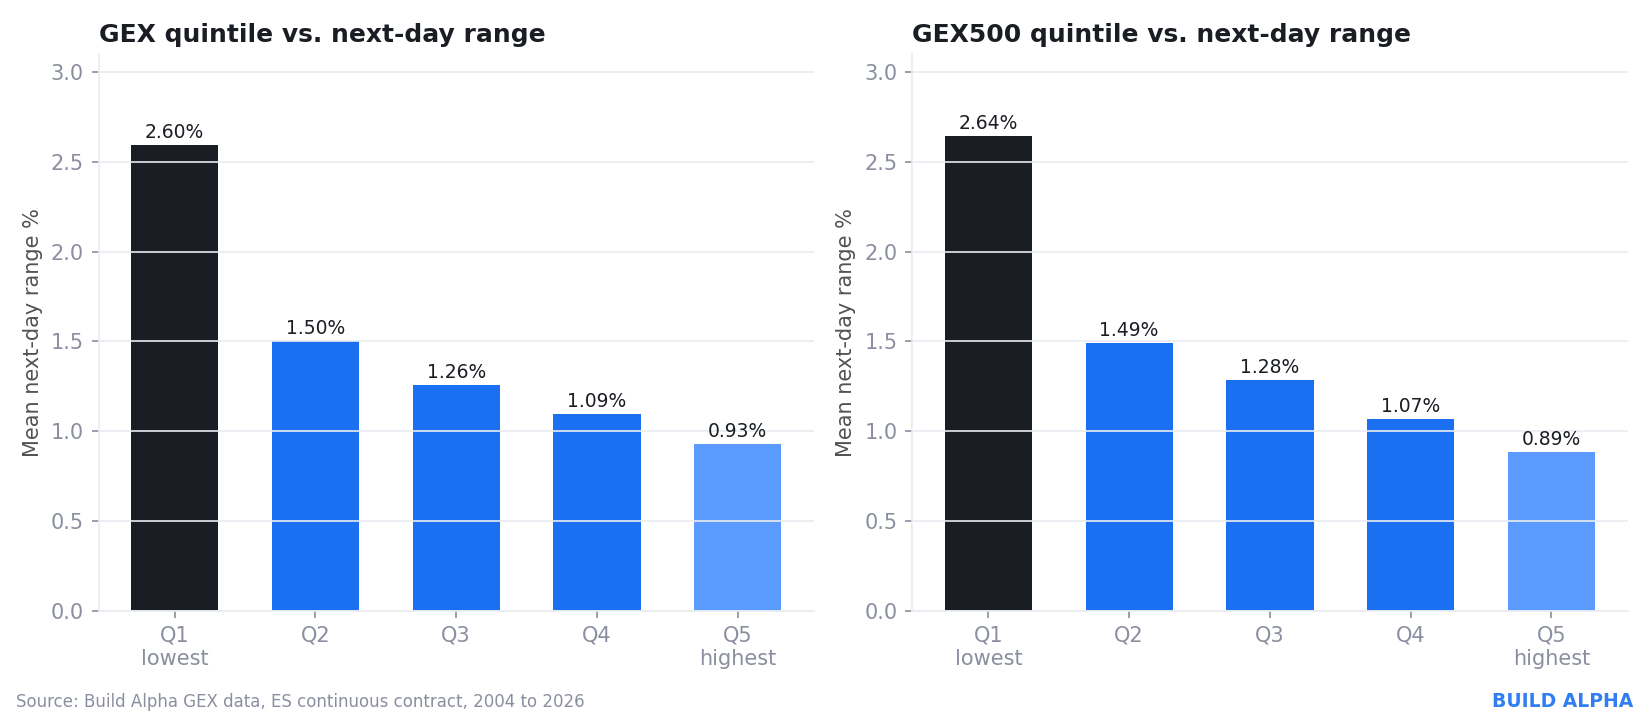
To rigorously test whether this theoretical relationship survived changing market structures, extensive data analyses spanning from January 2004 through September 2026—encompassing over 5,500 individual trading sessions—were evaluated against standard E-mini S&P 500 (ES) futures ranges. When sessions are systematically divided into quintiles based on daily GEX values, the empirical evidence is striking. The lowest GEX quintile exhibits an average next-day price range nearly three times larger than that of the highest GEX quintile, displaying a remarkably monotonic progression across all intermediate buckets. Furthermore, sessions characterized by outright negative GEX routinely posted average daily ranges exceeding 3.6%, compared to a modest 1.3% average during positive regimes.
Even when controlling for recent market volatility by measuring ranges relative to a 20-day Average True Range (ATR) rather than raw percentages, the predictive capacity remains intact. The persistent negative rank correlation demonstrates conclusively that gamma exposure carries distinct informational value regarding future price dispersion that historical volatility metrics alone fail to capture. Sub-period analyses spanning major historical epochs—including the aftermath of the 2008 financial crisis, the prolonged low-volatility expansion of the 2010s, and the turbulent post-pandemic era through 2026—confirm that the predictive power of GEX has not been arbitraged away. In fact, modern quantitative evaluations indicate that the rank correlation between GEX and subsequent market ranges has strengthened in recent datasets.
Deconstructing the Two Gamma Regimes: Positive Versus Negative GEX
To effectively leverage gamma exposure within systematic trading frameworks, market participants must differentiate between positive and negative gamma regimes. Each environment establishes a distinct behavioral framework for institutional hedging flows, dictating optimal execution styles for active traders.
Under a positive gamma regime, dealers maintain a net long gamma posture. As the underlying index price rises, delta hedging requires dealers to sell underlying shares to reduce their growing positive delta. Conversely, when the market falls, dealers are forced to buy underlying shares to maintain neutrality. This dynamic creates a powerful stabilizing feedback loop: dealer hedging aggressively leans against market momentum. Consequently, price ranges contract, directional rallies and sell-offs frequently fade, and prices exhibit strong mean-reverting tendencies, often "pinning" near large open-interest strike prices. This environment heavily favors fading extremes, range-bound trading methodologies, and short-premium options strategies.
Conversely, under a negative gamma regime, dealers hold a net short gamma profile. As the underlying asset appreciates, dealers must aggressively buy into rallies to remain hedged. When the market drops, they are compelled to sell into the decline. This hedging behavior acts as a market accelerator, pushing prices further in the direction of the initial move. Volatility expands rapidly, directional trends extend significantly, and intraday price gaps become commonplace. Consequently, negative gamma environments are exceptionally well-suited for breakout strategies, trend-following models, and trading setups utilizing wider stop-losses and extended profit targets.
Index Versus Component Options: Analyzing the GEX Versus GEX500 Spread
Advanced quantitative architectures often differentiate between primary index-level gamma exposure (GEX), derived exclusively from S&P 500 index options (SPX), and aggregated component gamma exposure (GEX500), compiled bottom-up from individual option chains across all constituent equities within the S&P 500. Because index options and single-stock options attract distinct market participant demographics utilizing vastly different trading motivations, these two series frequently diverge.
When both GEX and GEX500 register high positive values, market-wide dealer positioning is uniformly anchored, creating a synchronized stability across the broader equity market. However, when the two series diverge—creating a meaningful spread—the resulting disparity offers vital intelligence regarding structural market health. Quantifying this spread involves tracking multiple parameters, including its absolute dollar size, directional sign, velocity of change, rolling percentile rank, and statistical z-score. Monitoring these dynamics allows systematic traders to ascertain whether a prevailing market regime is broad-based or narrow, and whether institutional positioning is strengthening or quietly unwinding.
Normalizing Raw Data for Robust Algorithmic Implementation
Because raw GEX is denominated in nominal dollars, secular growth in options market volume over the past two decades means that a nominal dollar figure considered extreme in 2015 is routine in the modern trading landscape. Directly utilizing unadjusted nominal levels within algorithmic models introduces fatal look-ahead and structural decay biases. Therefore, quantitative developers employ rigorous normalization techniques mirroring methodologies established in traditional commitment of traders (COT) index analysis.
Primary normalization protocols include calculating a rolling 252-period percentile rank—mapping today’s reading against approximately one year of historical observations to isolate true operational extremes above the 90th or below the 10th percentiles. Additionally, rolling z-scores measure precisely how many standard deviations a given reading sits from its multi-period mean, effectively flagging statistically rare positioning extremes. Complementary methods evaluate moving average comparisons of spreads and ratios, as well as multi-period high-and-low breakouts, capturing positioning momentum ahead of major volatility shifts.
Strategic Applications and Risk Management Best Practices
Rather than serving as a blunt standalone trade trigger, institutional practitioners overwhelmingly deploy gamma exposure as a sophisticated contextual regime filter. By implementing conditional logic—such as restricting breakout entries exclusively to negative gamma environments, or limiting mean-reversion fades strictly to positive gamma regimes—systematic developers can drastically improve the expectation profile of their core trading strategies. Furthermore, because dealer gamma reflects broader market-wide risk appetite, these quantitative signals successfully translate beyond equity indices, offering robust filtering capabilities across alternative asset classes including precious metals, fixed income futures, and foreign exchange markets.
Nevertheless, incorporating complex multi-variable custom signals introduces substantial search space dimensions, heightening the risk of over-optimization and curve-fitting. Comprehensive out-of-sample testing, rigorous noise testing, and structural parameter permutation remain mandatory before deploying any capital against strategies derived from options dealer positioning metrics. By treating gamma exposure as a structural map of institutional liquidity obligations rather than a crystal ball, quantitative developers can successfully navigate the structural shifts that define modern financial markets.