Triangulated Statistical Arbitrage: Refining Strategies for Independent Traders

This article, the fifth in a six-part series on statistical arbitrage for independent traders, delves into the sophisticated "Triangulated Statistical Arbitrage" (Triangulated Stat Arb) methodology. Building upon previous discussions that identified patterns in energy spreads and highlighted the challenges of single-pair analysis, this installment explores how a network-based approach can significantly enhance trading strategies by identifying more robust mispricings and constructing diversified portfolios.
The Limitations of Single-Pair Analysis
Historically, statistical arbitrage, particularly pairs trading, has focused on identifying two highly correlated assets whose price divergence suggests a temporary mispricing. The strategy involves shorting the relatively overvalued asset and longing the undervalued one, anticipating a convergence back to their historical relationship. However, as explored in previous parts of this series, this approach is fraught with limitations. A common pitfall is the presence of "fair-value hedges"—assets within a pair that are not genuinely mispriced but are simply dragged along by the movement of the other asset. This can dilute the effectiveness of the strategy and introduce unnecessary risk.
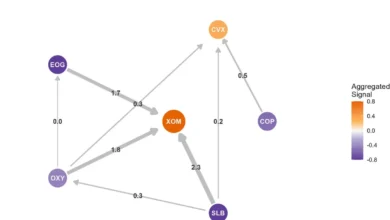
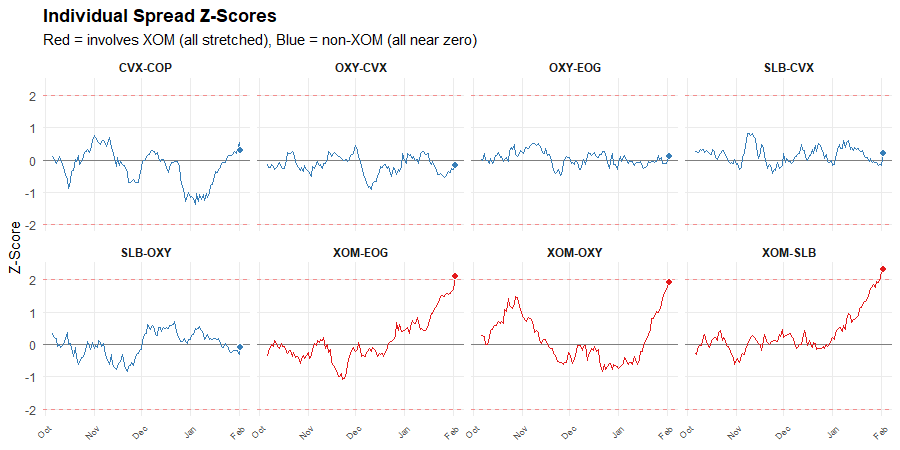
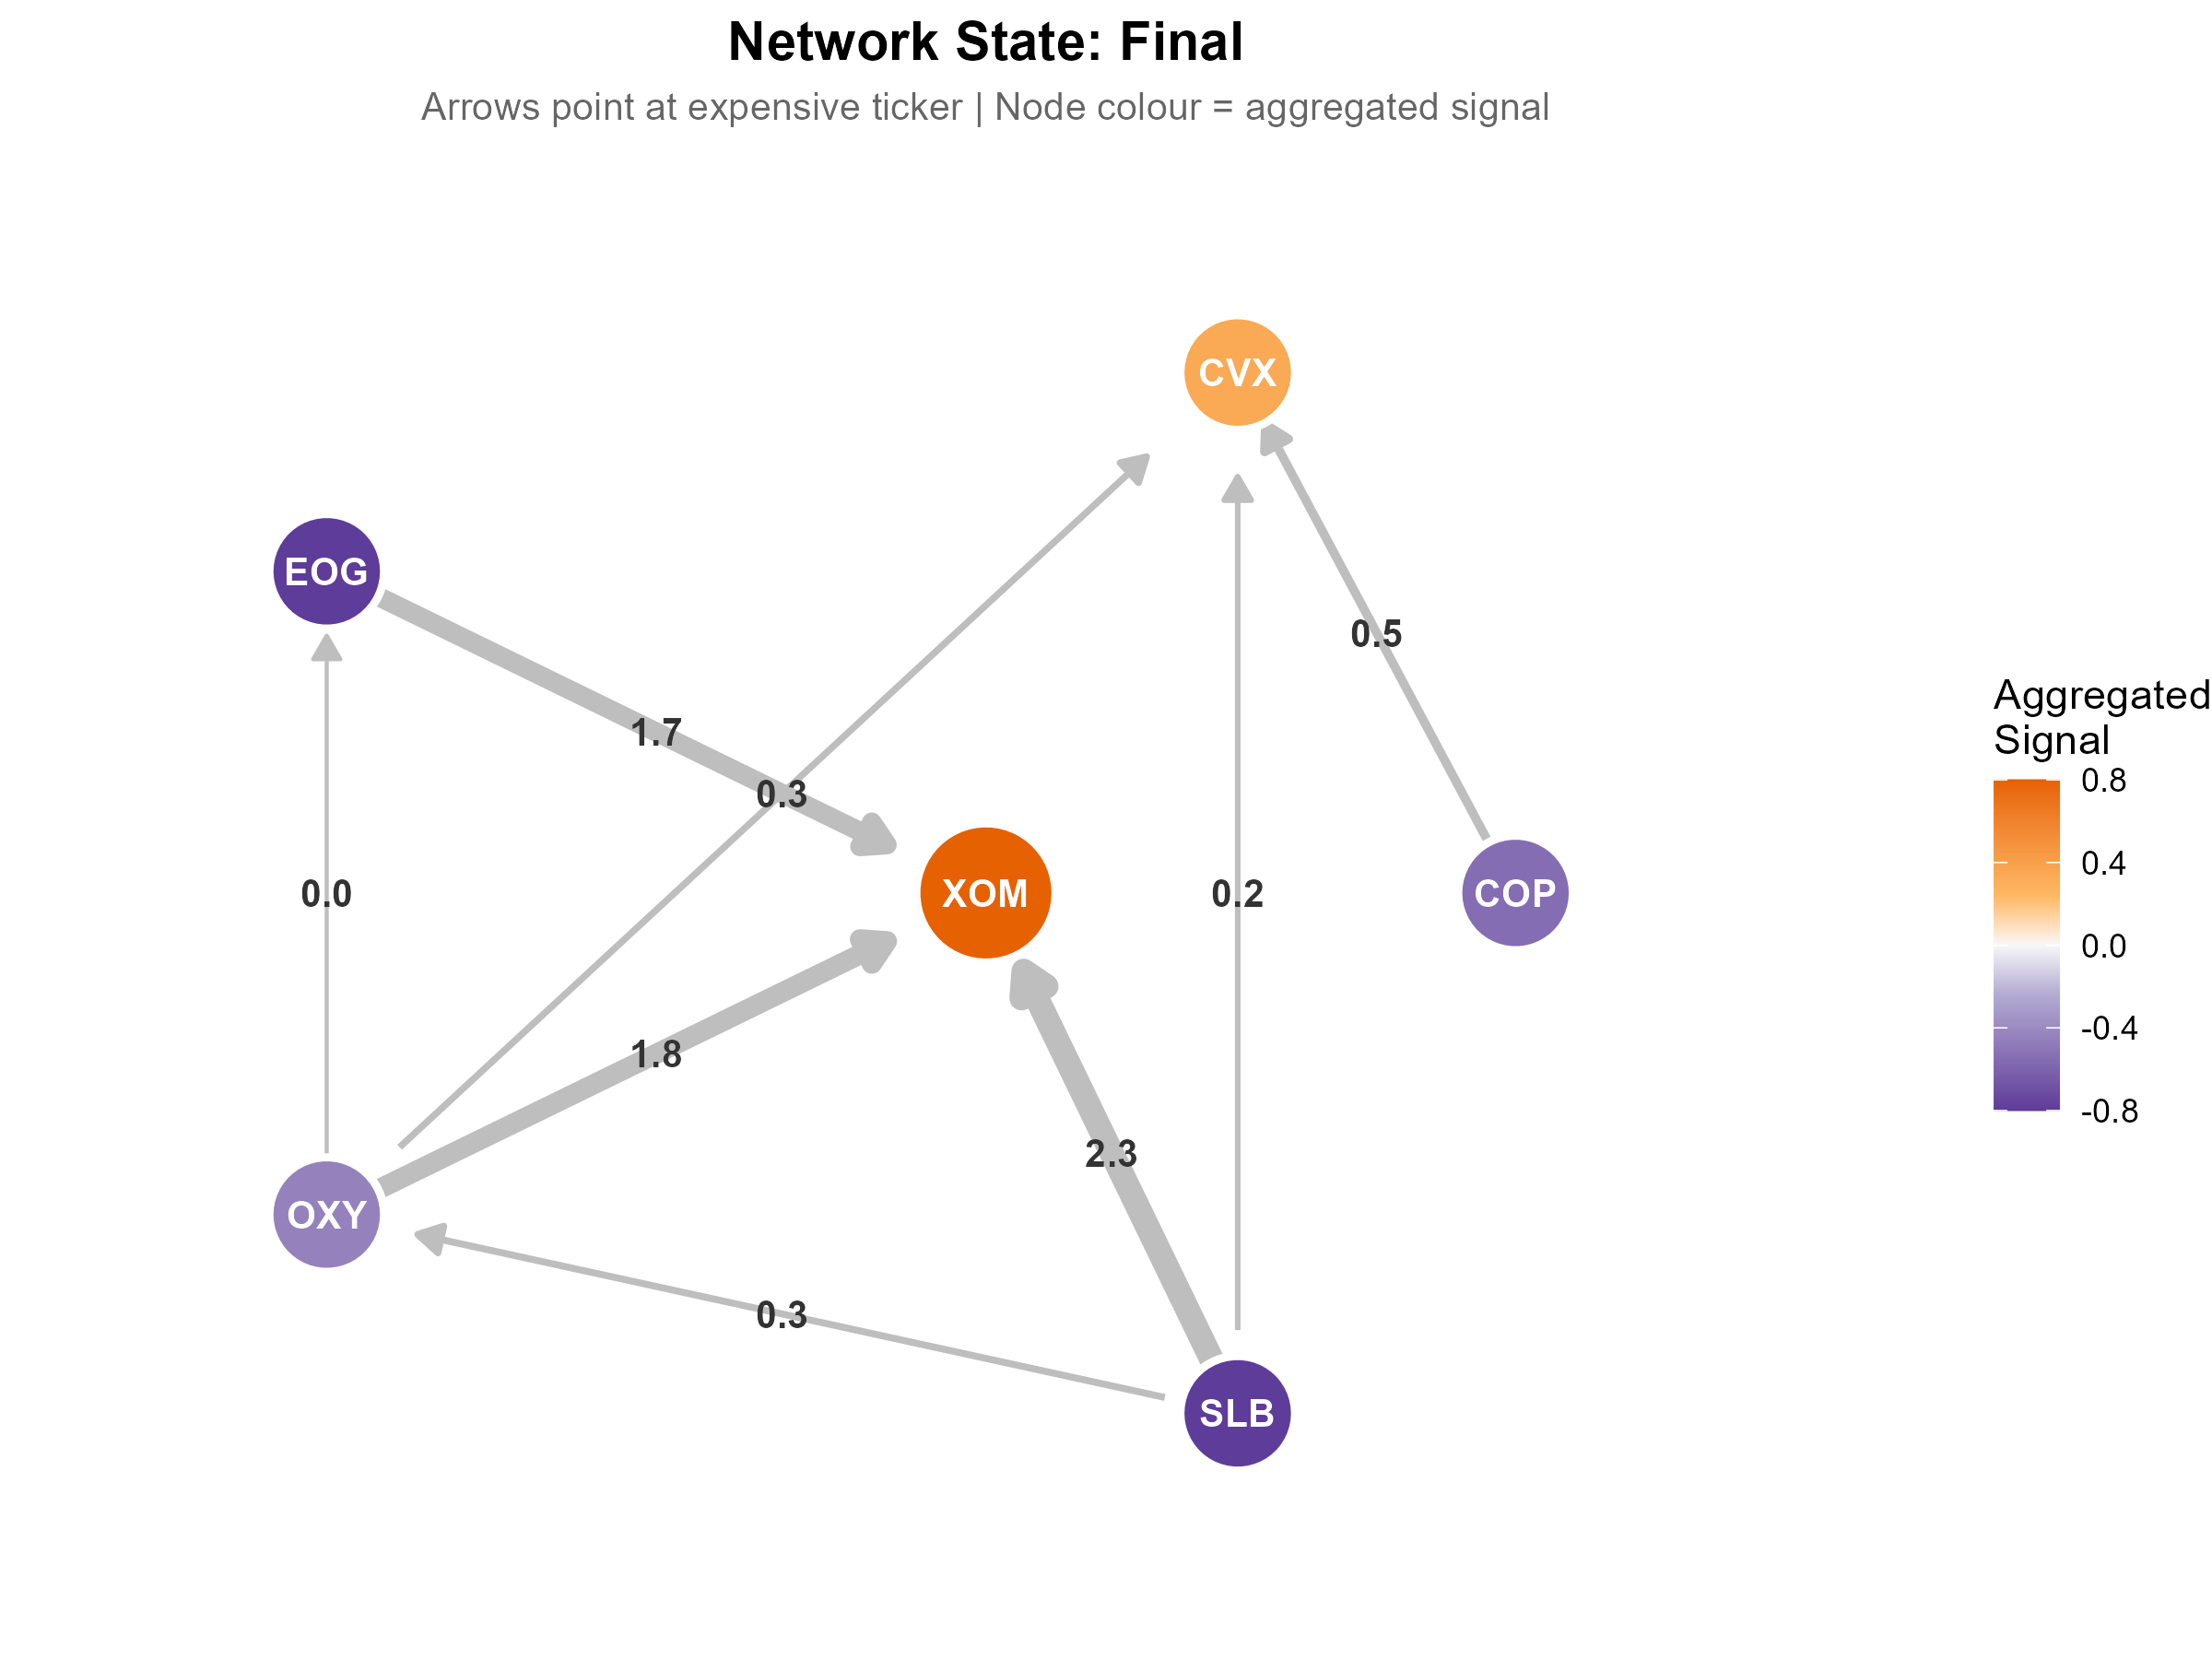
The previous segment of this series presented a compelling visual analysis of energy stock spreads, where ExxonMobil (XOM) appeared as a clear outlier. Every spread involving XOM showed a significant deviation, while spreads between other energy stocks remained relatively stable. While intuitively suggesting XOM as the mispriced entity, this "obvious" conclusion warrants a more rigorous examination. The triangulated approach aims to move beyond such single-point observations to a more holistic understanding of market relationships.
The Triangulation Analogy: From Bearings to a Fix
The term "Triangulated Stat Arb" draws a direct parallel to the navigational technique of triangulation. In navigation, a single bearing on a landmark provides a line of direction; two bearings establish a potential location; and three or more bearings, all converging on the same point, provide a definitive "fix."
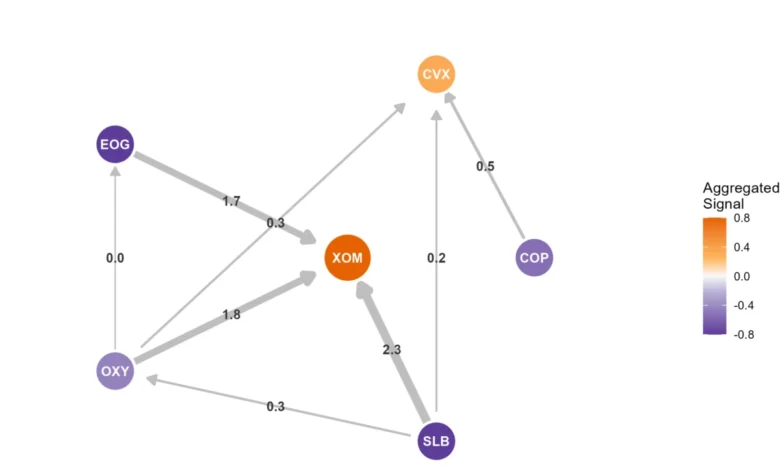
In the context of statistical arbitrage, each individual spread acts as a "bearing" or a "vote" from the market. A single spread might suggest, "Ticker A appears overvalued relative to Ticker B." This information is valuable but inherently limited. It’s difficult to ascertain whether Ticker A has indeed become expensive, or if Ticker B has simply become cheaper. When multiple spreads consistently cast votes in the same direction, a clearer picture emerges. For instance, if three separate spreads all indicate that XOM is expensive relative to its peers, the conviction behind this signal increases.
However, the analogy’s power in trading lies in its nuance. While triangulation in navigation yields a precise geographical point, in trading, a "fix" derived from overlapping spreads points to a cluster of potential mispricings. It doesn’t definitively reveal the underlying cause or guarantee the outcome. Yet, this refined insight is immensely powerful. It shifts the focus from a vague "something is mispriced in this pair" to a more actionable "this specific asset appears mispriced relative to its network of peers." This is a critical step in developing more robust trading strategies.
Moving Beyond Outliers: Portfolio Construction
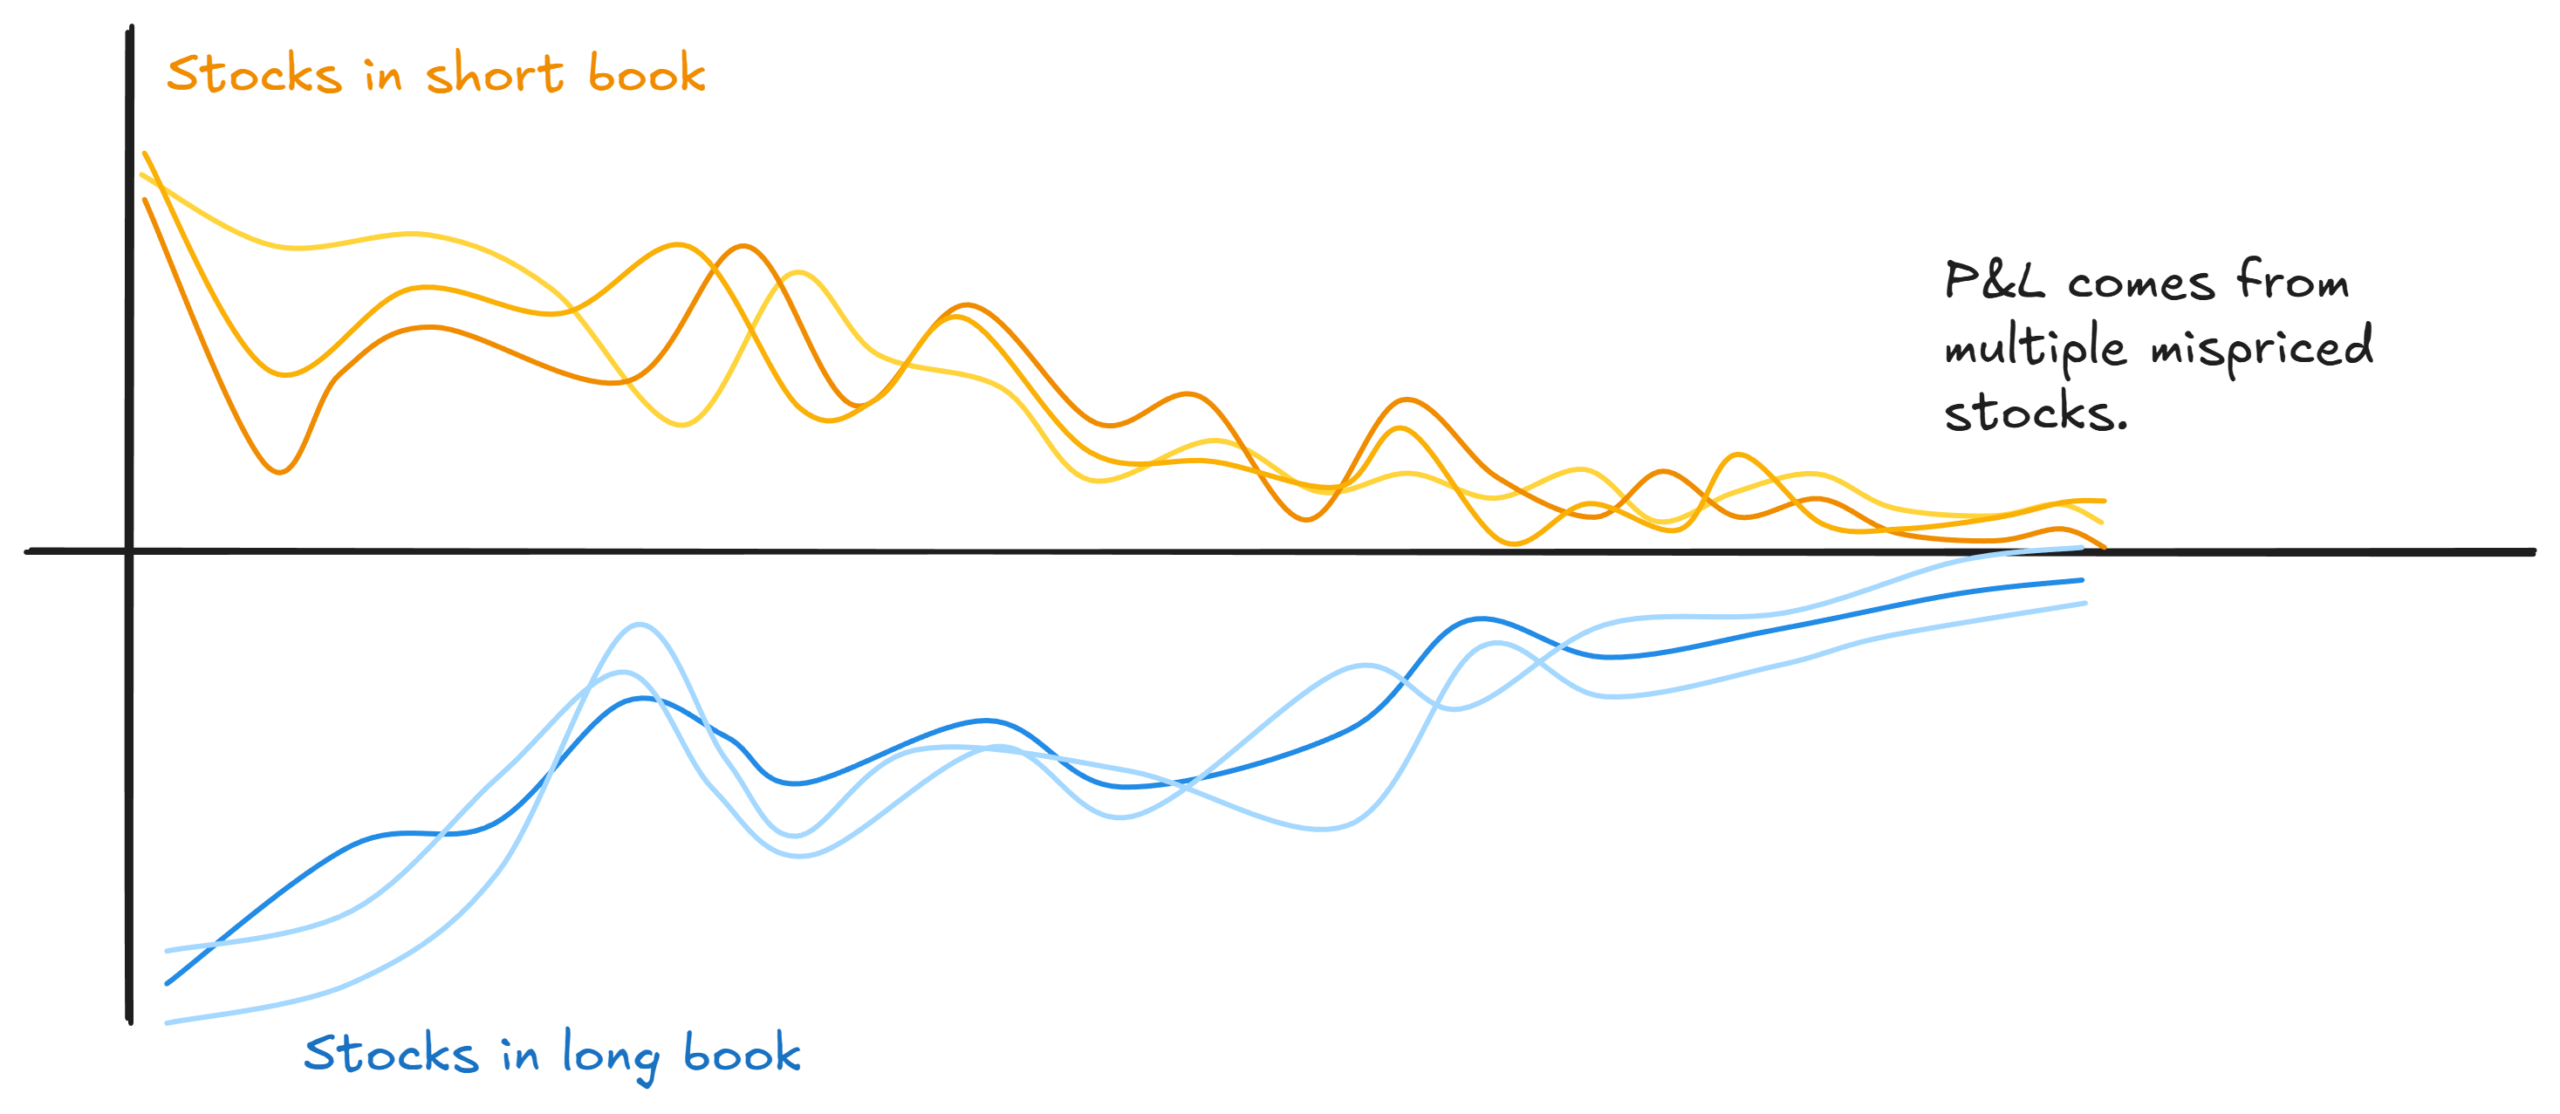
The XOM example, while illustrative, involves a small, contained network. The true power of triangulated statistical arbitrage is unleashed when applied to larger, more complex market universes. Imagine a network comprising 40, 60, or even 100 stocks, interconnected by a multitude of overlapping spreads. Applying the triangulation methodology across such an extensive network transcends the identification of a single outlier. Instead, it generates a diversified "portfolio of potentially mispriced legs."
This approach constructs a long/short book where every position is driven by a conviction based on the network’s consensus. The "long book" comprises assets that the network identifies as cheap relative to their peers, while the "short book" contains assets deemed rich. Unlike traditional pairs trading, where many positions might serve merely as hedges without independent conviction, every leg in a triangulated portfolio is intentionally chosen to target an apparent mispricing. This inherent diversification and targeted approach can lead to improved risk-adjusted returns.
The Power of Aggregation: Flattening as a Foundation
A surprising and significant insight in this methodology is the substantial benefit derived simply from the "flattening" step, which aggregates signals across multiple spreads. The act of combining these votes inherently tends to build a portfolio of genuinely mispriced assets. Assets that are truly mispriced will consistently appear as such across numerous relationships, effectively canceling out random noise. This process naturally leads to a portfolio that is long assets identified as cheap across multiple correlations and short assets identified as rich.
This fundamental reframing—treating spreads as evidence rather than direct trading instruments—provides a substantial uplift. It leverages the law of large numbers, allowing the signal to emerge more clearly from the noise. However, it’s crucial to reiterate the caveat: not every observed dislocation represents a true mispricing. Some tickers might have moved due to genuine news events, leading to a fundamental repricing rather than a temporary, price-insensitive flow.
While the base rate—the higher frequency of price-insensitive flows compared to genuine repricings in well-selected pairs—favors this approach, it’s not infallible. The triangulated method allows for further refinement to improve upon this base rate.
Quantifying Network Conviction: The Role of Consistency
When signals from multiple spreads are aggregated, each ticker accumulates a series of "votes," some indicating "rich" and others "cheap." The degree of agreement among these votes provides valuable information about the reliability of the signal. This is where the concept of "consistency" becomes paramount.
Consistency is a straightforward metric: it’s the absolute value of the mean of the signs of the individual spread signals. Each signal is converted to a +1 (rich) or -1 (cheap) value. Averaging these values and taking the absolute result quantifies how consistently the network points in a particular direction for a given ticker.
This metric strongly penalizes disagreements. For example, a ticker receiving one "rich" signal and one "cheap" signal will have a consistency of zero. Conversely, a ticker with three "rich" signals and zero "cheap" signals will have a consistency of +1. While not a perfect metric—a ticker appearing in only two spreads will always have a consistency of zero or one—it offers a simple yet effective way to weight the flattened signals, thereby extracting more information.
High consistency indicates a clear consensus within the network about a ticker’s relative valuation. Low consistency suggests conflicting information, often pointing towards noise rather than a robust signal. By discounting tickers with low consistency, traders can focus on those where the network’s agreement is strong. This is particularly important because a ticker with a strong average signal but low consistency might simply be the counterpart to another asset that has genuinely moved. Conversely, a moderate average signal coupled with high consistency implies that all participating spreads agree, providing a cleaner, more reliable signal. Empirical testing has demonstrated that consistency-weighted signals often outperform simple averages.
The "Why": Distinguishing Mispricing from Repricing
While triangulation effectively identifies what the network perceives as mispriced, it doesn’t inherently explain why. This is the critical juncture where the strategy must differentiate between a genuine mispricing due to temporary, price-insensitive flows and a fundamental repricing driven by new information.
Consider the XOM example again. The network signals that XOM is an outlier. The question remains: did XOM’s price deviate due to transient factors like fund rebalancing or hedging activity, which are expected to revert? Or did it experience a fundamental repricing due to an earnings surprise, production update, or regulatory shift specific to the company?
In the former scenario, the dislocation presents a trading opportunity. In the latter, XOM might not be mispriced at all; the network is merely highlighting a stock that has adjusted to new realities. Both scenarios can appear identical in terms of statistical metrics like z-scores. Triangulation provides the "what," but not the "why."
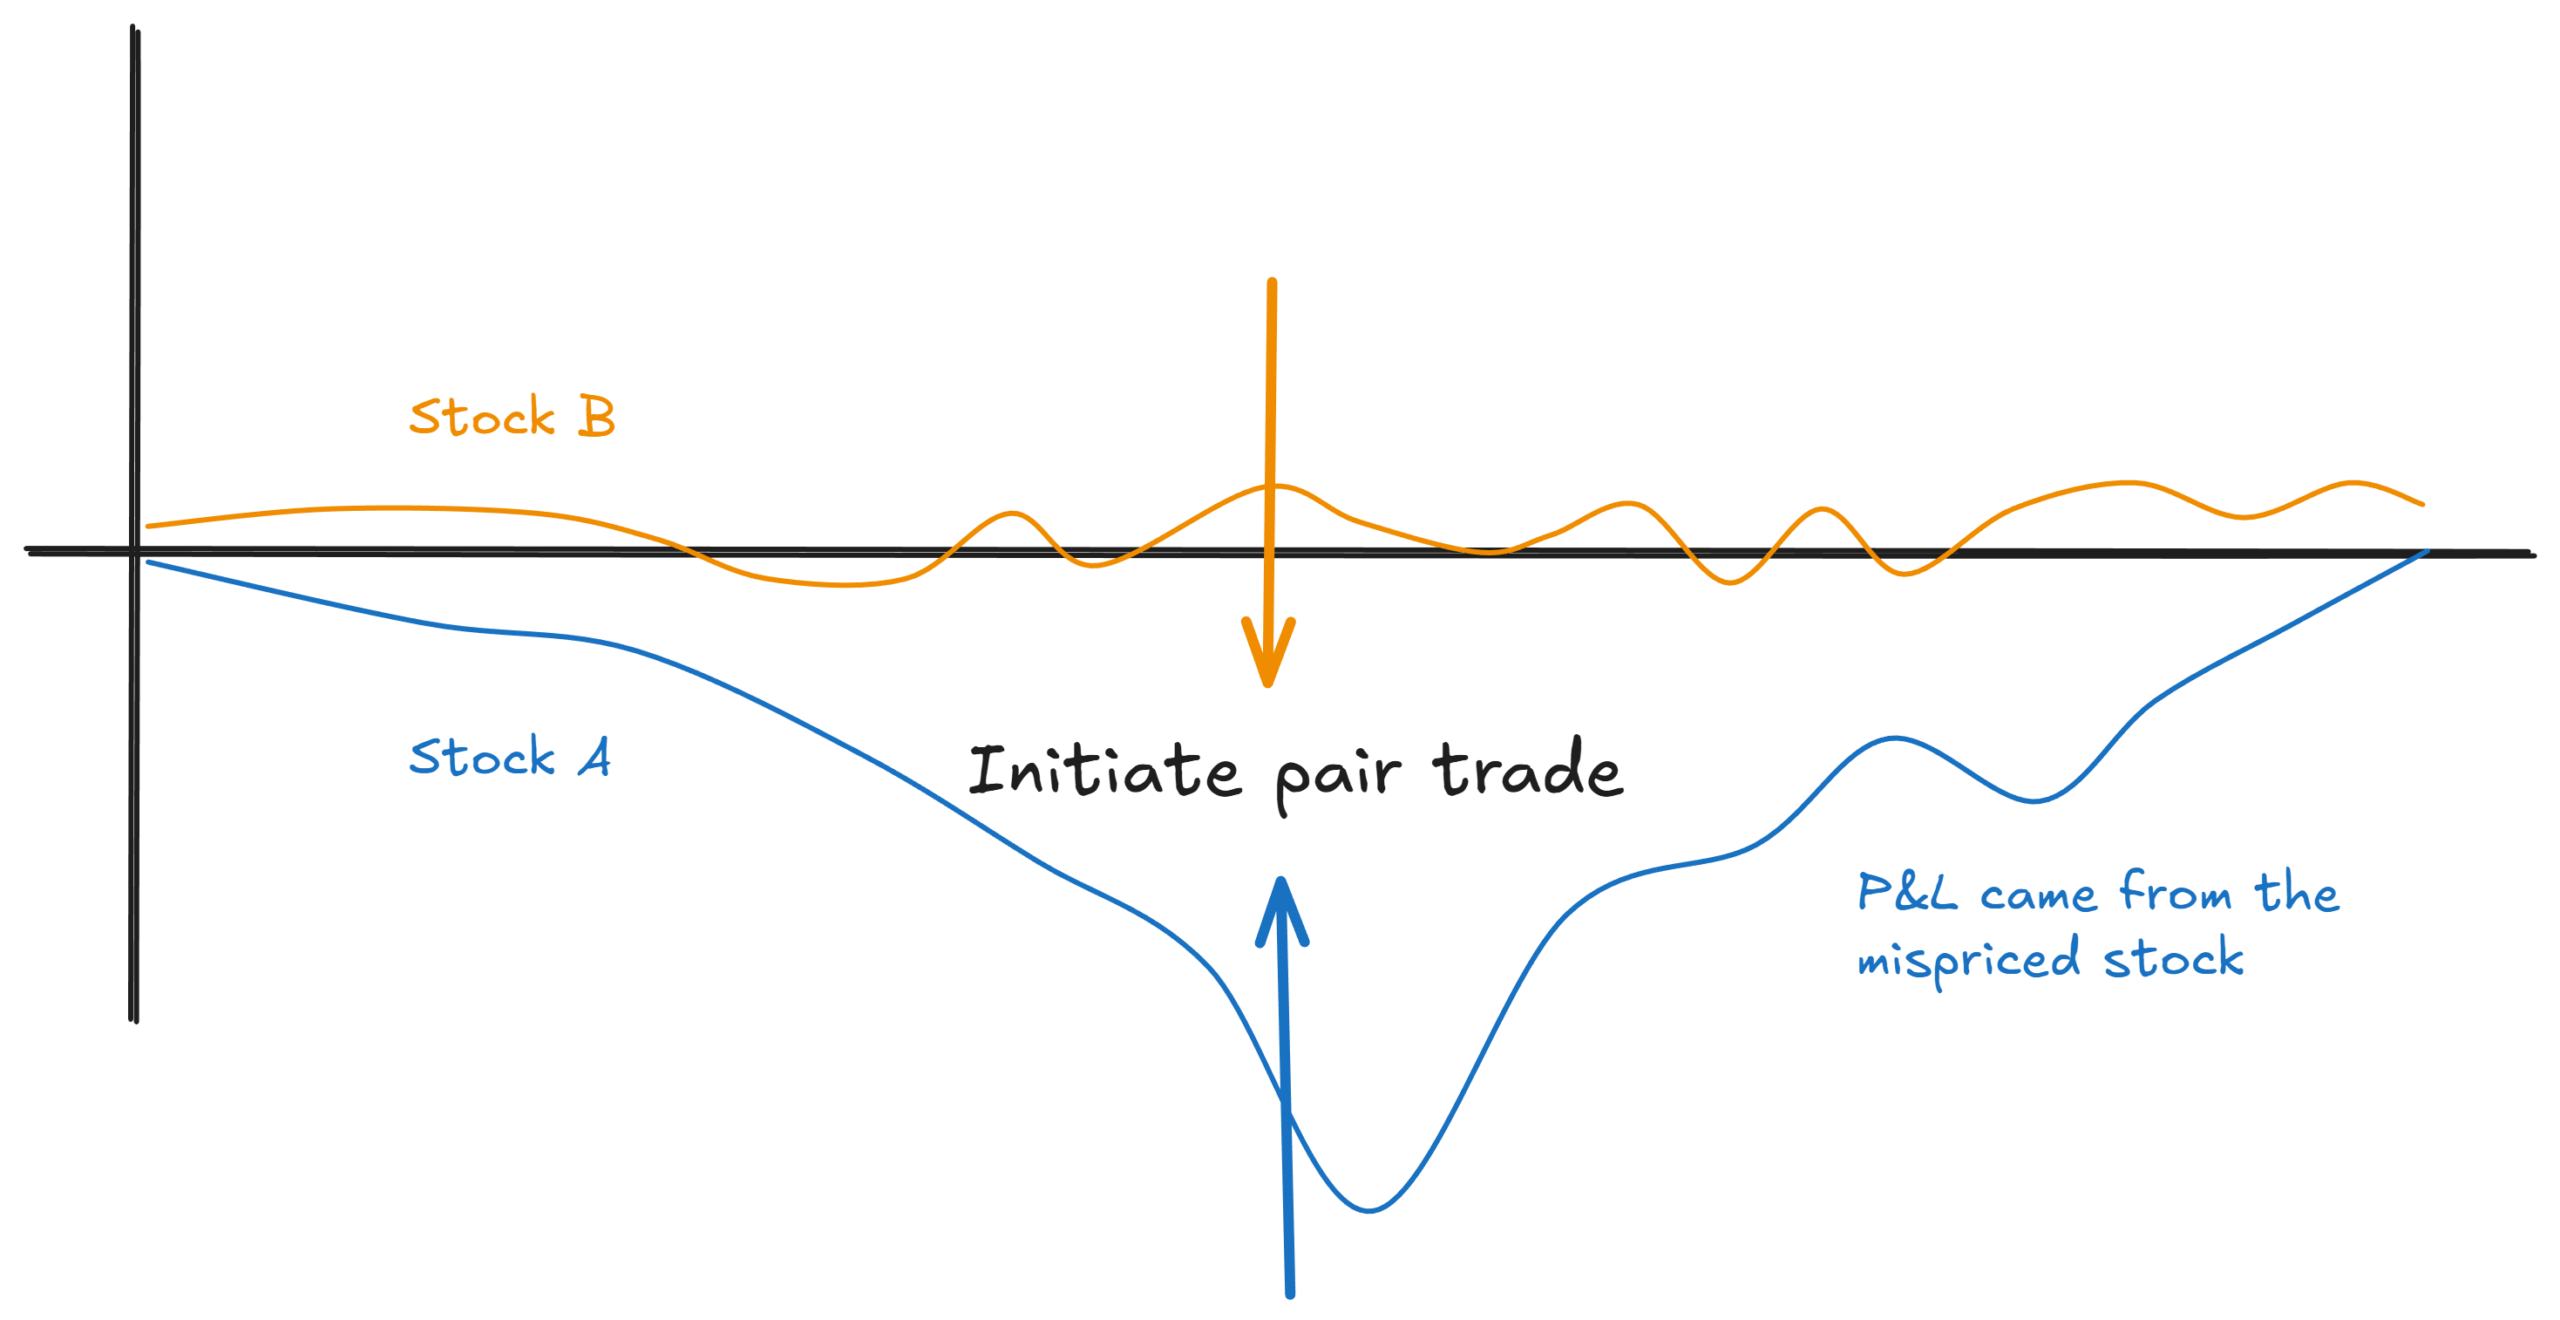
While selecting robust pairs that tend to diverge and converge predictably can lean the odds in favor of price-insensitive flows, mitigating the impact of genuine repricings can further enhance performance. This involves looking beyond spread relationships to other market indicators.
Advanced Signal Enhancement: Volume and News Analytics
The next frontier in refining triangulated statistical arbitrage involves incorporating external data to differentiate between mispricing and repricing. Indicators such as volume patterns surrounding a price dislocation and idiosyncratic news events can offer crucial clues. The way a stock trades—its volume profile, the speed and magnitude of its price movement—can differ significantly when it’s being pushed by non-fundamental flows versus when it’s reacting to substantive information.
Analyzing these patterns can help traders sidestep situations where a spread diverges but fails to converge, a common frustration in pairs trading. While not foolproof, integrating these external features can lead to a noticeable improvement in trading outcomes. This level of sophistication is often explored in professional trading groups, where these features are built into live implementations.
Mathematical Refinement: Regression and Factor Models
The mathematical underpinnings of triangulated statistical arbitrage can be further refined through regression analysis. Each spread’s z-score can be interpreted as the difference in ticker mispricings, or "alphas":
$z_AB = alpha_A – alphaB$
$zAC = alpha_A – alphaC$
$zBC = alpha_B – alpha_C$
Here, the observed spread z-scores ($z$) are used to infer the underlying ticker alphas ($alpha$). By running a regression analysis across the network of spreads, traders can derive ticker alphas that best explain these observed relationships simultaneously. This process generates a "regression factor."
Traditional ordinary least squares (OLS) regression minimizes the sum of squared alphas, which can lead to the signal being diffused across many tickers. More advanced regression techniques, such as lasso (which forces coefficients to zero) or ridge regression (which shrinks coefficients towards zero), can be employed to concentrate the signal in a more parsimonious set of tickers. This leads to the development of factors like a "ridge regression factor," which can provide a more focused and potentially robust signal.
Empirical Performance: Comparing Network-Derived Factors
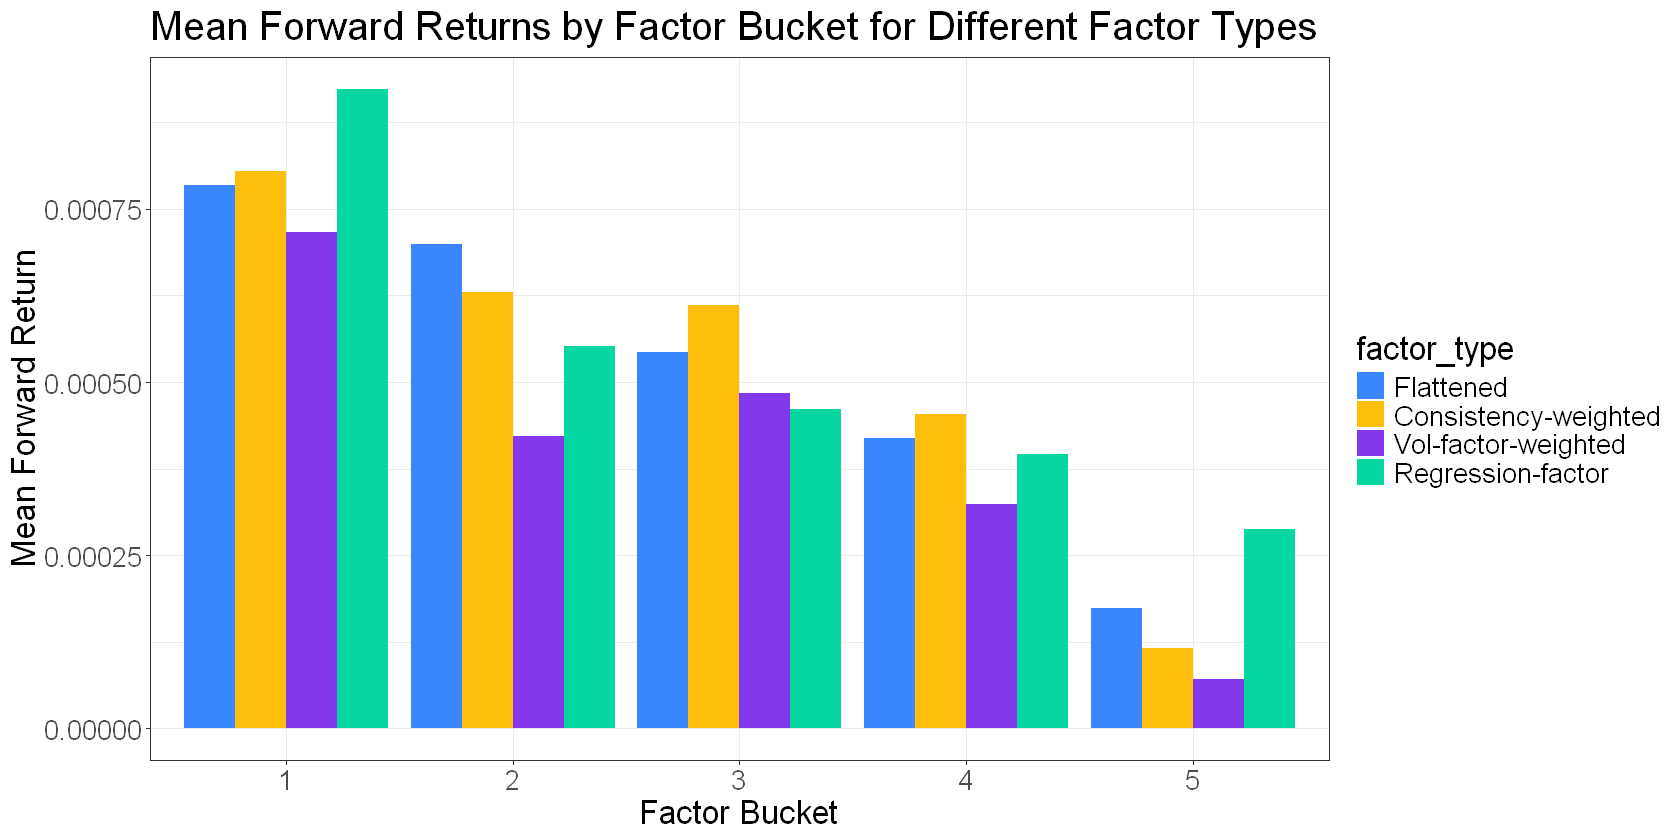
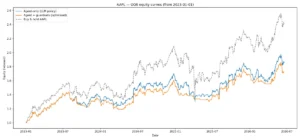
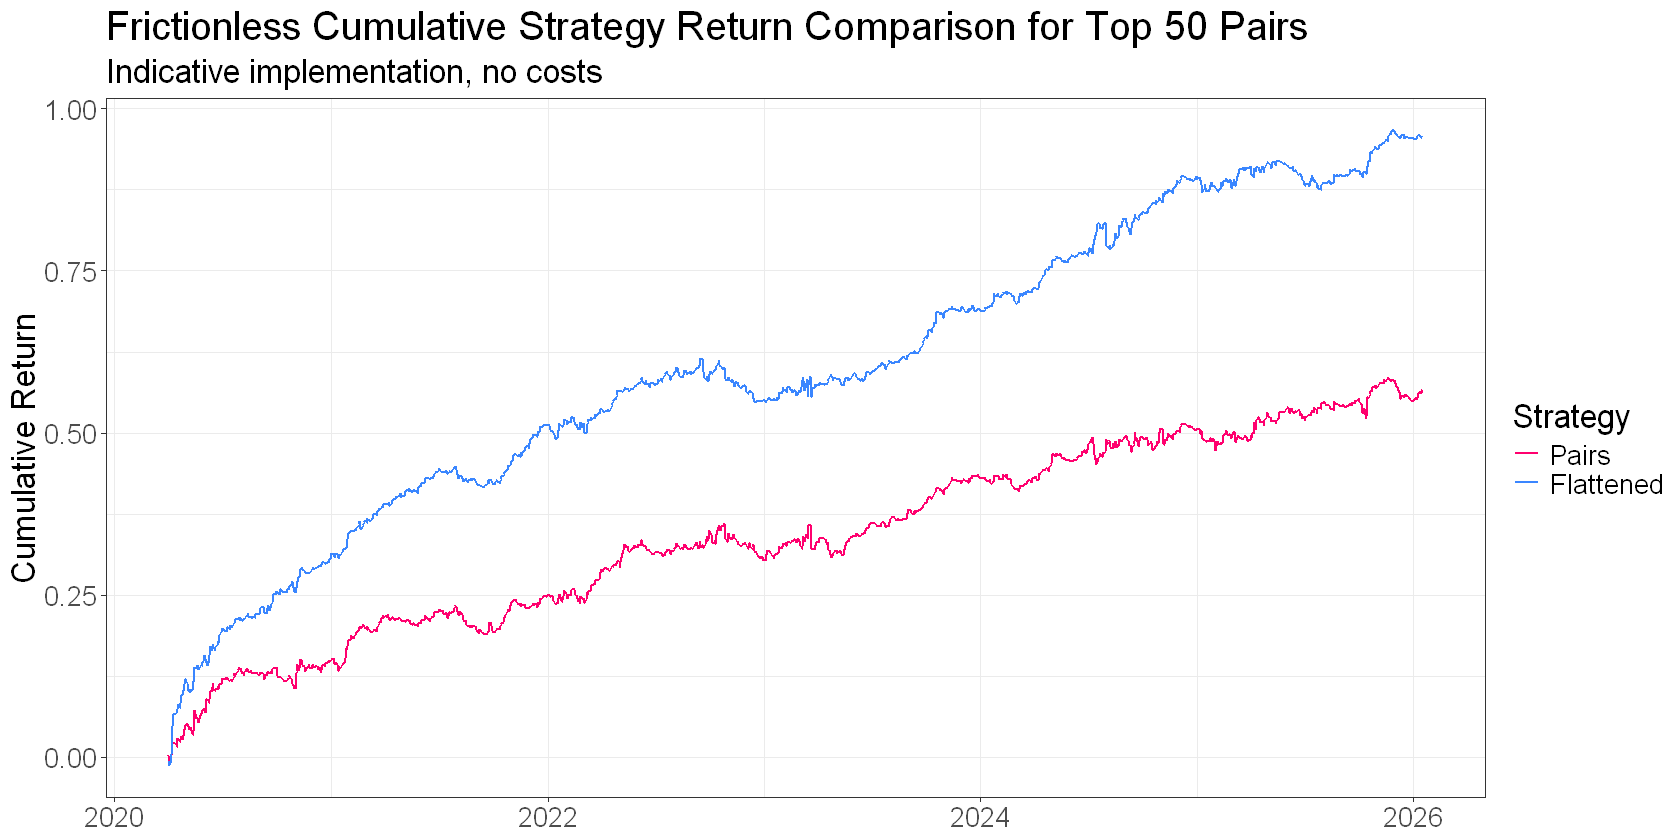
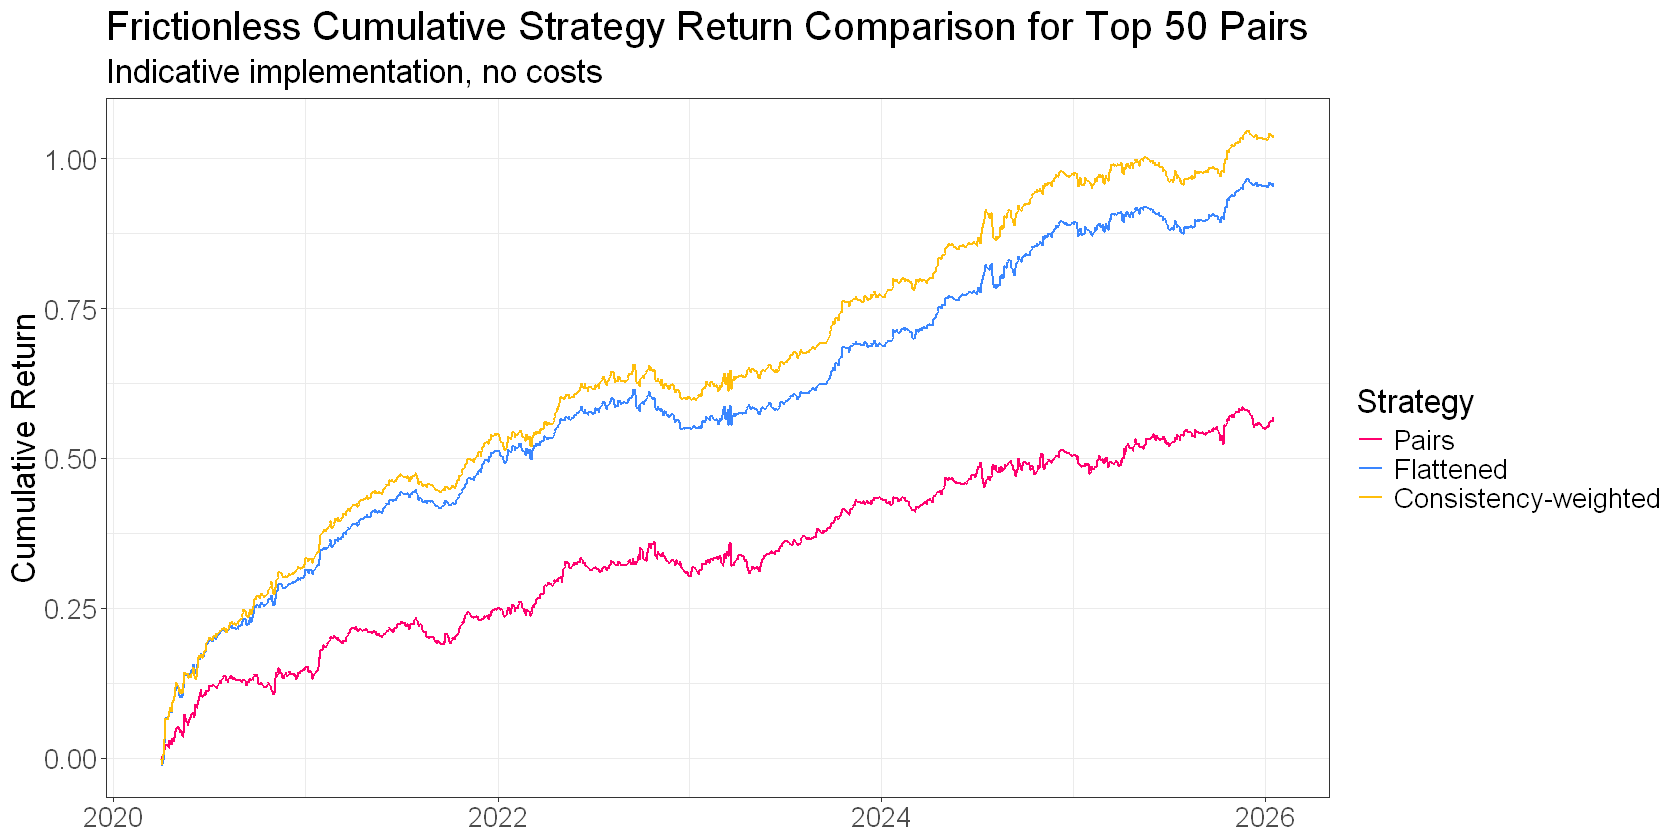
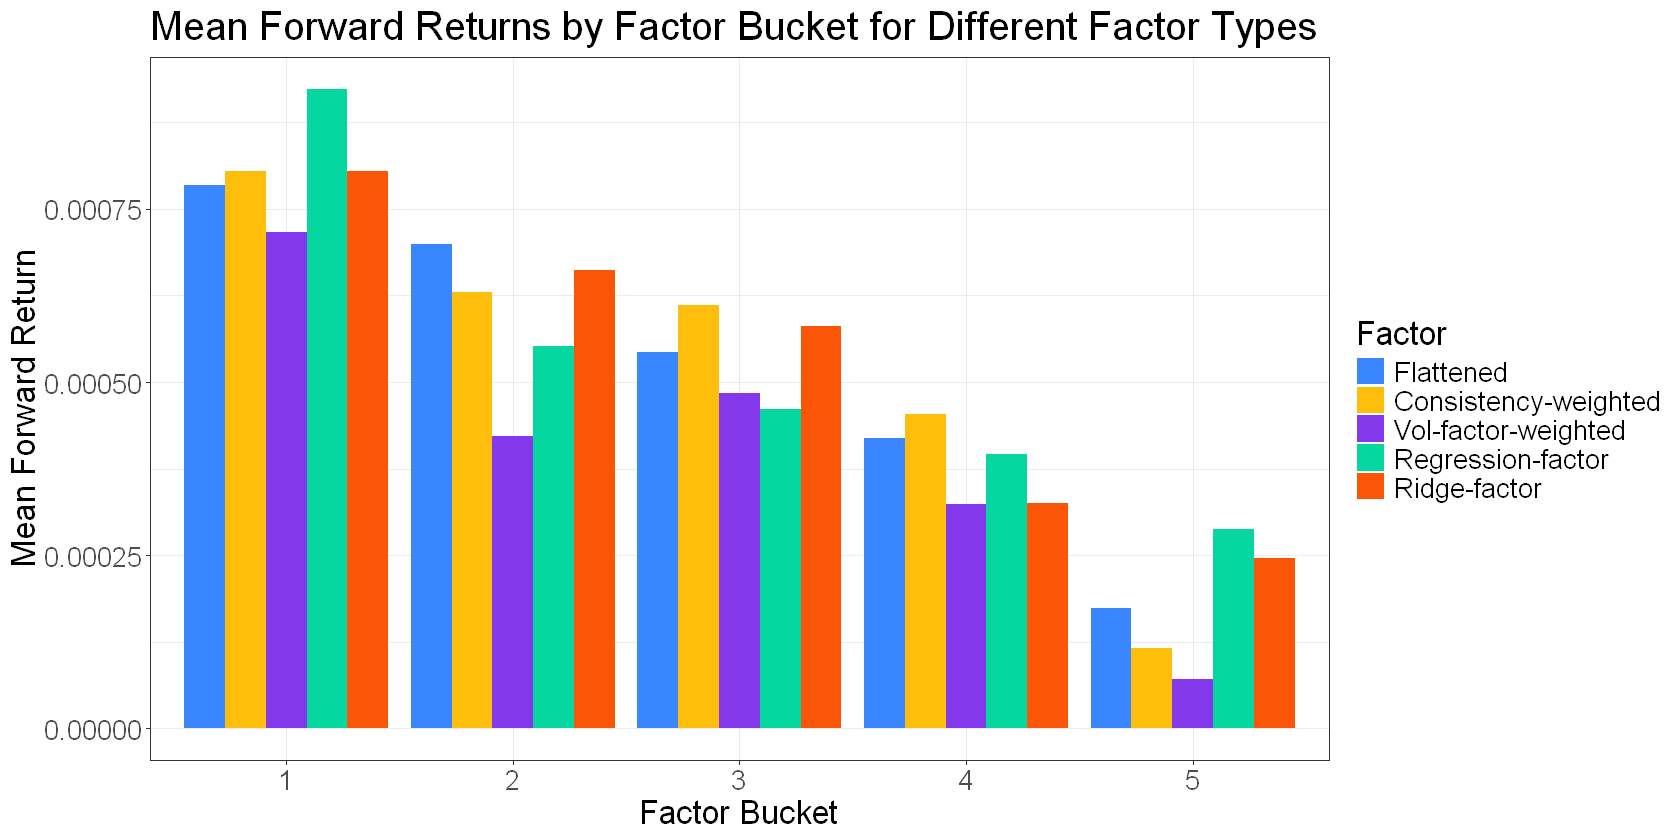
A comparison of the cumulative returns of various network-derived factors, including simple averages, consistency-weighted signals, regression factors, and ridge regression factors, on a rolling universe of the top 50 pairs, reveals distinct performance characteristics. While a direct comparison without accounting for trading costs and frictions is preliminary, it offers a high-level view of the potential benefits.
These factors exhibit different trade-offs. Some may lead to higher turnover, while others might decay faster or result in more concentrated positions if not managed carefully. The interplay between the quality of the underlying spreads and the chosen factor model adds another layer of complexity and potential for optimization.
The primary takeaway from this comparative analysis is the significant step change achieved by moving from traditional pairs trading to a triangulated statistical arbitrage approach, both in terms of performance and complexity. The shift from a pair-centric view to a portfolio-centric view, where spreads are aggregated and flattened, yields the most substantial gains. Subsequent refinements, while valuable, often offer incremental improvements over this foundational transformation.
The Three Pillars of Triangulated Statistical Arbitrage
In summary, the journey into sophisticated statistical arbitrage can be broken down into three critical pillars:
-
Finding Good Pairs: This foundational step involves identifying spreads that exhibit a propensity to diverge and converge in a tradeable manner. This selection pipeline, as discussed in earlier parts of the series, is paramount. Without robust pairs, all subsequent analysis becomes irrelevant.
-
Identifying Mispriced Legs: This is the core of triangulated statistical arbitrage. It involves flattening spread signals to derive ticker-level insights, using consistency to gauge network agreement, and constructing a portfolio where each position targets an apparent mispricing. This transition from pairs to a portfolio offers a significant boost in performance and capital efficiency, albeit with increased complexity.
-
Separating Mispricing from Repricing: This advanced stage aims to predict when an apparent mispricing is actually a fundamental repricing. Incorporating features like volume data and news analytics can help avoid traps. While challenging, successfully distinguishing these scenarios can lead to another significant performance enhancement. Trading a portfolio of apparent mispricings is a viable strategy if pair selection is sound; however, avoiding genuine repricings further refines the edge.
Each pillar contributes to the overall success of the strategy, but with varying degrees of impact. Good pairs form the bedrock. Triangulation and consistency extract more value from these pairs than traditional methods. Volume and news features act as crucial filters to avoid pitfalls.
Achieving mastery across all three pillars is what truly elevates this approach. It involves navigating numerous moving parts and understanding subtle nuances that become apparent only through practical trading. The subsequent installment of this series will explore what it looks like when these three pillars are resourced and executed comprehensively.