Building Robust Financial Data Infrastructure for Systematic Trading and Quantitative Research

In the contemporary financial landscape, the architecture of data management has emerged as the defining factor for success in algorithmic trading. While the allure of complex machine learning models and high-frequency signal generation often dominates industry discourse, the efficacy of these systems is fundamentally capped by the quality and accessibility of the underlying data infrastructure. As quantitative research moves toward increasingly granular and expansive datasets, the transition from manual, spreadsheet-based data handling to automated, API-driven ingestion is no longer a technical preference; it is a structural necessity for firms aiming to maintain a competitive edge.
The evolution of financial data access has followed a distinct trajectory over the past two decades. In the early 2000s, quantitative research was largely siloed, relying on proprietary data feeds or labor-intensive manual data collection. The emergence of standardized Financial Data APIs—such as those provided by Financial Modeling Prep (FMP)—has democratized access to institutional-grade datasets. This shift has allowed smaller research teams and individual developers to build pipelines that mirror the complexity of those found in hedge funds and proprietary trading firms.
The Anatomy of Data Failure in Systematic Workflows
Systematic trading relies on the assumption that historical patterns can provide a statistical edge. However, this assumption collapses if the data inputs are compromised. Data infrastructure serves as the "gating function" of any quantitative pipeline. When a researcher ingests data that is inconsistent, misaligned, or plagued by survivorship bias, the errors cascade through the entire research lifecycle.
Common points of failure include "lookahead bias," where a model inadvertently uses future information that would not have been available at the time of a trade, and "mismatched time-series alignment," where financial statement release dates do not properly align with price history. These discrepancies often lead to "overfitting," where a strategy appears highly profitable in a backtest but fails to perform in live markets because the model learned to exploit data artifacts rather than genuine market phenomena.
From Manual Ingestion to Programmatic Scalability
The traditional approach to data acquisition—downloading CSV files from various web portals—is inherently brittle. Manual workflows introduce human error, lack auditability, and create significant bottlenecks as the research universe expands. For instance, if a researcher is tracking the fundamental growth of 500 equities in the S&P 500, a manual update process is unsustainable.
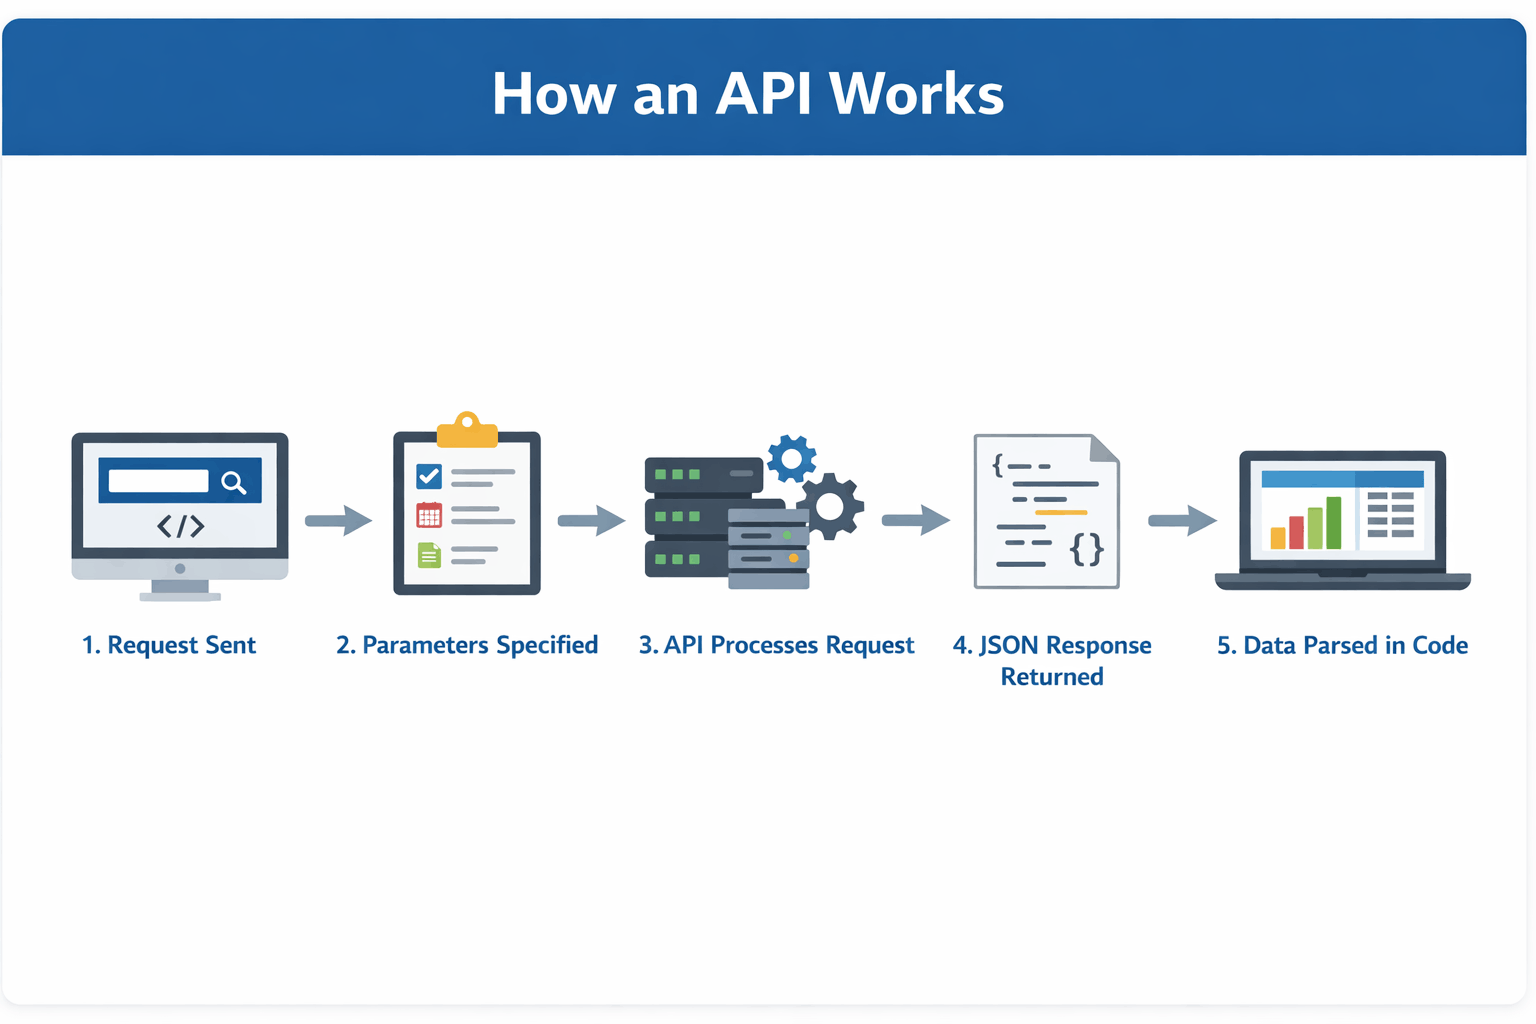
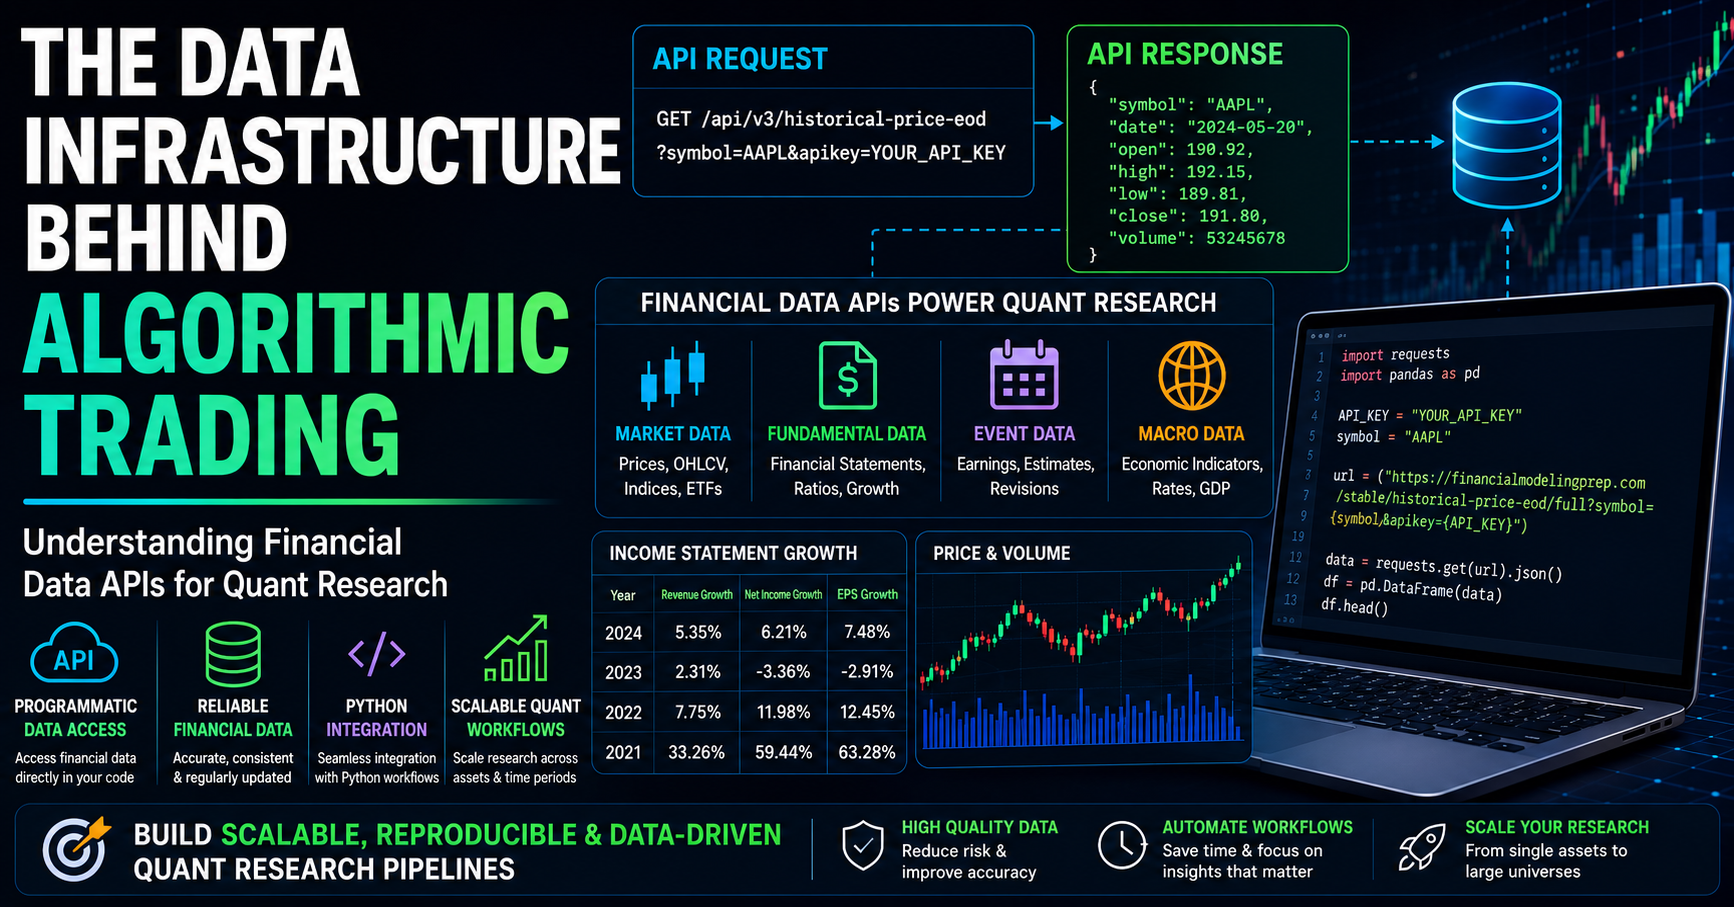
Conversely, an API-based architecture automates the retrieval of market data, fundamental metrics, and macroeconomic indicators directly into a Python-based research environment. By integrating calls to data providers like FMP directly into a workflow, researchers can ensure that their datasets are standardized. This programmatic approach allows for:
- Reproducibility: Every data pull can be logged, allowing researchers to re-run simulations with identical inputs months or years later.
- Version Control: By treating data as code, teams can track changes to datasets over time, preventing the "stale data" problem that often plagues legacy research environments.
- Automated Error Handling: APIs provide consistent schemas, meaning that once a script is built to handle an incoming JSON response, it can process thousands of tickers without human intervention.
The Hierarchy of Financial Data
To construct a high-performance quantitative pipeline, one must categorize data based on its function within the model. Financial datasets are generally divided into three distinct pillars:
- Market Data: This includes price action, volume, and intraday ticks. This is the "high-frequency" layer, essential for testing execution logic and identifying short-term volatility patterns.
- Fundamental Data: This comprises the income statement, balance sheet, and cash flow data. These metrics provide the "value" context, allowing researchers to assess the underlying business health of the securities being traded.
- Event and Macro Data: This category covers earnings release calendars, analyst estimates, and broad economic indicators like interest rates or GDP growth. This data is critical for "event-driven" strategies that look to capture alpha during periods of heightened market activity.
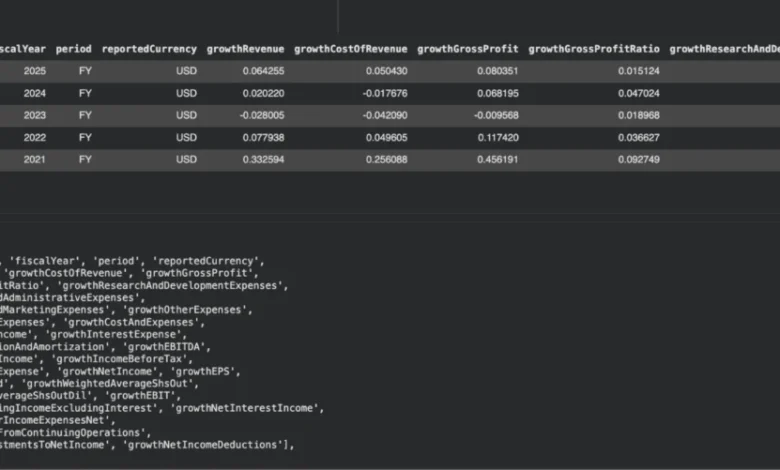
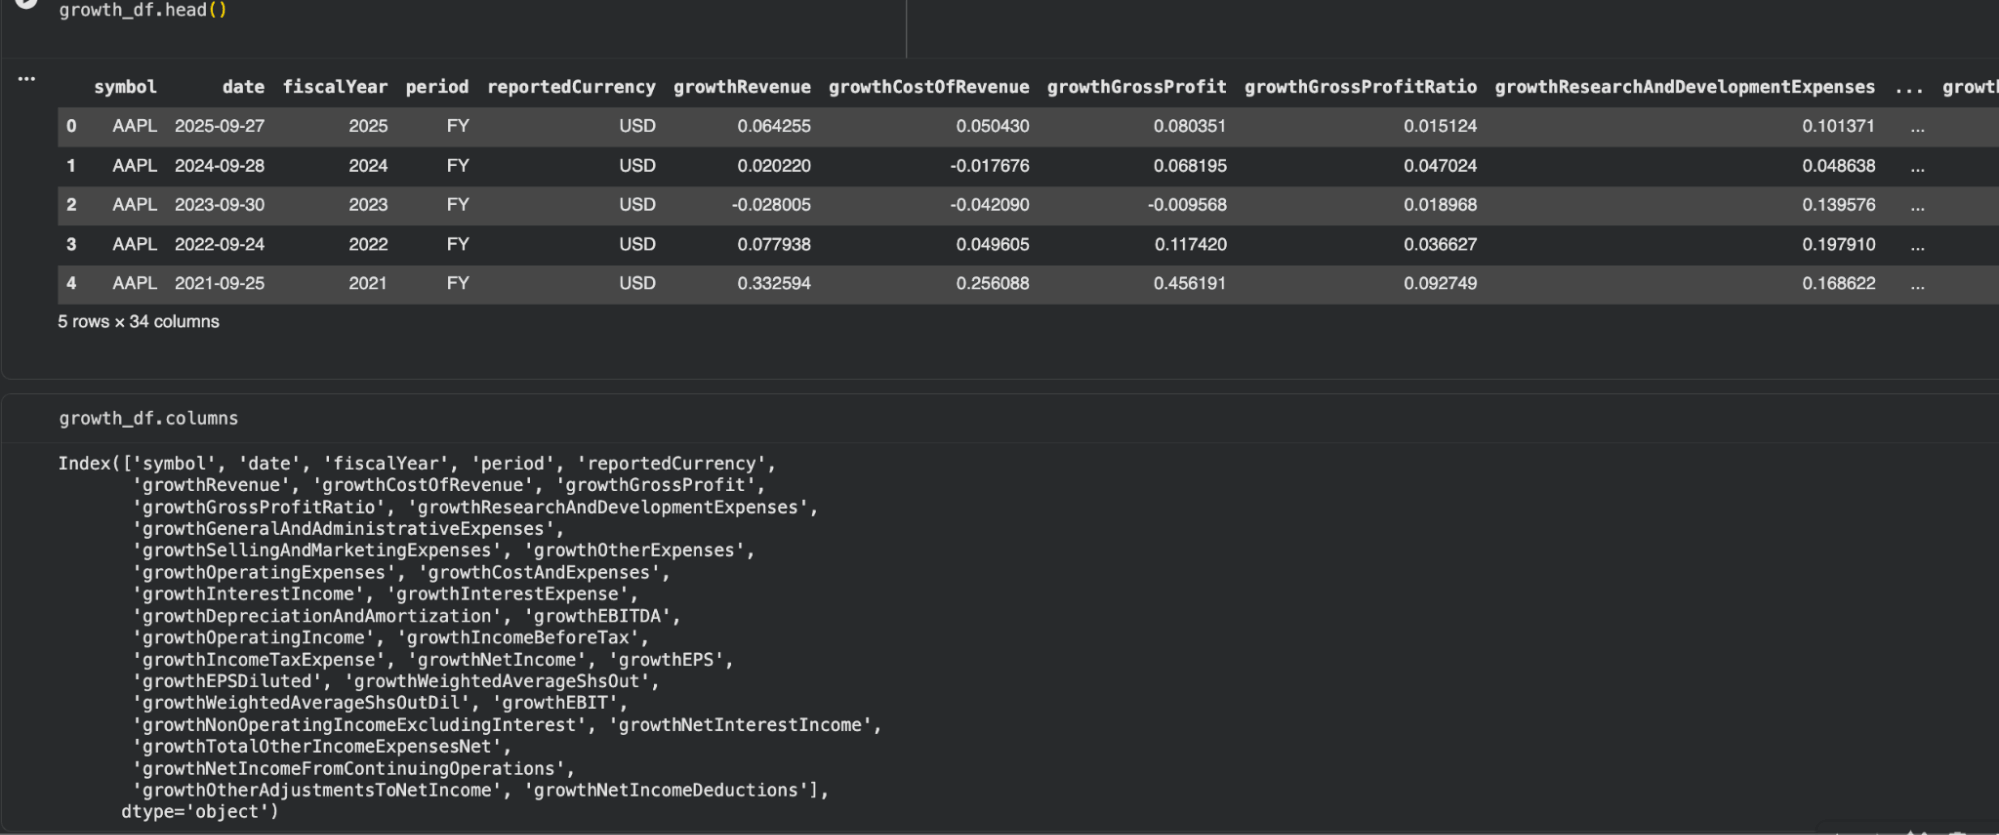
The true power of modern data infrastructure lies in the ability to merge these three pillars. By aligning fundamental growth metrics—such as year-over-year revenue increases—with short-term volatility measures from the price dataset, a researcher can test whether improved company performance leads to a decrease in price instability.
Implementation: A Technical Case Study in Pipeline Construction
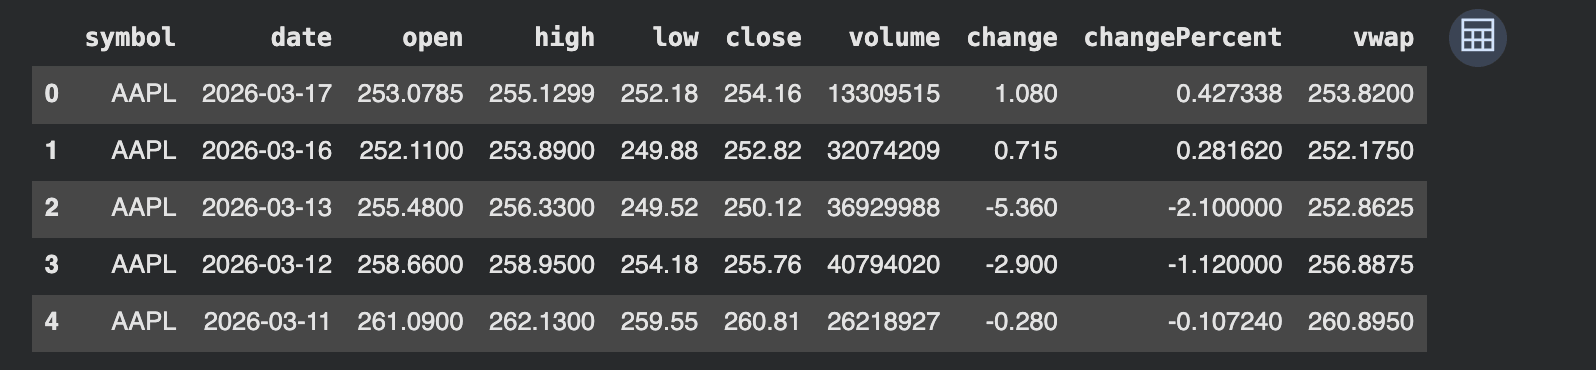
Consider a scenario where a researcher seeks to test the relationship between revenue growth and price performance. Using Python and an API, the researcher first retrieves historical EOD (End-of-Day) price data. The process involves sending a secure GET request to an API endpoint, receiving the payload in JSON format, and normalizing it into a Pandas DataFrame.
import requests
import pandas as pd

API_KEY = "YOUR_API_KEY"
symbol = "AAPL"
url = f"https://financialmodelingprep.com/stable/historical-price-eod/full?symbol=symbol&apikey=API_KEY"

response = requests.get(url)
data = response.json()
prices = pd.DataFrame(data['historical'])
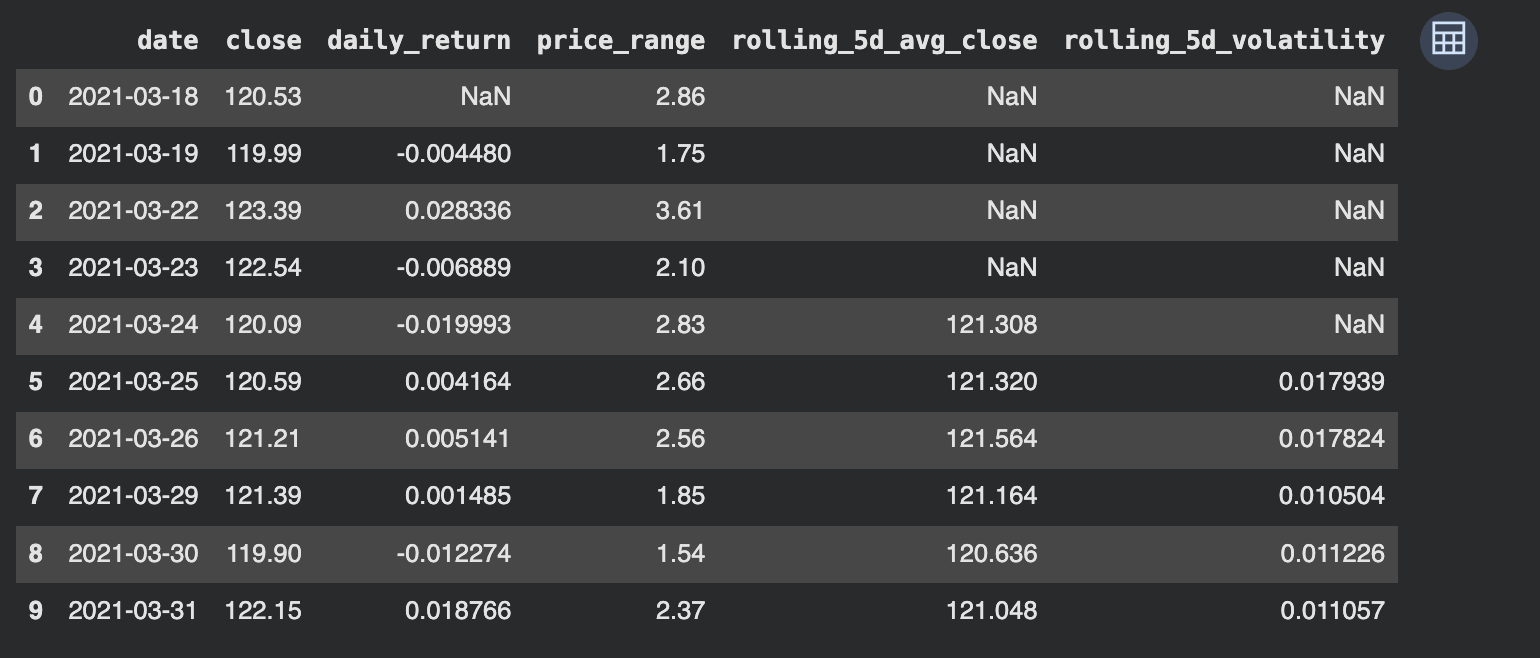
Once the price data is ingested, the researcher performs feature engineering. This involves calculating rolling statistics, such as 5-day volatility or moving averages. The key to success at this stage is the alignment of fundamental and price data. Because fundamental data is typically released on a quarterly or annual basis, it must be "forward-filled" to align with daily price observations, ensuring that the model does not assume a fundamental shift occurred before the official filing date.
The Institutional Perspective on Data Standards
The industry has moved toward rigorous standards to address the chaos of fragmented data. Organizations like the Financial Information Services Division (FISD) have worked to establish global standards for market data. The adoption of these standards by API providers reflects a maturing market where participants prioritize interoperability.
For firms, the cost of "bad data" is not merely the time spent cleaning it; it is the opportunity cost of missed trades and the financial loss of deploying capital based on flawed signals. Consequently, the selection of a data provider is now a high-level strategic decision. Factors such as latency, the depth of historical coverage, and the integrity of the data schema are weighed as heavily as the cost of the subscription.
Broader Implications for the Future of Quant Finance
As artificial intelligence and large language models (LLMs) begin to play a larger role in financial analysis, the demand for structured data will only increase. LLMs require vast amounts of clean, labeled data to perform sentiment analysis on earnings calls or to summarize complex regulatory filings. A robust data infrastructure acts as the "feed" for these advanced systems.
Furthermore, the democratization of data through APIs has lowered the barrier to entry for independent quantitative researchers. What was once the exclusive domain of large investment banks is now accessible to individual developers. This has fostered a more vibrant, albeit more competitive, trading ecosystem.
Conclusion: Data as the Competitive Advantage
The shift toward API-centric research pipelines represents a permanent change in how financial analysis is conducted. By automating the ingestion and transformation of market and fundamental data, researchers can focus their efforts on hypothesis generation and strategy refinement rather than data janitorial work.
In the final analysis, the difference between a successful systematic strategy and a failed one often comes down to the reliability of the underlying data. As markets continue to evolve in complexity and speed, those who invest in building a scalable, consistent, and rigorous data infrastructure will remain at the forefront of quantitative innovation. The ability to trust one’s data is the bedrock upon which all successful algorithmic trading is built. As the industry continues to integrate, the role of reliable, API-delivered financial information will only become more central to the mechanisms of global capital markets.