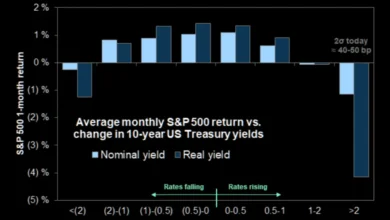
The financial world is currently grappling with a counterintuitive market phenomenon that has left veteran fixed-income traders and macroeconomic strategists searching for answers. Economic textbook theory dictates that when inflation prints come in hotter than anticipated, energy commodities surge, and producer price indexes accelerate well past consensus forecasts, bond yields should climb as investors demand higher compensation for the eroding purchasing power of future cash flows. Yet, defying conventional financial logic, U.S. Treasury yields have experienced a significant downward trajectory even as adverse inflation data flashed across trading terminals worldwide.
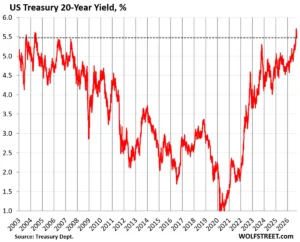
To understand the magnitude of this divergence, one must look back to the opening days of October. Entering the month, the benchmark 10-year U.S. Treasury yield was hovering near 5.25%. Standard market intuition, backed by decades of historical correlation, suggested that an unexpected surge in the Consumer Price Index (CPI) alongside a sharp 1.3% monthly jump in the Producer Price Index (PPI)—surpassing the forecasted 0.5%—would act as an immediate catalyst driving the 10-year yield toward 5.50% or higher. Compounding these inflationary pressures, crude oil prices had climbed by $10 per barrel during the first fortnight of the month alone, driven largely by geopolitical friction involving Iran and persistent supply constraints.
However, reality diverged sharply from conventional expectations. On October 14th, following the release of the hotter-than-expected CPI report, the 10-year Treasury yield did experience a momentary knee-jerk spike, touching 5.33% within minutes of publication. But this upward momentum proved fleeting. Just days later, the yield reversed course aggressively, tumbling down to 5.03%. The 30-year Treasury bond mirrored this movement, registering a substantial decline of its own. In essence, the bond market staged a powerful and definitive rally straight into the teeth of profoundly negative inflation data, prompting market participants to question the underlying mechanics driving global fixed-income flows.
Chronology of the October Market Divergence
The timeline of October 2026 highlights the growing disconnect between incoming hard economic data and fixed-income pricing behavior.

On October 1, the 10-year Treasury yield stood firm at approximately 5.25%, with the broader macroeconomic consensus anticipating further monetary tightening if price pressures failed to abate. Throughout the first week of the month, energy markets signaled ongoing strain as crude oil climbed steadily, while preliminary private-sector data hinted at sticky underlying inflation.
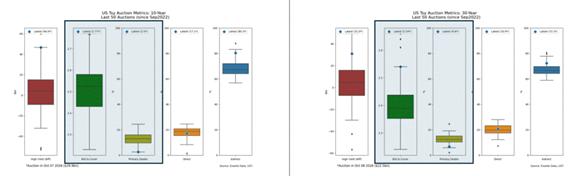
The pressure points intensified on October 7th and 8th, coinciding with critical U.S. Treasury debt auctions for the 10-year note and 30-year bond. Wall Street analysts had widely predicted a tepid reception from primary dealers and institutional buyers given the prevailing high-yield environment and ongoing fiscal deficit concerns. Instead, the auctions revealed extraordinary structural demand. The $39 billion 10-year note auction cleared at a high yield of 5.300%, stopping 1.7 basis points through the when-issued level. The bid-to-cover ratio reached an exceptional 2.77, comfortably outstripping the 12-month average of 2.51 and sitting higher than any of the preceding 50 auctions. Similarly, the $22.5 billion 30-year bond auction recorded a bid-to-cover ratio of 2.54, well above the historical median of 2.40.
Crucially, participation statistics from these auctions underscored a massive shift in institutional appetite. Primary dealers—the Wall Street institutions obligated to absorb unsold debt—were left taking a mere 2.5% of the 10-year issuance, marking a record low. Conversely, indirect bidders, comprised largely of foreign central banks and domestic institutional investors, absorbed an overwhelming 80.3% of the 10-year supply and 72.3% of the 30-year supply.
This robust reception set the stage for the dramatic events of October 14th. When the September CPI data printed above expectations and the PPI surged by 1.3%, the initial spike in yields to 5.33% was swiftly met by waves of buying. By mid-October, the 10-year yield had plummeted to 5.03%, accompanied by a notable flattening of the 2-year to 10-year yield curve, which compressed from 57 basis points down to 32 basis points in a matter of weeks.
El-Erian and Industry Reactions
The baffling behavior of the bond market immediately drew commentary from elite financial minds. Mohamed El-Erian, former CEO of PIMCO and a globally recognized authority on fixed-income markets, took to social media to highlight the anomaly, explicitly asking why U.S. government bond yields were falling despite hotter-than-expected CPI and PPI prints.
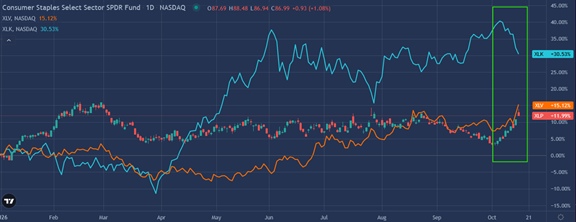
El-Erian outlined multiple rationalizations for the market’s behavior, pointing first to a broader capital rotation. He noted a noticeable flight to quality out of formerly high-flying technology equities that were beginning to face fundamental pressure. Concurrently, El-Erian highlighted emerging pockets of credit stress within the most vulnerable segments of the corporate debt market. As an illustrative example, yields on debt issued by CoreWeave, a prominent data center and cloud infrastructure provider, spiked from 9% to 15%. This sharp repricing in tech-adjacent credit markets rattled investors, sparking fears that CoreWeave and its competitors might represent the proverbial canary in the coal mine for the broader artificial intelligence capital expenditure boom.
Charu Chanana, a strategist at Saxo, reinforced this sentiment, observing that global investors are displaying a diminishing willingness to finance AI infrastructure growth at any cost. With 10-year sovereign yields hovering above 5% and risk premiums on AI-related corporate debt widening to junk-bond territory, the cost of capital for data center construction has risen exponentially. Because AI capital expenditure has served as a primary engine of macroeconomic growth over recent years, any deceleration in this spending threatens to cool overall GDP growth. Lower expected economic expansion naturally argues for subdued long-term inflation trajectories, thereby justifying lower long-term bond yields.
Short Covering and Market Positioning
Beyond the structural shifts identified by El-Erian, technical positioning played a monumental role in amplifying the bond market rally. Prior to the October inflation releases, institutional asset managers and hedge funds were heavily skewed toward a bearish stance on fixed income.
Data published by the Commodity Futures Trading Commission (CFTC) revealed that asset managers added more than 100,000 contracts to their short 10-year Treasury futures exposure during the final week of September alone—representing one of the largest weekly increases in short positioning since 2023. Bloomberg tracking data further confirmed that open interest in 10-year futures rose across 13 of 14 trading sessions through late September, with similar accumulation occurring in 5-year futures contracts.
When the Treasury auctions on October 7th and 8th demonstrated profound underlying demand at yields exceeding 5%, these aggressively positioned short sellers were suddenly put on notice. The robust participation of real-money buyers absorbing supply without requiring dealer intervention meant that the expected market indigestion failed to materialize. As yields began to edge downward from their intraday highs, a classic short squeeze ensued. The forced unwinding of crowded short positions created a self-reinforcing feedback loop, driving bond prices higher and yields progressively lower regardless of incoming inflationary data points.

The Risk of a Federal Reserve Policy Mistake
While flight-to-quality dynamics, AI spending slowdowns, and technical short covering offer significant explanatory power, a growing faction of macro analysts argues that a deeper fear is gripping the fixed-income market: the increasing probability of a Federal Reserve policy error.
The rapid flattening of the 2-year to 10-year yield curve—shifting 25 basis points lower in two weeks predominantly during inflation data releases—illustrates a market anticipating that the central bank may be backing itself into a corner. When long-term yields fall at a faster pace than short-term yields, it constitutes a bull flattener. This configuration typically signals that market participants expect the central bank to maintain restrictive policy or tighten further into a softening economic environment, thereby impairing future growth and forcing a subsequent monetary policy reversal.
A careful examination of the broader macroeconomic landscape underscores why market participants are growing anxious regarding potential over-tightening by the Fed:
-
The Nature of the Inflation Shock: The recent acceleration in price pressures is predominantly driven by supply-side dynamics rather than excess domestic demand. Surging gasoline and diesel prices stem directly from geopolitical conflict involving Iran. Monetary policy instruments are entirely blunt tools when applied to commodity supply shocks; while the Federal Reserve cannot manufacture barrels of oil, its rate hikes can successfully depress demand across every other sector of the economy.
-
A Cooling Labor Market: Underlying labor market indicators continue to show signs of structural softening. September nonfarm payrolls advanced by a meager 29,000 jobs, while historical figures for previous months were subject to downward revisions totaling 60,000 positions. Furthermore, the national unemployment rate edged higher to 4.2%, and real wage growth remained essentially flat to slightly negative, providing little evidence of a self-sustaining wage-price spiral.
-
Consumer Strain: Although headline retail sales figures recently beat consensus estimates with a 0.8% increase, a deeper dive into the composition reveals that surging gasoline expenditures accounted for the vast majority of the gain. The Control Group retail sales metric—utilized directly by the Bureau of Economic Analysis in GDP calculations—rose by a nominal 0.1%. Higher energy costs are actively crowding out discretionary consumer spending across retail and service sectors.
-
Restrictive Policy Stance: By the Federal Open Market Committee’s own mathematical framework, monetary policy is already firmly in restrictive territory. Following successive adjustments, the federal funds rate range sits at 3.75% to 4.00%, comfortably above the central bank’s internal estimates for the longer-run neutral rate, which is pegged at approximately 3.20%. Updated economic projections and dot-plot distributions continue to leave the door open for additional tightening measures.
-
Tightening Financial Conditions: The broader financial ecosystem is already doing the heavy lifting for monetary authorities. With the 10-year yield above 5%, 30-year residential mortgage rates hovering near 7.50%, the U.S. dollar trading near multi-month highs, and corporate credit spreads widening, financial conditions have tightened significantly. Imposing additional federal funds rate hikes risks pushing an already fragile economic expansion over the precipice.
Contrasting Perspectives and the Hawk’s Defense
To maintain analytical objectivity, it is necessary to acknowledge the rationale underpinning the Federal Reserve’s hawkish wing. Proponents of further monetary tightening emphasize that the latest CPI report demonstrated broad-based price increases diffusing across a wide array of goods and services. Core Personal Consumption Expenditures (PCE) inflation continues to run near 3%, remaining stubbornly above the central bank’s official 2% target. Most critically, inflation has exceeded the Fed’s mandated threshold for more than five consecutive years, elevating the risk that long-term consumer and business inflation expectations could become unanchored from central bank credibility.
However, market participants trading the long end of the curve are not merely voting on historical inflation prints or current headline numbers. Instead, the fixed-income market is attempting to price the terminal trajectory of inflation alongside the systemic economic side effects of aggressive central bank intervention. The primary concern is that the Federal Reserve’s aggressive medicine may succeed in curing the nominal inflation reading only by inducing an avoidable economic recession.

Broader Implications for Global Markets
The current behavior of the U.S. Treasury market serves as a critical stress test for global macroeconomic forecasting. The coexistence of hot inflation prints and falling bond yields demonstrates that financial markets are looking past immediate monthly data volatility to price in structural shifts, liquidity dynamics, and policy risk.
As central bankers weigh their next policy steps against a backdrop of slowing labor data, strained consumers, and volatile commodity markets, the message emanating from the yield curve is clear. Investors are increasingly positioning for a scenario where monetary authorities, overly reactive to supply-side energy shocks, risk implementing a policy mistake that prioritizes lagging indicators over forward-looking economic reality. Whether the Federal Reserve heeds this warning or proceeds down a path of continued tightening will dictate the trajectory of global asset prices, corporate debt health, and economic growth well into the future.
Related posts: