EUR/USD Technical Analysis: Bearish Bias Intact as Pair Hovers Above Key Support at 1.1103

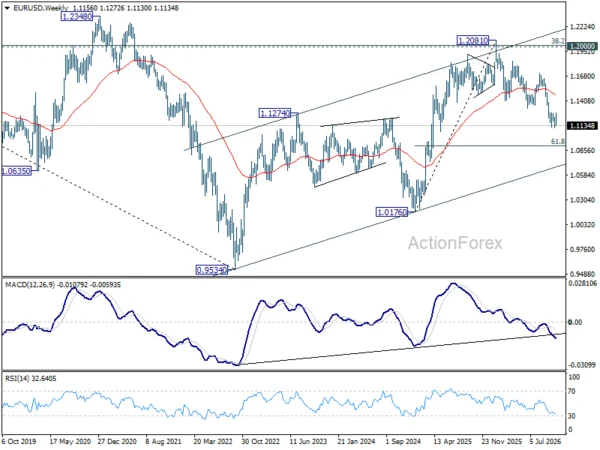
The EUR/USD currency pair faces a precarious technical landscape as it holds range-bound above the critical 1.1103 threshold. Market participants maintain a predominantly neutral bias in the near term, though underlying technical indicators point toward an extended downward trajectory. As currency strategists parse the multi-layered moving averages and Fibonacci retracement levels, the broader macroeconomic environment continues to exert heavy pressure on the single currency against the greenback.
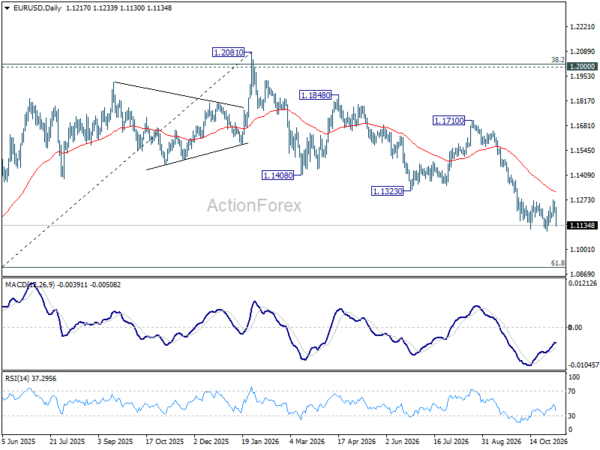
Short-term price action demonstrates persistent hesitation, yet sellers retain the tactical advantage. A decisive breakdown below the immediate support floor at 1.1103 would not only invalidate recent consolidation patterns but also accelerate a larger downward correction. This corrective wave stems directly from the medium-term peak established at 1.2081, setting the stage for a test of the 1.0904 Fibonacci retracement level. Conversely, buyers must orchestrate a firm and sustained break above the 1.1272 resistance barrier to signal a legitimate short-term market bottom and provoke a stronger technical rebound.
Medium-Term and Intermediate Market Dynamics
Analyzing the broader market structure reveals that the steep descent from the 1.2081 medium-term top is systematically reversing the preceding recovery phase. This bullish leg originated from the 2025 low of 1.0176 and potentially traces back further to the cyclical nadir of 0.9534 recorded in 2022.
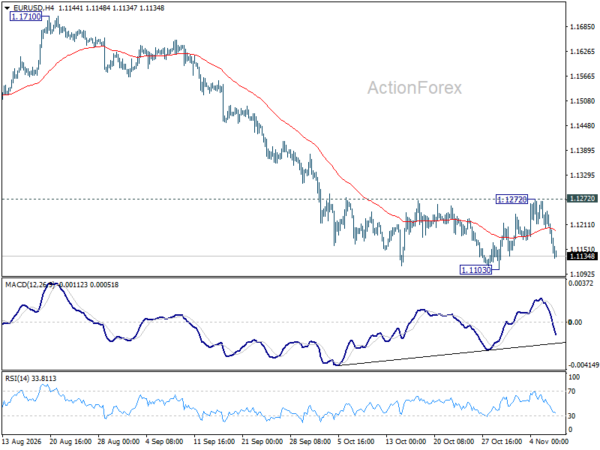
As long as the formidable overhead resistance at 1.1710 remains intact, market risk is decisively skewed to the downside. Should minor relief rallies materialize, they are widely expected to attract fresh selling interest near this key ceiling. If bearish momentum accelerates as anticipated, market analysts project the currency pair will navigate toward the 61.8% Fibonacci retracement level of the entire 1.0176-to-1.2081 advance, aligning precisely with the 1.0904 objective.
Long-Term Structural Trends and the 55-Month EMA
From a macro perspective, long-term charts place intense scrutiny on the 55-month Exponential Moving Average (EMA), which currently resides at 1.243. A sustained violation of this crucial moving average would carry profound structural implications for the foreign exchange market.
Specifically, such a breakdown would suggest that the substantial multi-year recovery from the 0.9534 low (registered in 2022) has definitively concluded. Under this wave-count scenario, the advance toward 1.2081 represents a mere three-wave corrective pattern rather than the birth of a new secular bull market. This corrective top found fierce rejection near the 38.2% retracement of the monumental 1.6039-to-0.9534 bear market sweep, which sits at 1.2019—a zone heavily confluent with the major 1.2000 psychological milestone. Consequently, a failure to defend the 55-month EMA would confirm that the structural, long-term downtrend initiated at the historic 2008 high of 1.6039 remains firmly intact.
Fundamental Drivers and Macroeconomic Context
The technical vulnerability of the EUR/USD pair does not occur in a vacuum; it is underpinned by shifting macroeconomic fundamentals on both sides of the Atlantic. Persistent divergence in monetary policy expectations between the Federal Reserve and the European Central Bank (ECB) continues to dictate capital flows. While the ECB faces sluggish economic growth across the Eurozone—weighing heavily on manufacturing data and domestic demand—the United States economy has demonstrated surprising resilience, supporting higher relative yield profiles for dollar-denominated assets.
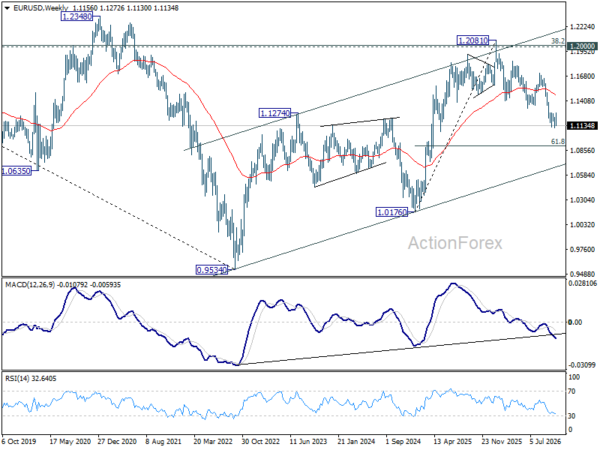
Inflation readings across Germany, France, and the broader Eurozone have prompted market participants to price in a more aggressive easing cycle from Frankfurt. In contrast, the Federal Reserve has maintained a measured approach to interest rate adjustments, preserving the interest rate differential that favors the US dollar. This fundamental backdrop provides a coherent rationale for the technical correction unfolding on the charts, reinforcing the bearish targets identified by quantitative analysts.
Chronology of Key Technical Levels
Understanding the evolution of the current market cycle requires mapping out the key price milestones that have shaped the EUR/USD trajectory over recent years:
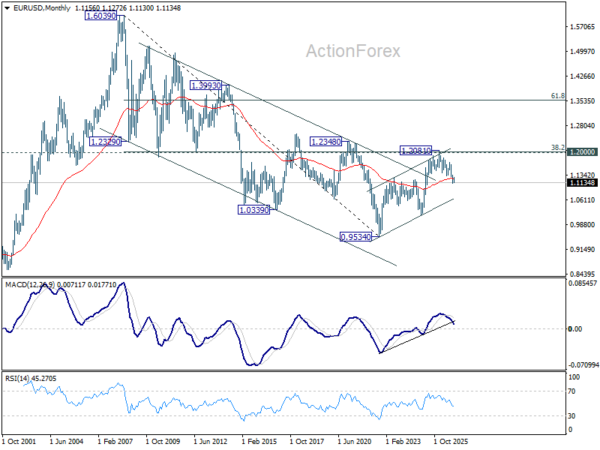
- 2008 High (1.6039): The origin of the secular multi-decade downtrend that continues to cast a long-term shadow over the European currency.
- 2022 Low (0.9534): The generational cyclical low point from which subsequent recovery waves and corrective structures have evolved.
- 2025 Low (1.0176): The foundational swing low that initiated the most recent intermediate bullish leg toward the 1.2081 threshold.
- Medium-Term Top (1.2081): The peak of the recent recovery cycle, which faced heavy rejection near the 38.2% long-term retracement level (1.2019) and triggered the ongoing bearish reversal.
- Current Support Zone (1.1103): The immediate operational floor preventing a deeper slide toward the 1.0904 Fibonacci target.
- 55-Month EMA (1.1243): The critical macro moving average whose violation would signal the definitive end of the post-2022 recovery phase.
Market Implications and Strategic Outlook
For institutional traders, hedge funds, and retail market participants alike, the current price action demands a disciplined approach to risk management. The inability of the euro to sustain momentum above the 1.1272 hurdle highlights underlying market exhaustion.
As foreign exchange desks position themselves for the remainder of the quarter, attention remains squarely fixed on the 1.1103 support level. A confirmed daily and weekly close beneath this threshold will likely trigger algorithmic selling programs aimed at testing the 1.0904 objective. Conversely, any unexpected macroeconomic shocks that weaken the US dollar could ignite a corrective squeeze, provided buyers can successfully defend the 55-month EMA and push the spot rate past the 1.1710 overhead resistance barrier. Until such a structural shift occurs, the path of least resistance for the EUR/USD pair points lower.