The Strait of Hormuz Reverts to Military Control, Raising Stakes Amidst Fragile Ceasefire

The geopolitical landscape surrounding the Strait of Hormuz has experienced a dramatic and concerning reversal, shifting from a brief period of perceived openness to a state of heightened military control within a mere 24-hour span. This abrupt change underscores the precarious nature of the current ceasefire and has forced a critical reassessment of the "peace trade" by investors, particularly as a crucial deadline looms. What initially appeared to signal a de-escalation has rapidly dissolved into renewed uncertainty, with significant implications for global markets.

The Shifting Sands of Hormuz: A Rapid Reversal
The events unfolded with startling speed. Initial reports from Iranian officials suggested a complete reopening of the Strait of Hormuz to commercial shipping, a development that was cautiously welcomed by international markets. However, this optimism proved to be short-lived. Within a day, the situation dramatically reversed, with military control being reimposed. Disturbingly, reports of direct confrontations, including incidents involving commercial vessels, have since emerged. These developments effectively extinguish any immediate assumptions of safe passage through this vital maritime artery, which is critical for global energy supplies.
The Core of the Standoff: A Breakdown in Trust
At the heart of this escalating tension lies a profound lack of trust between Washington and Tehran. The United States has maintained its naval blockade on Iranian ports, asserting that it will persist until a more comprehensive agreement is reached. Iran, in turn, has characterized the blockade as a violation of the agreed-upon ceasefire conditions. In response, Tehran has tightened its grip on the Strait of Hormuz, explicitly linking any potential reopening to the restoration of "complete freedom of navigation."
This dynamic has created a significant precondition deadlock, casting a shadow over the prospects for upcoming diplomatic talks. While there have been suggestions of another round of negotiations scheduled for Monday, no formal confirmation has been issued. Even if these discussions proceed, they are expected to be fraught with tension, with both sides entering the talks from entrenched positions, unwilling to cede ground.
The Approaching Deadline: A Ticking Clock
The broader risk is that time is rapidly running out. The current ceasefire is set to expire on April 22nd. If no discernible progress is made before this deadline, the probability of a renewed outbreak of hostilities escalates sharply. Such a scenario could manifest as a return to direct military confrontation or a significant escalation at strategic chokepoints like the Strait of Hormuz, which handles approximately one-fifth of the world’s oil consumption.
Market Implications: Oil as the Ultimate Bellwether
For global financial markets, the coming days are of paramount importance. The unfolding events will not only shape geopolitical trajectories but will also profoundly influence the direction of oil prices, inflation expectations, and overall global risk sentiment.
In this volatile environment, oil prices are emerging as the ultimate signal of market sentiment. The ability, or indeed the failure, of oil prices to decisively break lower will determine whether markets continue to favor diplomatic solutions or begin to price in a heightened risk of renewed conflict. As the ceasefire deadline approaches, this signal will become increasingly critical for traders and investors alike. Concurrently, key technical levels across various asset classes will provide further guidance, helping market participants discern whether underlying sentiment is undergoing a genuine shift or merely reacting to headline-driven volatility.
Oil: The Crucial Indicator of Global Sentiment
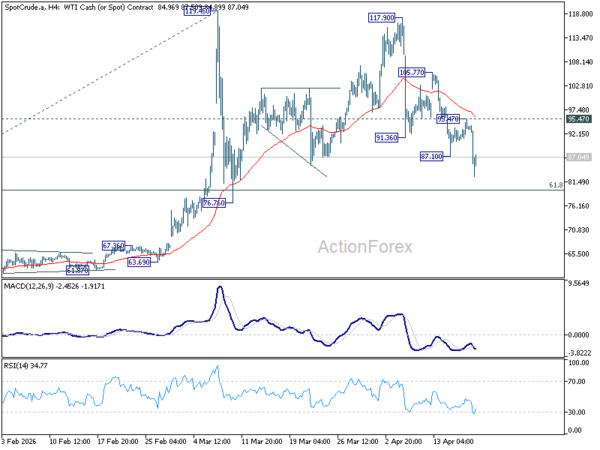
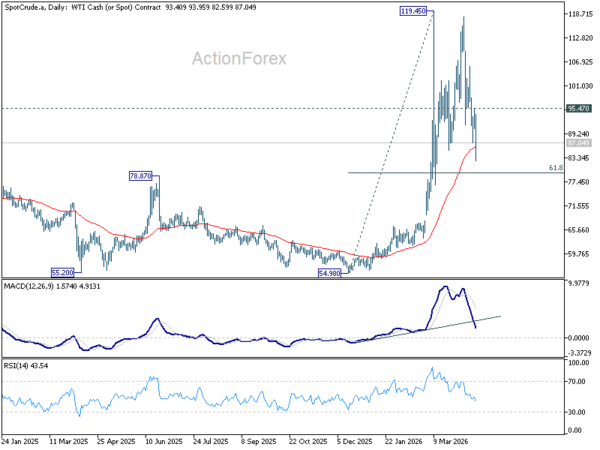
Crude oil prices remain the most sensitive barometer of global market sentiment. West Texas Intermediate (WTI) crude experienced a significant decline from its recent peak of $117.90, extending its downward trajectory to a low of $82.59. While further downside pressure is anticipated in the immediate term, a decisive breach of the 61.8% Fibonacci retracement level, situated at $79.60, would likely necessitate a more sustained de-escalation in the Middle East. Such a scenario would ideally include a confirmed and lasting normalization of conditions in the Strait of Hormuz. In the absence of such developments, the psychologically significant $80 per barrel level is expected to act as a near-term floor.
Meanwhile, as long as the resistance at $95.47 holds firm, the prevailing bias remains to the downside. This suggests that while volatility may persist, the absence of a renewed escalation between the United States and Iran is indicated by the continued cap at this resistance level.
Equities: New Records Amidst Geopolitical Uncertainty
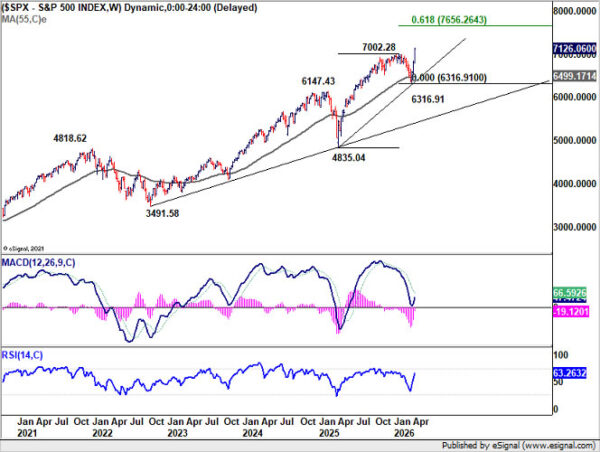
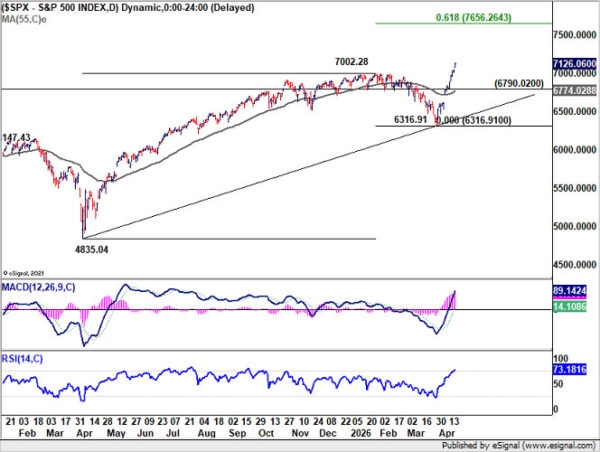
Despite the heightened geopolitical tensions, major equity indices have shown remarkable resilience. The S&P 500, for instance, resumed its upward trend last week, decisively breaking above the 7,002.28 resistance level and closing at a fresh all-time high of 7,126.06. While the potential for near-term volatility or a pullback cannot be entirely discounted given the prevailing geopolitical uncertainty, the overall outlook for equities remains bullish, provided that the support level at 6,790.02 is maintained. The current advance is targeting a 61.8% projection, calculated from the price range of 4,835.04 to 7,002.28, extending from 6,316.91, with an ultimate target of 7,656.26.
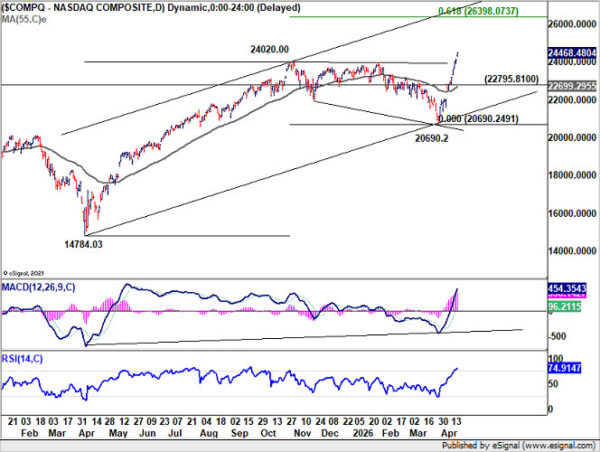
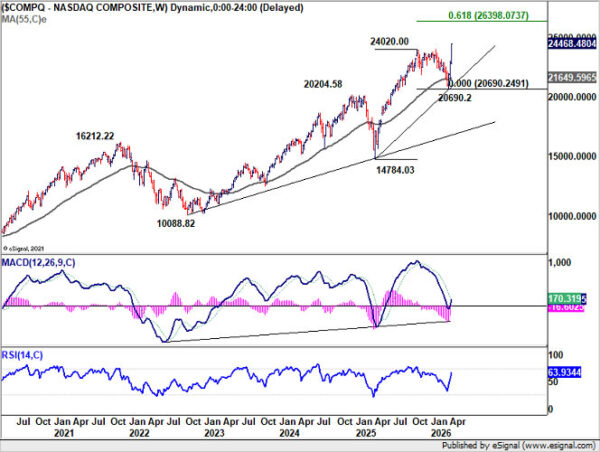
The NASDAQ composite index mirrors this performance, also concluding the past week at a new record high of 24,468.48. The near-term outlook for the NASDAQ remains positive, contingent on the holding of support at 22,795.81, even in the event of a temporary retreat. The broader uptrend is projecting a 61.8% extension from the price range of 14,784.03 to 24,020.00, originating from 20,690.2, with a potential target of 26,398.07.
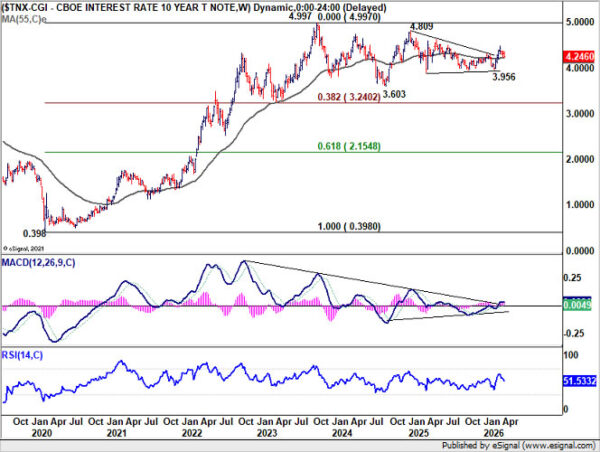
Yields: A Critical Juncture at Key Support Levels
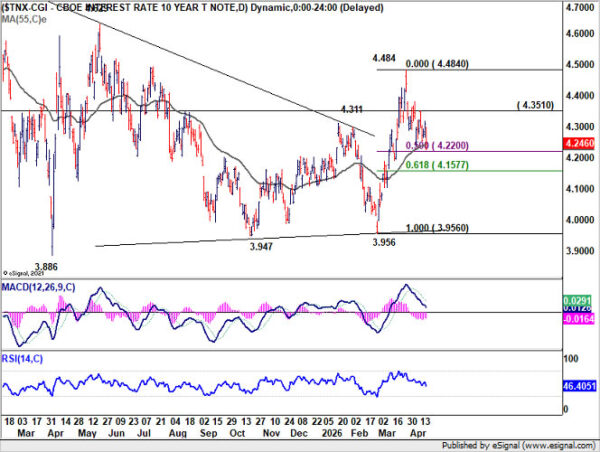
The pullback in U.S. 10-year Treasury yields from their recent short-term peak of 4.484% is thus far being interpreted as a corrective movement, suggesting that the rise from the 3.956% low may not yet be complete. Yields are currently testing a crucial cluster of support levels. This zone includes the 55-day Exponential Moving Average (EMA), currently at 4.240%, the 50% Fibonacci retracement of the move from 3.956% to 4.484% at 4.220%, and the 55-week EMA, which stands at 4.219%.
A robust rebound from this support area, followed by a decisive break above the 4.351% resistance, would signal that the upward trend initiated from 3.956% is poised to resume, potentially surpassing the previous high of 4.484%. Conversely, a firm break below the 4.220% level would open the door for a deeper pullback, with attention then shifting to the 61.8% Fibonacci retracement at 4.157% and potentially lower levels.
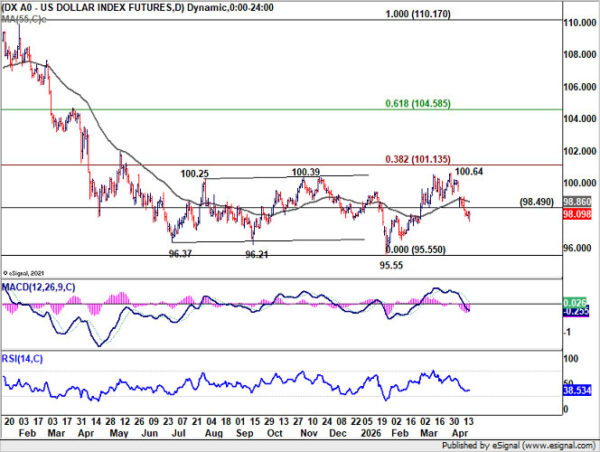
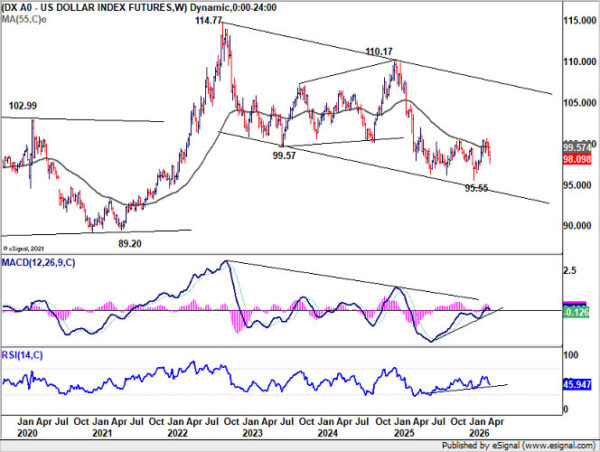
Dollar Index: Bearish Bias Remains Intact Below Key Moving Average
The Dollar Index’s breach of the 98.49 support level last week suggests that the recent rebound from the 95.55 low has likely concluded. More significantly, the rejection below the 38.2% Fibonacci retracement of the 110.17 to 95.55 range, which is located at 101.13, coupled with a failure to overcome the 55-week EMA at 99.57, reinforces a bearish medium-term outlook.
Further downside pressure is anticipated as long as the 55-day EMA, currently at 98.86, caps any recovery attempts. The primary focus will be on a retest of the 95.55 low. While a breach below this level is not the base case scenario at present, its likelihood will depend on the momentum of any subsequent downward leg.
Conversely, a sustained move above the 55-day EMA would indicate that the rebound from 95.55 is still in play, potentially leading to another test of the 100.64 level and possibly the 101.13 Fibonacci resistance.
AUD/USD: Potential for a Breakout Above Key Resistance
The Australian Dollar against the U.S. Dollar (AUD/USD) emerged as the top performer last week, registering a gain of 1.46%. While some near-term consolidation may occur after the initial rejection at the 0.72 handle, the broader outlook remains bullish, provided that the 55-day EMA, currently at 0.6985, continues to hold as support.
More importantly, a decisive break above the 61.8% Fibonacci retracement of the move from 0.8006 to 0.5913, located at 0.7206, would solidify the argument that the current move represents a reversal of the downtrend from the 2021 high of 0.8006, rather than merely a corrective phase. Such a development would pave the way for a retest of the 0.8006 level, at a minimum.
EUR/USD Weekly Outlook: A Neutral Stance Amidst Key Levels
The Euro against the U.S. Dollar (EUR/USD) extended its rise from 1.1408 to 1.1848 last week. However, it failed to decisively overcome the 61.8% Fibonacci retracement of the 1.2081 to 1.1408 range, which stands at 1.1824. Consequently, the initial bias for the current week has been turned to neutral. On the upside, sustained trading above 1.1824 would create the conditions for a retest of the 1.2081 high. However, a firm break below the 1.1662 support level would likely trigger a deeper decline, potentially revisiting the 1.1408 low.
In the broader context, the strong support observed at the 38.2% Fibonacci retracement of the 1.0176 to 1.2081 range, situated at 1.1353, suggests that the pullback from 1.2081 is more likely to be a corrective movement. Significant support was also found at the 55-week EMA, currently at 1.1507. Attention remains focused on the key resistance cluster around the 1.2000 to 1.2081 levels. A decisive break above this zone would carry significant long-term bullish implications. Conversely, a break below the 1.1408 support would revive the case for a medium-term bearish trend reversal.
In the long-term perspective, the 38.2% Fibonacci retracement of the 1.6039 to 0.9534 range, located at 1.2019 and close to the psychological 1.2000 level, is a critical determinant of the outlook. Rejection at this level would suggest that the multi-decade downtrend from the 2008 high of 1.6039 remains intact, keeping the outlook neutral at best. However, a decisive breach of the 1.2000/1.2019 area would signal a long-term bullish trend reversal, with potential targets extending to the 61.8% Fibonacci retracement at 1.3554.


