Federal Reserve Rate Decision Looms as Bitcoin Tests Critical Resistance Ahead of September FOMC Meeting

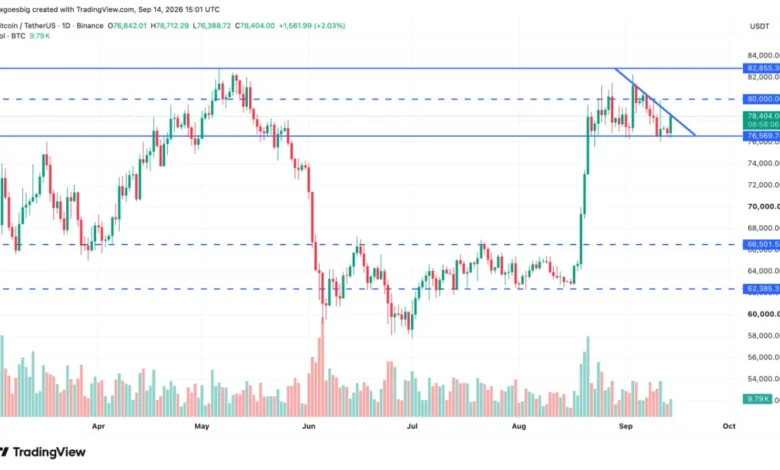
The upcoming Federal Reserve monetary policy announcement scheduled for September 16, 2026, has emerged as the pivotal macro-economic catalyst for the cryptocurrency market, with Bitcoin hovering near the $78,400 threshold. While futures markets heavily price in a quarter-point interest rate increase, market analysts suggest that an unexpected policy pause could trigger a sharp dovish rally, propelling the world’s leading cryptocurrency past formidable technical barriers toward the $80,000 psychological milestone.
As investors parse through labor market reports, consumer price indexes, and shifting central bank rhetoric, the intersection of monetary policy and digital asset valuation highlights a delicate moment for risk-on portfolios. With the Crypto Fear & Greed Index currently entrenched in greed territory at 68, market positioning remains sensitive to incoming macroeconomic surprises, making Wednesday’s Federal Open Market Committee (FOMC) verdict an inflection point for autumn trading.
Chronology of Shifting Expectations: From Dovish Hopes to Hawkish Realities
The trajectory of market sentiment surrounding the September FOMC meeting has undergone significant volatility over the past two quarters. Approximately six weeks prior, the consensus baseline leaned heavily toward an interest rate pause or even potential easing. This perspective gained traction following a weaker-than-expected July employment report that indicated the U.S. economy was shedding jobs, leading prediction markets to assign roughly a 60% probability to the Fed holding rates steady within the current 3.50% to 3.75% target range.
However, the narrative shifted dramatically during the central bank’s annual economic symposium in Jackson Hole, Wyoming. Federal Reserve Chair Kevin Warsh delivered a hawkish address warning that domestic inflation was not slowing down at the anticipated pace. Warsh pointed to concerning recent economic readings, highlighting a 12-month Personal Consumption Expenditures (PCE) inflation print of 3.7% and a six-month annualized pace of 4.1%, both comfortably above the central bank’s steadfast 2% target.
The Federal Reserve leadership’s increasingly restrictive stance was underscored during the July policy meeting, where three FOMC members formally dissented by advocating for immediate rate hikes rather than a pause. Consequently, major financial institutions adjusted their outlooks; notably, Barclays released a research note updating its baseline projection to include two additional rate hikes before the end of the year—one in September and another in December. As of mid-September, CME FedWatch data indicates that interest rate futures assign an 85% probability to a 25-basis-point increase on September 16, leaving little room for error among leveraged market participants.
Macroeconomic Comparisons: 2001, 2007, and the 2026 Landscape
The rationale for a Fed pause rests on a growing body of economic analysis suggesting that tightening monetary policy into a cooling labor market risks exacerbating an economic downturn. Economists advocating for a cautious approach draw parallels and distinctions between current macroeconomic indicators and the economic environments preceding the recessions of 2001 and 2007.
Prior to both the 2001 dot-com bust and the 2007 global financial crisis, the U.S. labor market exhibited exceptional strength, characterized by robust hiring and falling unemployment rates, while headline inflation metrics ran higher than current levels. Despite this robust economic footing, severe recessions materialized, and inflation subsequently plummeted as economic activity contracted.

In contrast, the economic architecture facing the FOMC presents a softer foundation across several key metrics:
- Labor Market Dynamics: Job creation has visibly thinned, and long-term unemployment figures are steadily climbing, signaling structural labor softening.
- Inflation Composition: Headline inflation currently sits below pre-recession levels observed in 2001 and 2007. However, core PCE—which strips out volatile food and energy components—remains elevated, serving as the primary justification for the central bank’s hawkish wing.
Proponents of a monetary policy pause argue that if economic contractions can develop from healthier macroeconomic foundations than those observed today, aggressive tightening risks deepening an ongoing growth slowdown. Furthermore, historical precedent demonstrates that inflation naturally recedes during economic downturns. Therefore, hiking rates to combat price pressures that a recession would inherently neutralize forces the economy to pay for tighter policy twice: once through the restrictive rate hikes, and again through the subsequent economic deceleration. Conversely, hawks led by Chair Warsh argue that historical labor strength is not a reliable predictor of future resilience, maintaining that sticky inflation poses a greater long-term threat to financial stability than growth risks.
Bitcoin Technical Analysis: Navigating Floors, Trendlines, and the $80,000 Ceiling
Against this macroeconomic backdrop, Bitcoin price action remains tightly compressed within a critical technical channel. Trading near $78,400, the asset has recorded modest daily gains while pressing persistently against a descending trendline that has successfully repelled every bullish advance since early September.
The recent price trajectory found a reliable demand zone near the $76,569 support level. During recent sessions, the daily low dipped to $76,388, briefly piercing beneath the established floor before aggressive buyers stepped in to reclaim the level. This market behavior left a pronounced lower wick on the daily candlestick—a traditional technical indicator demonstrating that while sellers briefly overwhelmed order books, robust demand absorption at lower levels successfully defended the structural support zone.
Immediate resistance is defined by a three-touch descending trendline originating from the September market highs. While intraday trading sessions have occasionally pierced this diagonal boundary, market technicians emphasize that a confirmed daily close above the trendline is required to validate a true breakout. Clearing this barrier opens a clear path toward the psychological and structural $80,000 ceiling, a major resistance level that previously rejected upward momentum during both the May market decline and the September relief rally.
On the macro range, the yearly high established in the spring at $82,855 serves as the top of the broader trading channel. Conversely, a failure to defend the $76,569 support floor on a daily closing basis would expose Bitcoin to deeper retracement risks, placing the summer consolidation band between $62,385 and $66,501 in play as the next logical area of historical buyer interest.
Scenario Analysis: How Wednesday’s FOMC Decision Impacts Digital Assets
The September 16 policy announcement, accompanied by the updated Summary of Economic Projections and the closely watched dot plot, offers three primary scenarios for financial markets and cryptocurrency valuations:
- The Fully Priced Hike (Base Case – 85% Probability): With a quarter-point rate increase largely baked into current market pricing, a standard rate hike delivered without aggressive forward guidance would likely yield a muted reaction in Bitcoin. Unless the accompanying economic projections signal an aggressive escalation in monetary tightening, the market will likely absorb the news efficiently.
- The Dovish Shock (The Pause Scenario): Should the Federal Reserve elect to leave interest rates untouched at 3.50%–3.75%, it would represent a significant dovish shock against the 85% probability currently assigned by futures markets. Historically, unexpected monetary pauses act as powerful catalysts for risk-on assets, providing the structural momentum necessary to clear the descending trendline and initiate a rapid drive toward the $80,000 threshold.
- The Hawkish Hike (Downside Risk Scenario): If the central bank implements the expected quarter-point hike while simultaneously issuing a hawkish dot plot pointing toward further tightening in December, the resulting monetary pressure could test the resilience of the $76,569 support floor, leading to short-term liquidations across leveraged crypto derivatives.
Beyond the immediate interest rate decision, market participants must navigate external supply-side inflationary pressures, including fluctuating energy prices linked to geopolitical tensions in the Middle East. Because monetary policy can only address supply shocks indirectly, analysts emphasize that the Federal Reserve’s medium-term trajectory—particularly the December dot plot—will dictate broader market positioning once the immediate volatility of Wednesday’s announcement subsides.