Statistical Arbitrage for Independent Traders: Navigating Complex Networks and Identifying True Mispricings

The energy sector, a cornerstone of global economies, presents a complex tapestry of interconnected companies whose stock prices often move in tandem, influenced by shared market forces. However, within this intricate web, opportunities for sophisticated traders emerge when individual stock movements deviate from the norm, creating temporary mispricings. This article delves into the advanced strategies of statistical arbitrage, specifically focusing on a method known as "Triangulated Stat Arb," which moves beyond traditional pairs trading to identify and capitalize on these fleeting market inefficiencies for independent traders.
The Evolution of Statistical Arbitrage: From Pairs to Portfolios
Statistical arbitrage, often shortened to "stat arb," is a quantitative trading strategy that seeks to profit from the statistical mispricing of financial instruments. Historically, this has involved identifying pairs of highly correlated assets, such as two stocks within the same industry, and betting that their price ratio will revert to its historical mean. However, as markets become more interconnected and complex, this traditional approach faces limitations. The energy sector, for instance, involves numerous publicly traded companies like ExxonMobil (XOM), Schlumberger (SLB), and others, whose valuations are intrinsically linked to global energy demand, supply dynamics, geopolitical events, and technological advancements.
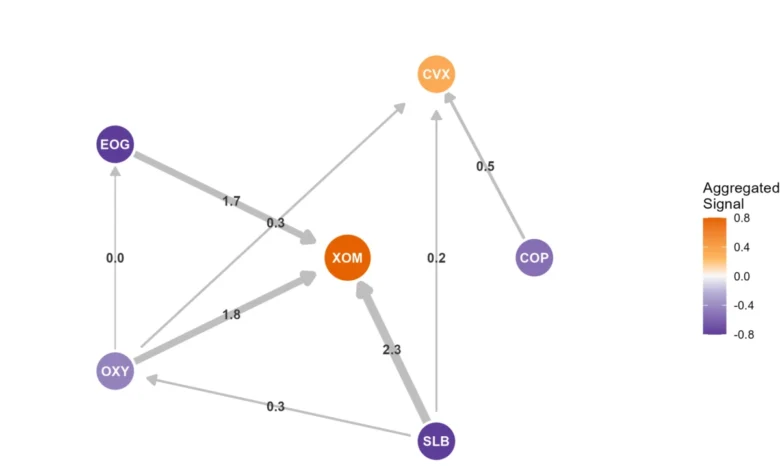
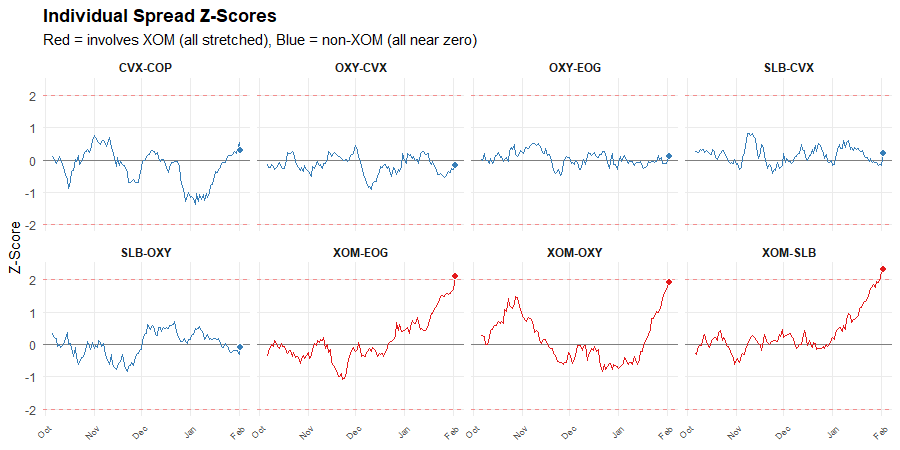
A recent analysis within this sector revealed a curious pattern in energy stock spreads. When examining the relative price movements of several energy giants, a clear outlier emerged: ExxonMobil (XOM). Every spread involving XOM appeared "stretched," indicating a potential mispricing, while spreads not including XOM remained near their historical averages. This initial observation, while seemingly straightforward, hints at a deeper complexity in identifying true market dislocations.
Triangulation: A Navigation Technique for Market Analysis
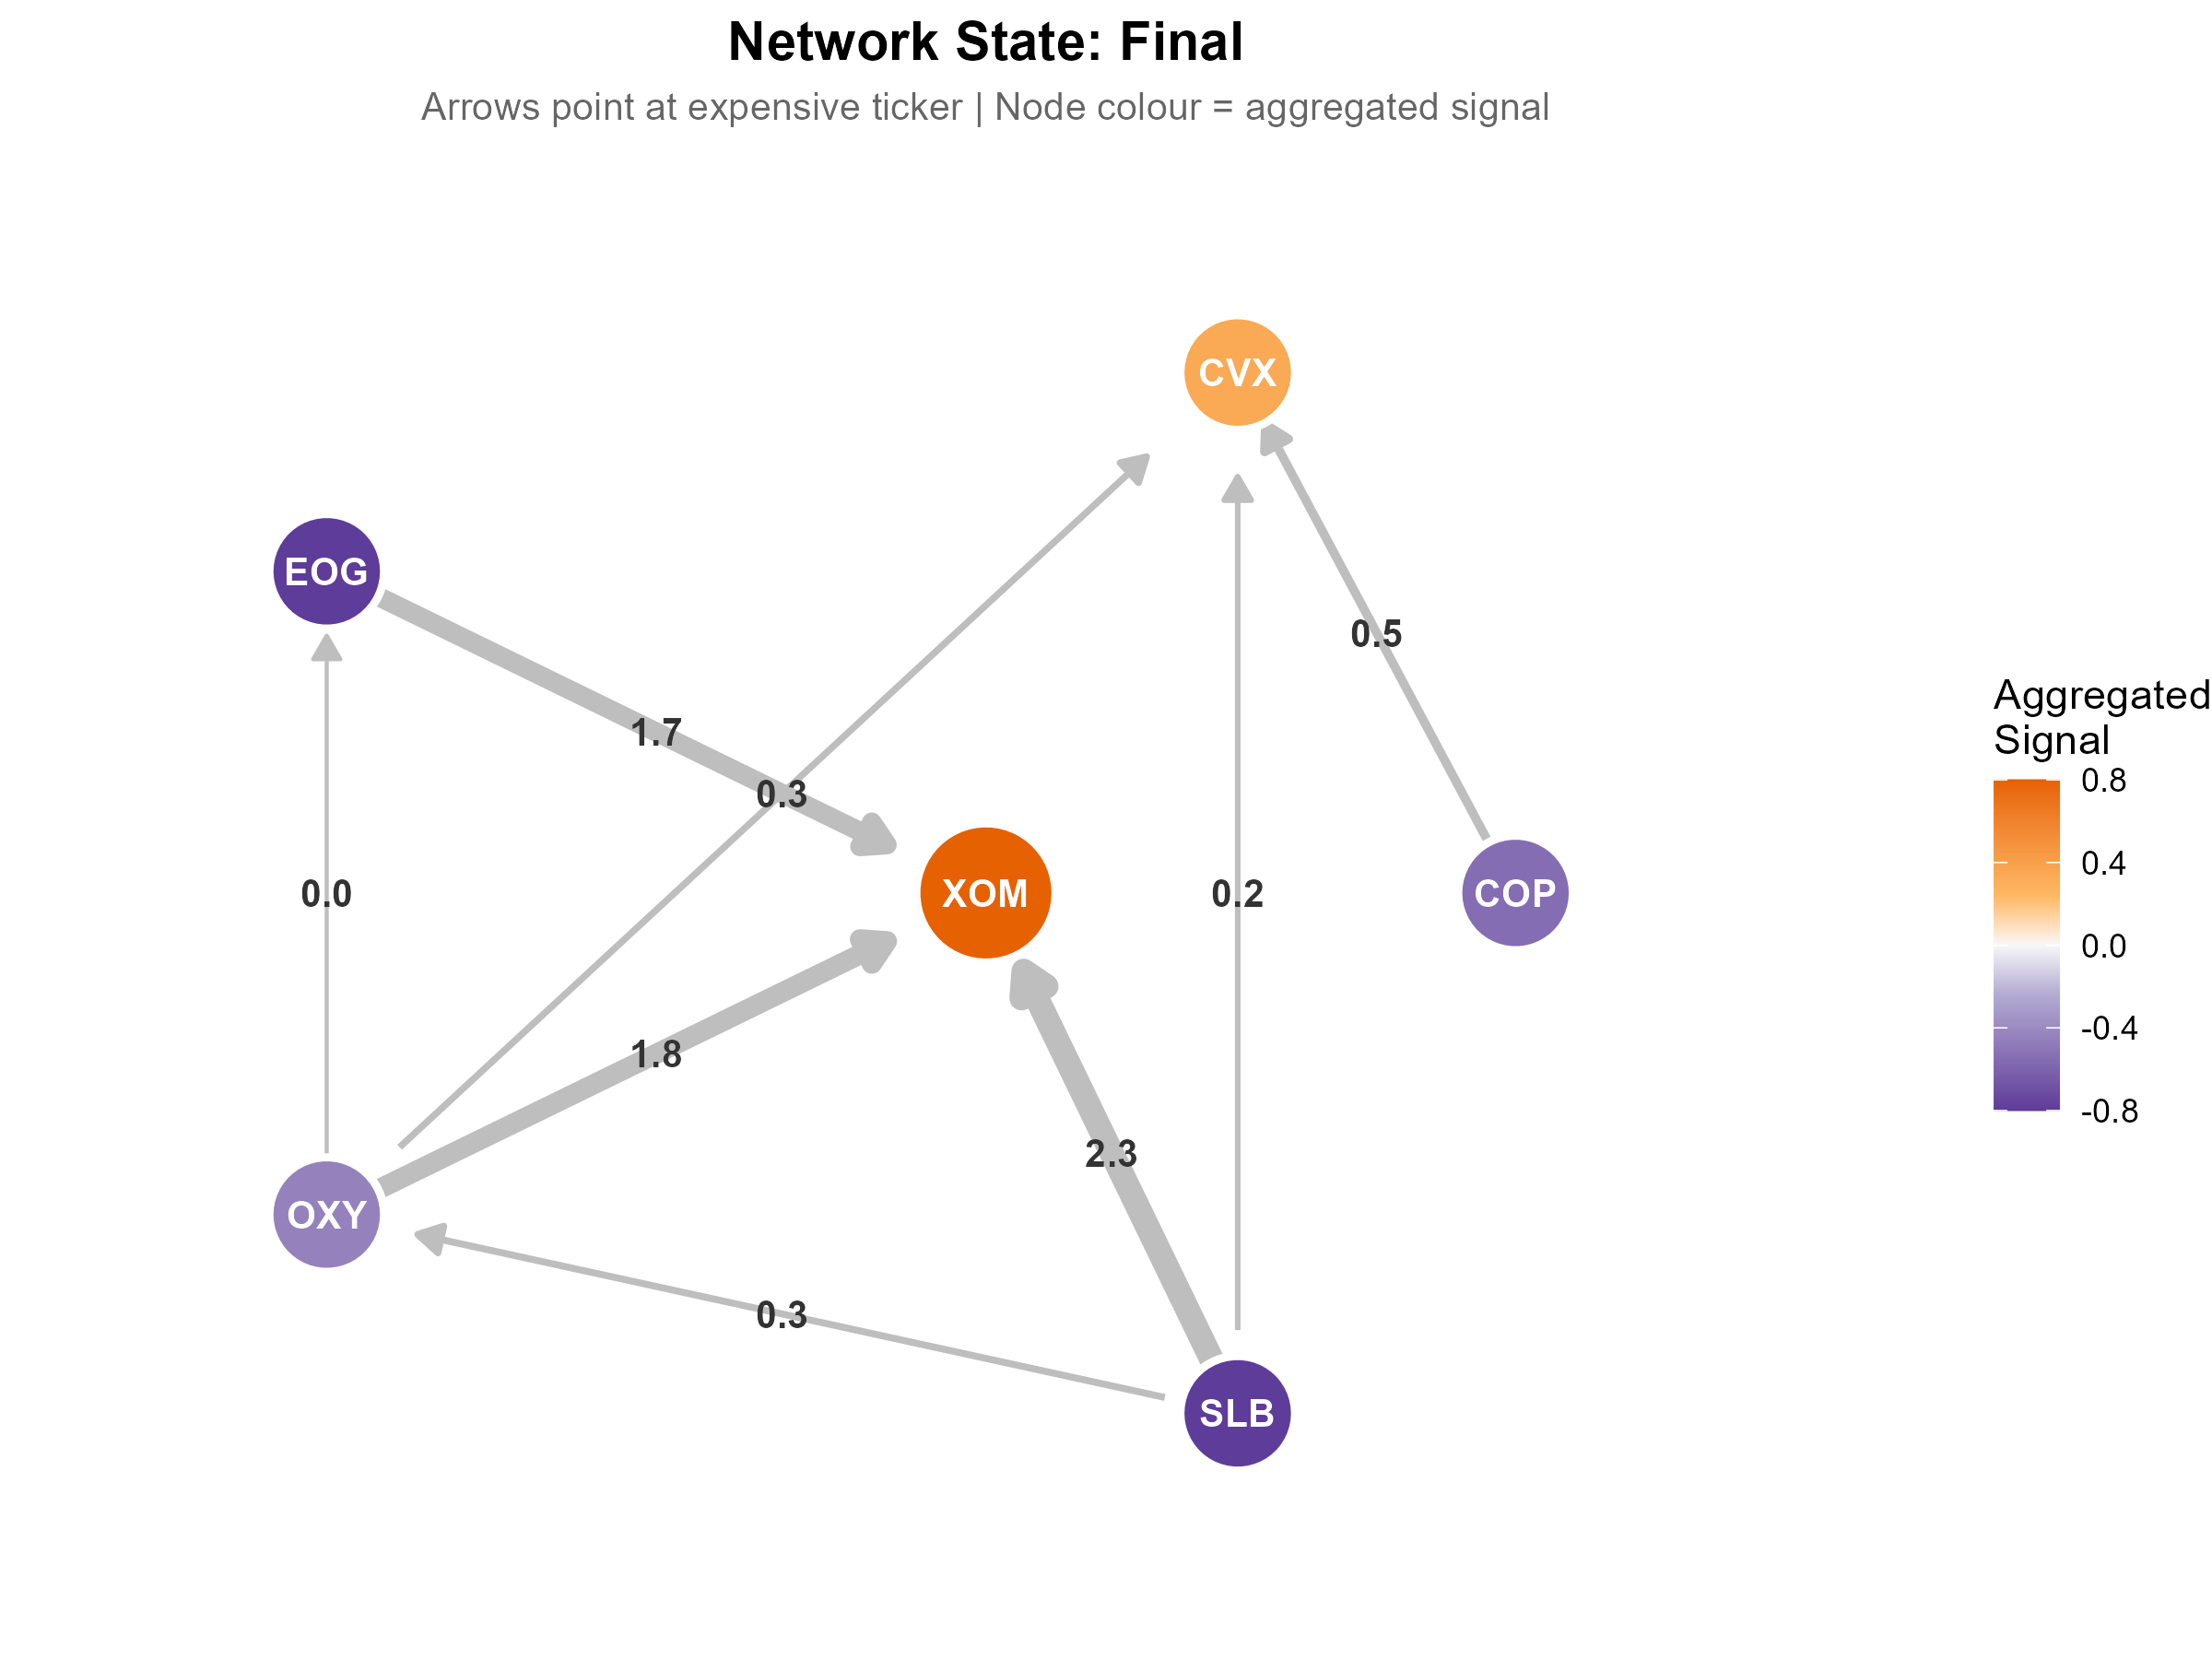
The term "Triangulated Stat Arb" draws inspiration from the navigational technique of triangulation, where multiple bearings on known landmarks are used to pinpoint an exact location. In the context of financial markets, each spread between two assets acts as a "bearing" or a "vote," suggesting that one asset is potentially overvalued or undervalued relative to the other.
For example, a spread between XOM and SLB might indicate that XOM is expensive relative to SLB. Another spread between XOM and Chevron (CVX) might reinforce this observation. If a third spread, say between SLB and CVX, also suggests a similar deviation, the confidence in the identified mispricing increases. This convergence of multiple independent signals allows traders to establish a more robust "fix" on potential market inefficiencies.
While a single spread provides limited insight – it’s unclear whether asset A has become expensive or asset B has become cheap – the triangulation method, by aggregating multiple "votes," narrows down the focus. It shifts the question from "something in this pair is mispriced" to "this specific asset appears mispriced relative to its peers within the network." This refinement is a significant step forward in identifying actionable trading opportunities.
The Challenge of Interpretation: Mispricing vs. Repricing
It is crucial to acknowledge that not all market dislocations are indicative of genuine mispricing. Stock prices can fluctuate due to fundamental news, such as earnings surprises, production announcements, or regulatory changes that specifically affect one company. When a triangulation method points to an outlier like XOM, it’s essential to consider why it might be deviating.
Scenario 1: Temporary Flow or Hedging Activity
A significant price movement in XOM could be driven by temporary, price-insensitive flows. This might include large institutional investors rebalancing their portfolios, significant hedging activities, or the unwinding of derivative positions. Such movements are often transient and are expected to revert to the mean as the market absorbs the activity. These represent true arbitrage opportunities.
Scenario 2: Fundamental Repricing
Alternatively, XOM’s deviation could signal a genuine repricing based on new, fundamental information. An unexpected earnings beat, a major discovery, or a shift in regulatory policy impacting the company’s future prospects would warrant a recalibration of its valuation. In this case, the "mispricing" is actually a reflection of new market consensus, and attempting to trade against it could be a losing proposition.
Triangulation, while powerful in identifying the what (an apparent mispricing), cannot inherently determine the why. This distinction is critical for independent traders aiming to avoid significant losses.
Scaling Up: The Power of Network Analysis
The XOM example, while illustrative, involves a small network of three stocks. The true power of Triangulated Stat Arb emerges when this methodology is applied to a larger universe of securities, potentially comprising 40, 60, or even 100 interconnected stocks. By analyzing a dense network of overlapping spreads, a more comprehensive picture of relative valuations emerges.
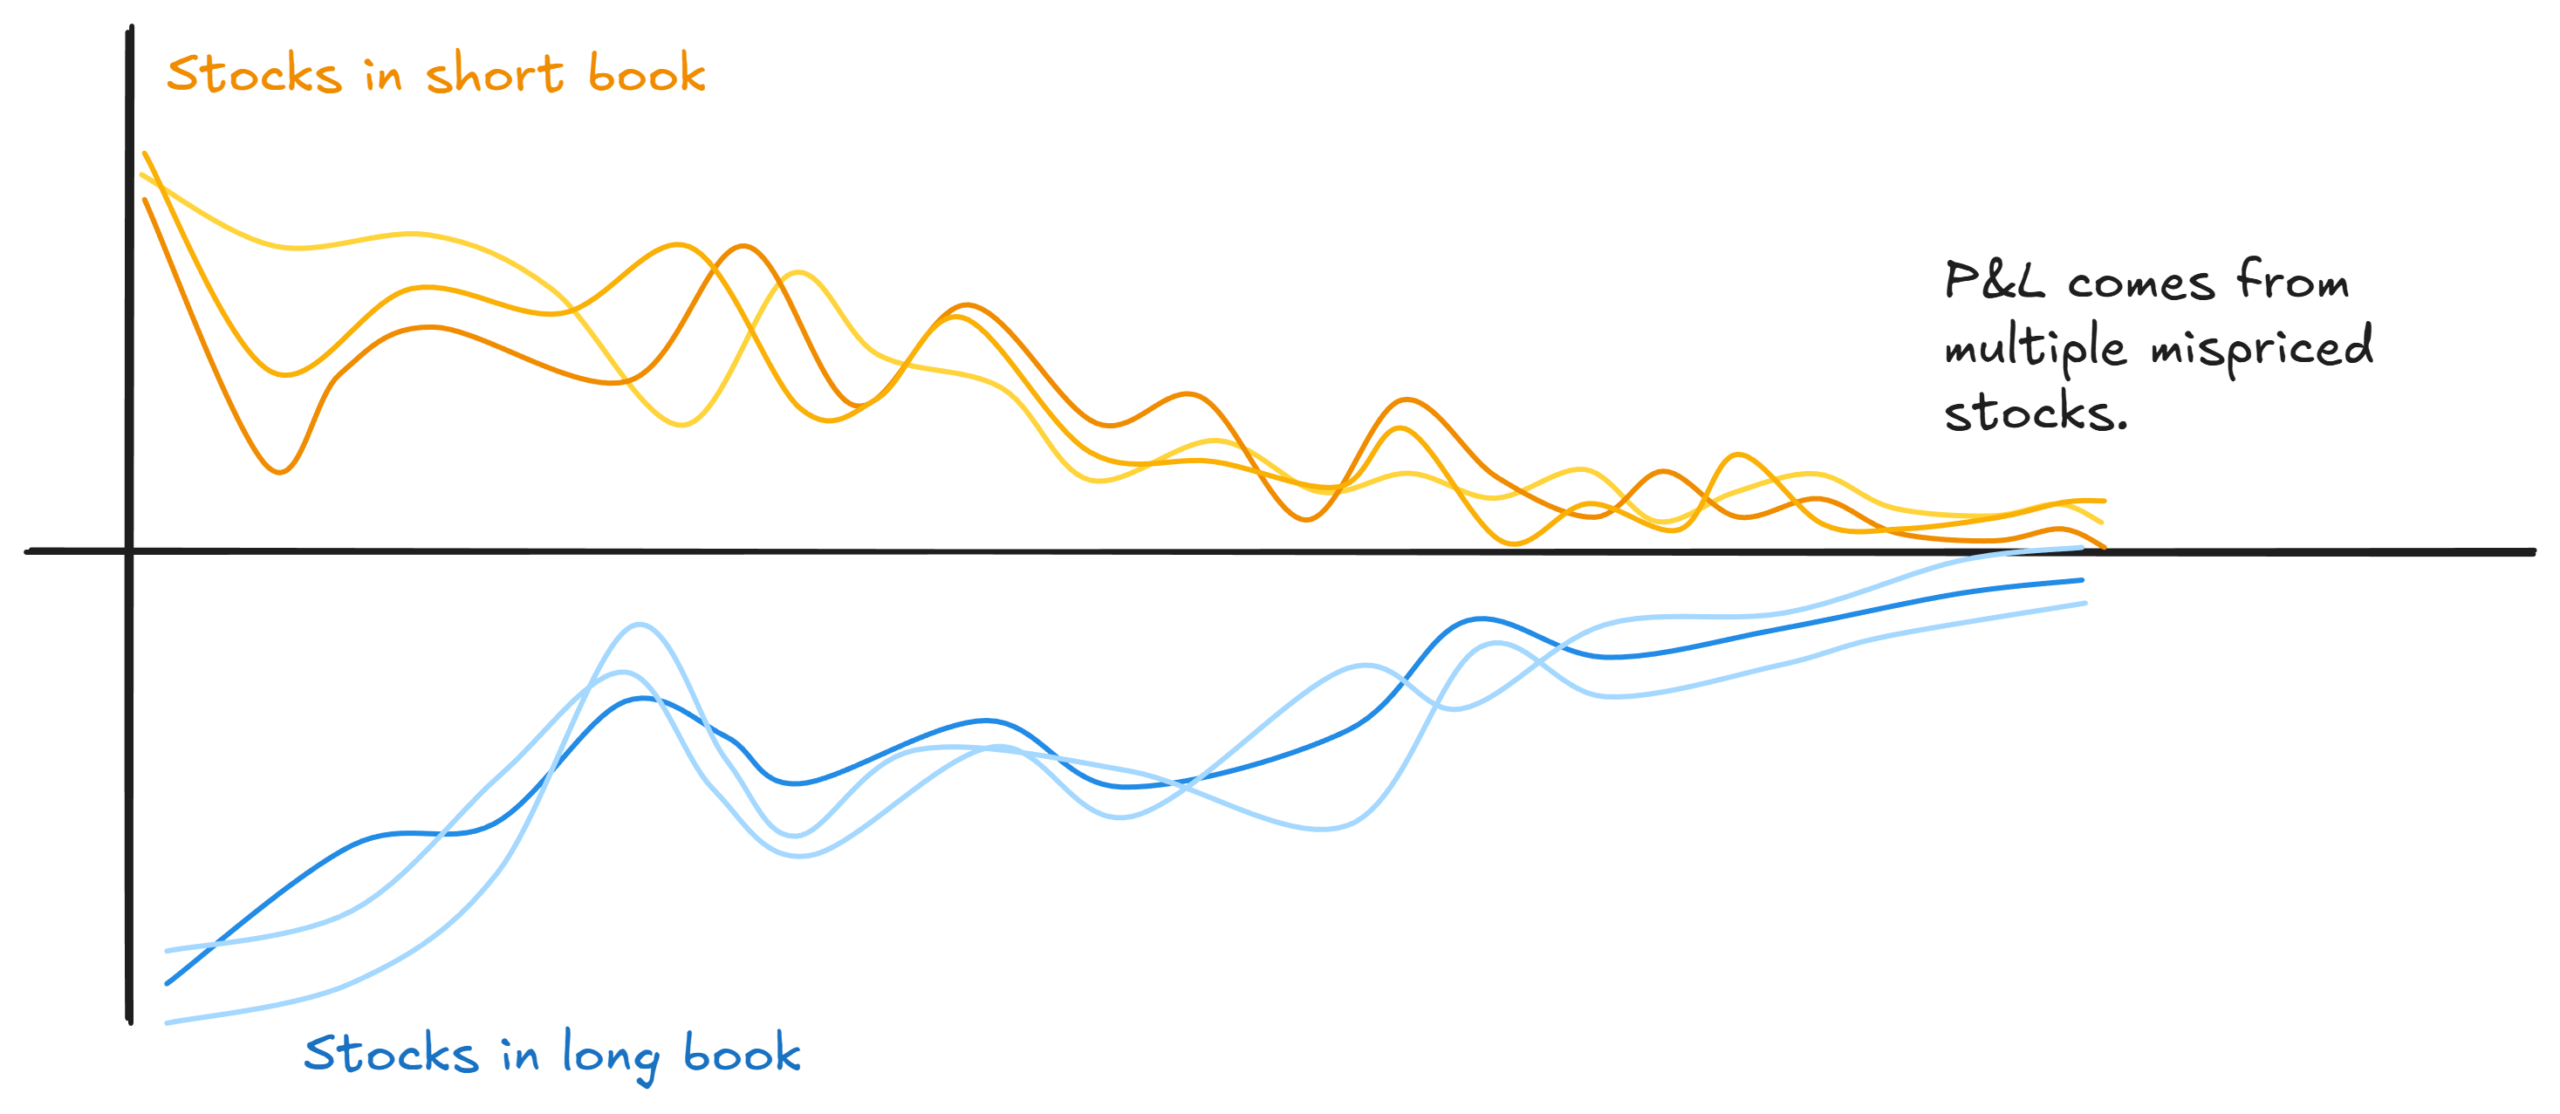
This large-scale triangulation allows traders to construct a diversified long/short portfolio. The "long book" would consist of assets identified as cheap relative to their peers across the network, while the "short book" would comprise assets deemed rich. Unlike traditional pairs trading, where a significant portion of the portfolio might be held in "fair-value hedges" that offer little independent profit potential, Triangulated Stat Arb aims to ensure that every position is actively targeting an identified mispricing.
This approach contrasts sharply with traditional pairs trading, where, as previously discussed in Part 3 of this series, half of the positions can essentially be passive hedges. By building a portfolio where each leg is a direct play on a perceived mispricing, the potential for enhanced capital efficiency and risk-adjusted returns increases significantly.
The "Flattening" Advantage: Aggregating Evidence
An intriguing insight from this methodology is that a substantial portion of the benefit can be derived simply from the "flattening" step – the process of aggregating multiple spread signals into a unified view of individual ticker valuations. The act of consolidating votes across numerous spreads naturally favors assets that exhibit consistent mispricing relative to multiple partners. This process tends to dilute the impact of random noise, allowing genuine mispricings to surface more clearly.
Essentially, by treating spreads as evidence rather than direct trading instruments, and by aggregating this evidence across a network, the system naturally builds a portfolio of potentially mispriced assets. This "pairs to portfolio" transformation represents a significant leap forward from traditional approaches.
However, the caveat remains: not all divergences are true mispricings. The base rate of price-insensitive flows causing divergences is often higher than genuine repricings, particularly when selecting appropriate pairs. This statistical advantage works in favor of traders who have mastered the art of identifying truly cointegrated or cointegrating assets.
Enhancing Confidence: The Role of Consistency
To further refine the identification of genuine mispricings, a metric called "consistency" can be employed. Consistency measures the degree of agreement across the network regarding a specific ticker’s valuation. It is calculated by converting each spread signal into a +1 (rich) or -1 (cheap) value, averaging these signals for each ticker, and then taking the absolute value of that average.
A high consistency score indicates that the network’s signals are strongly aligned, pointing decisively towards a ticker being either rich or cheap. Conversely, low consistency suggests conflicting signals, which are more likely to be noise or the result of one asset in a pair moving for reasons unrelated to the other.
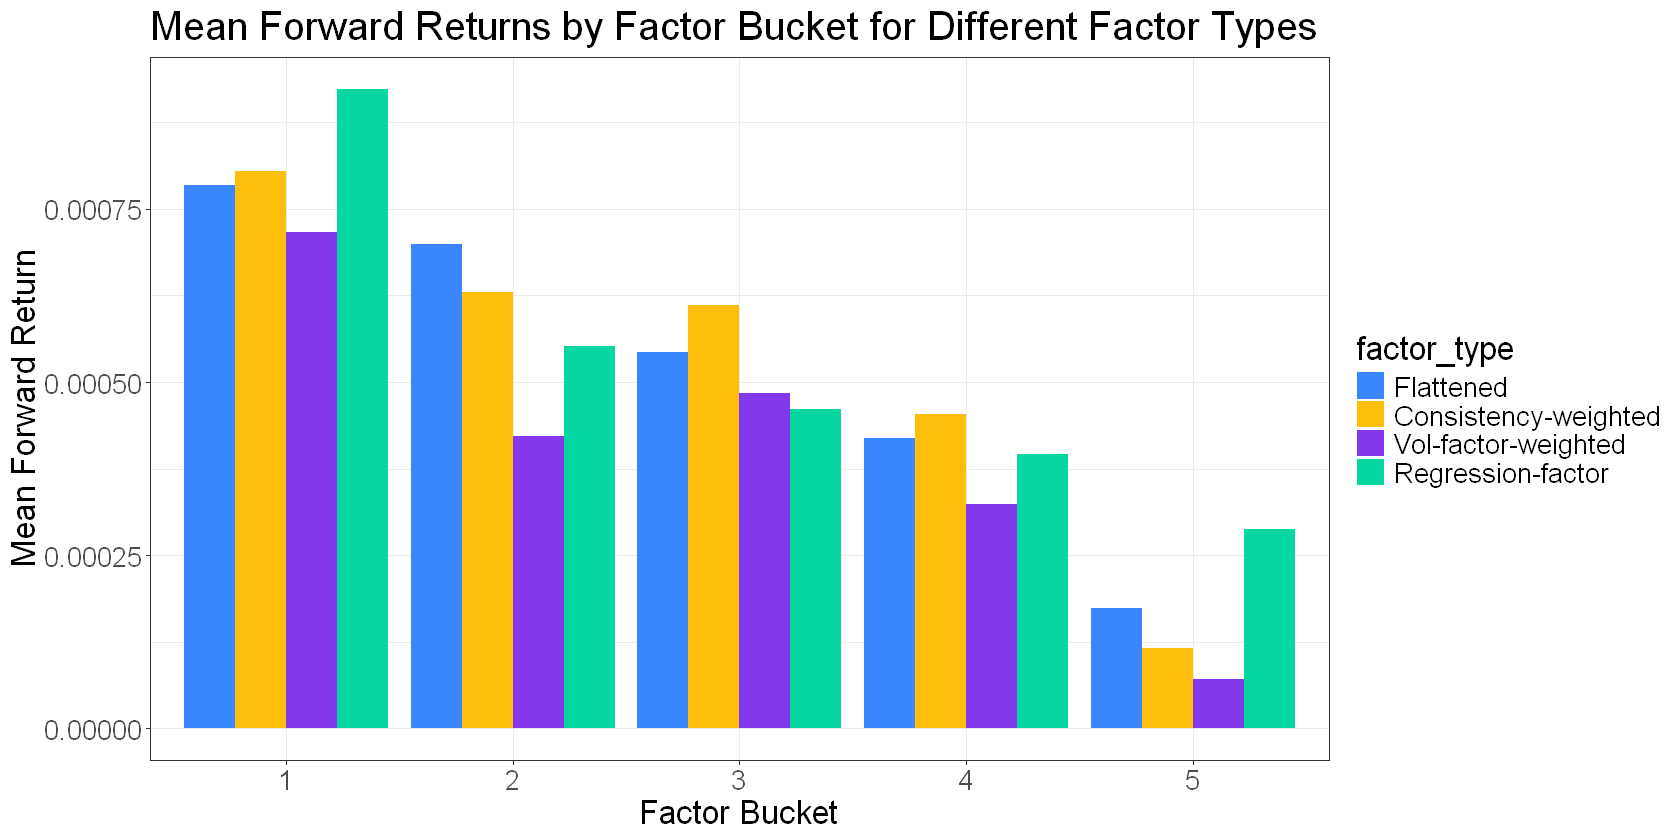
This metric is particularly useful because it helps differentiate between a strong average signal with low consistency and a moderate signal with high consistency. A ticker with a strong average signal but low consistency might be the partner of a truly mispriced asset, with the network disagreeing on its own valuation. In contrast, a ticker with a moderate signal but high consistency implies that all contributing spreads agree, suggesting a cleaner and more reliable signal. Empirical testing has shown that consistency-weighted signals often outperform simple averages, demonstrating the value of this refinement.
Beyond the Network: Separating Mispricing from Repricing
While Triangulated Stat Arb provides a robust framework for identifying potential mispricings, the critical challenge of distinguishing between temporary dislocations and fundamental repricings remains. To address this, traders can incorporate additional data sources beyond inter-stock relationships.
Volume and News Analysis: Examining volume data surrounding a price dislocation can offer valuable clues. The pattern of trading activity often differs significantly when a stock is being pushed by price-insensitive flows versus when it is repricing on genuine news. For instance, a surge in volume accompanying a significant price move might indicate informed trading activity related to new information, rather than a mere statistical anomaly.
Idiosyncratic News and Events: Tracking earnings surprises, company-specific news, production updates, or regulatory shifts directly impacting individual companies can help identify the drivers of price movements. By correlating these events with observed price deviations, traders can gain a more nuanced understanding of whether a "mispricing" is a temporary opportunity or a fundamental recalibration.
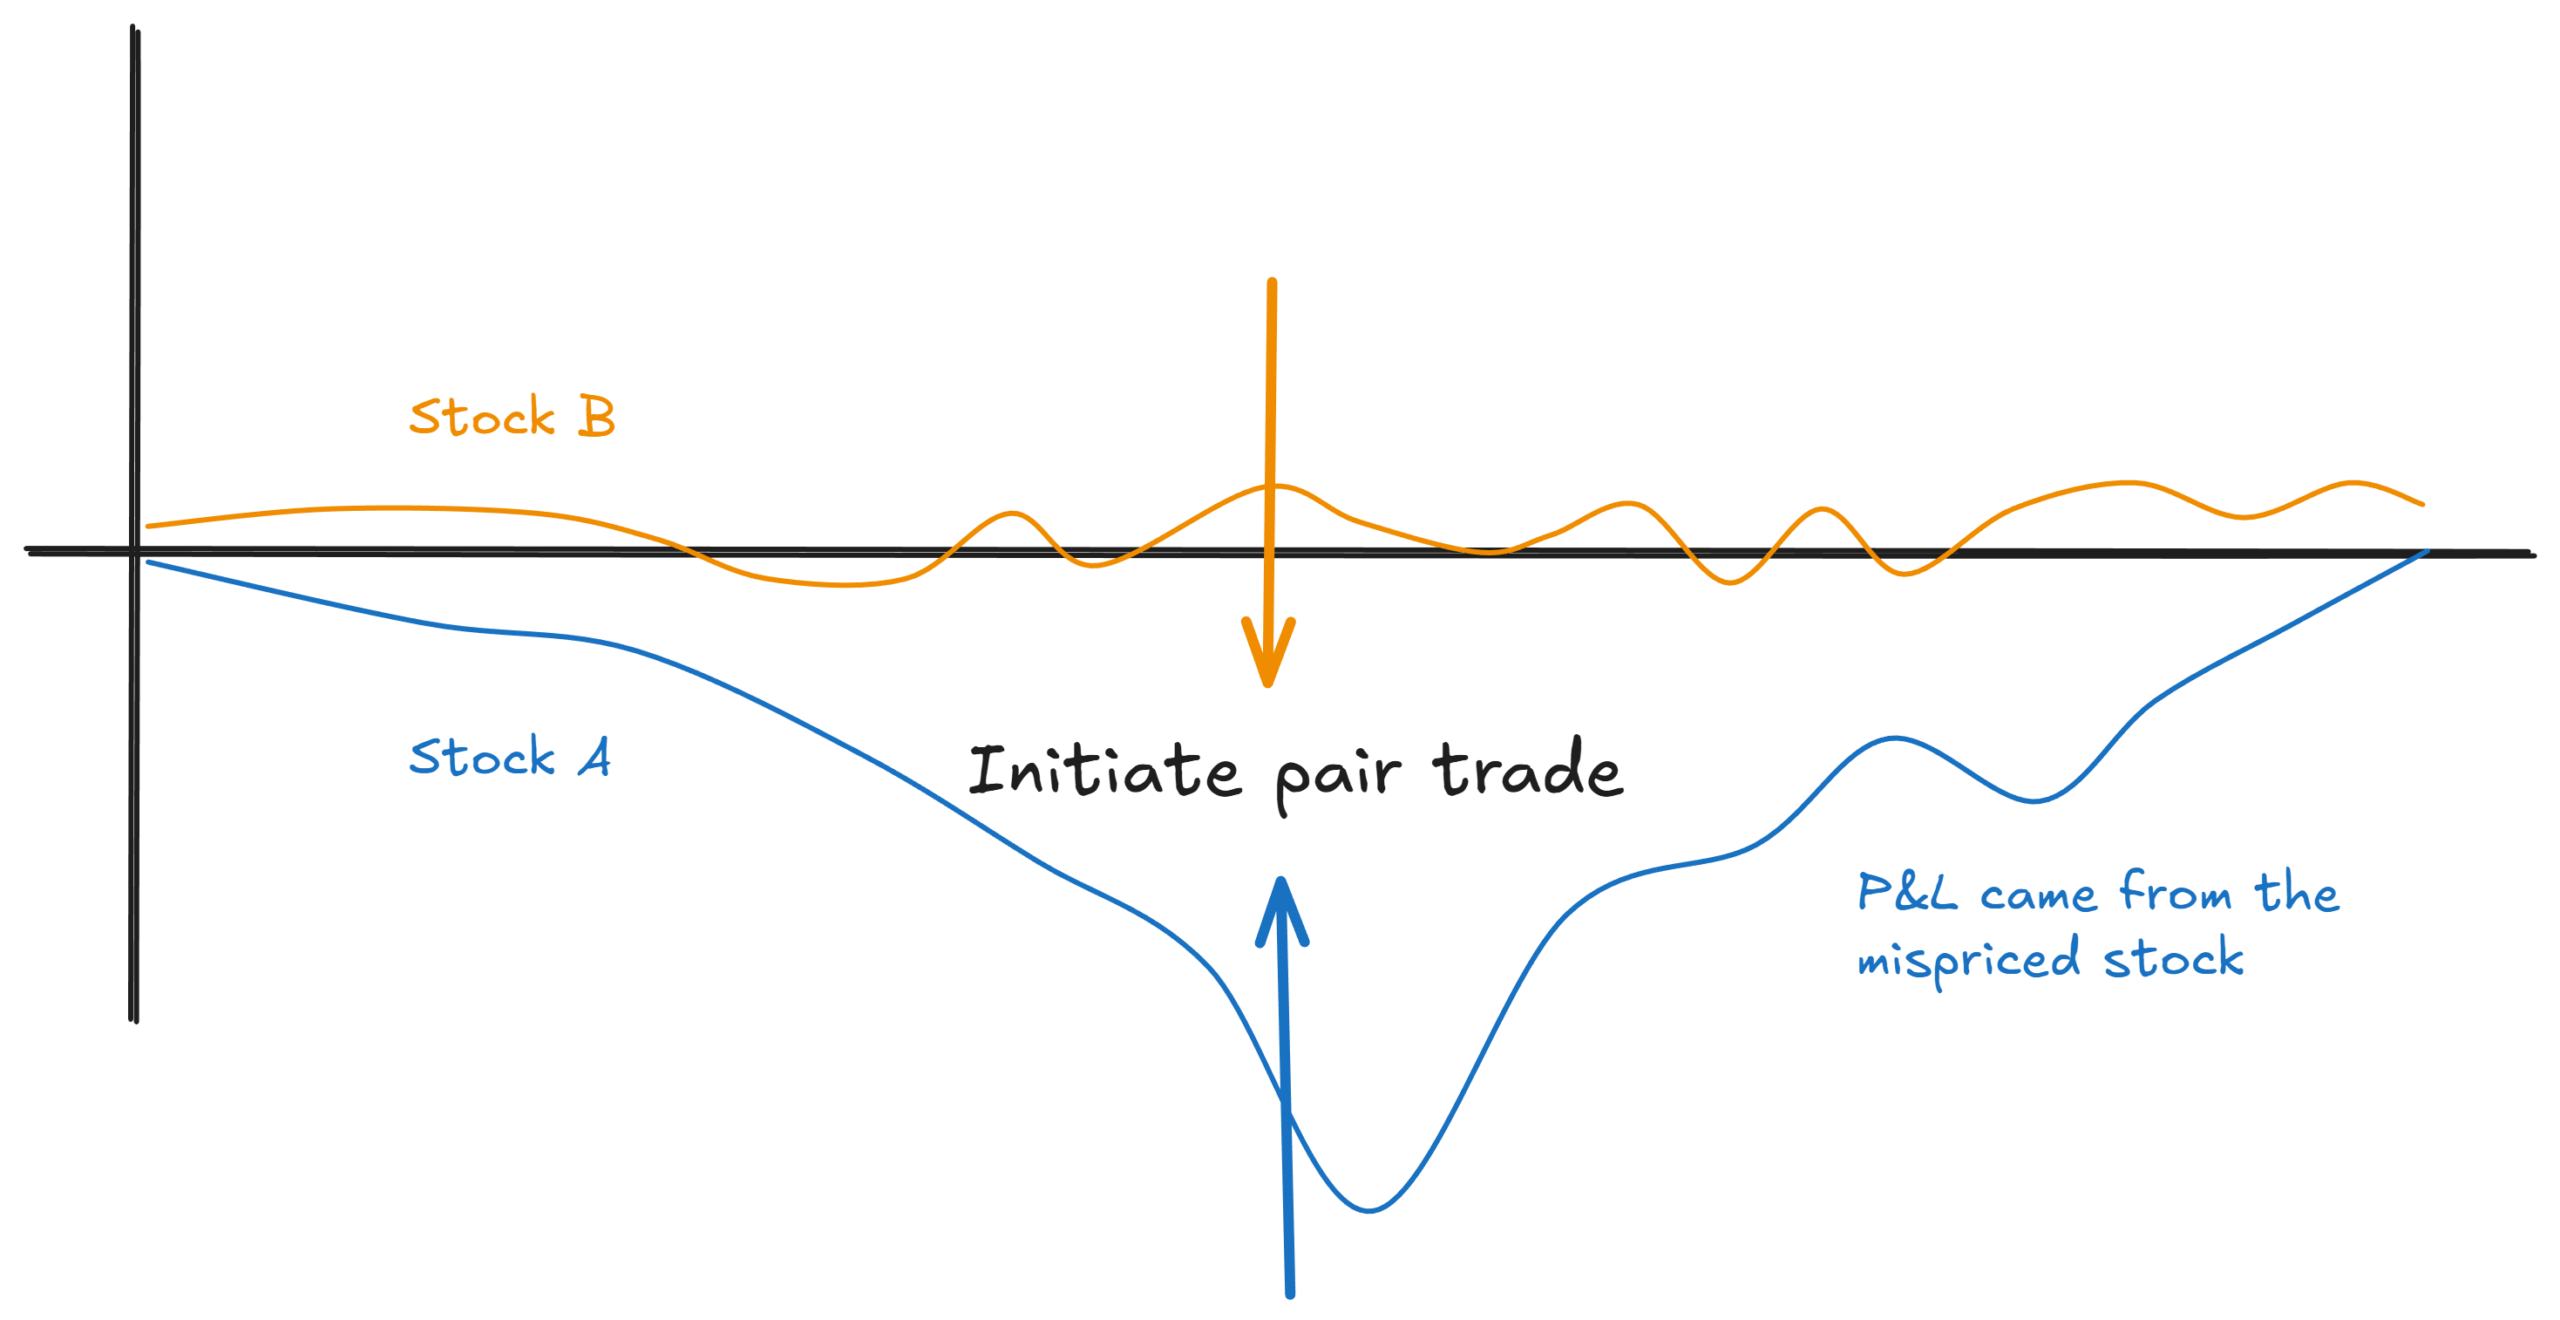
This additional layer of analysis can significantly improve the accuracy of the strategy, helping traders to avoid situations where an apparent mispricing fails to revert, leading to potential losses. While not foolproof, incorporating these "news and volume features" can provide a substantial edge.
The Mathematical Foundation: Regression and Alpha Generation
The theoretical underpinnings of Triangulated Stat Arb can be further illuminated through a regression framework. The z-score of a spread between two assets, say A and B ($z_AB$), can be expressed as the difference in their individual "alphas" ($alpha_A – alpha_B$), where alpha represents a ticker’s independent mispricing.
$z_AB = alpha_A – alphaB$
$zAC = alpha_A – alphaC$
$zBC = alpha_B – alpha_C$
The goal is to infer these individual ticker alphas ($alpha$) from the observed spread z-scores. Standard regression techniques can be employed to find the set of alphas that best explain the observed spread movements. However, advanced regression methods like Lasso and Ridge regression offer further refinements. Lasso regression, by forcing some coefficients to zero, can concentrate the identified alpha in a fewer number of tickers, potentially identifying the most significant drivers of network-wide mispricings. Ridge regression, on the other hand, shrinks coefficients towards zero, offering a more stable estimation in the presence of correlated predictors.
These regression-based factors, when incorporated into the trading strategy, can lead to more robust and concentrated signals.
Performance and Trade-offs: A Comparative Analysis
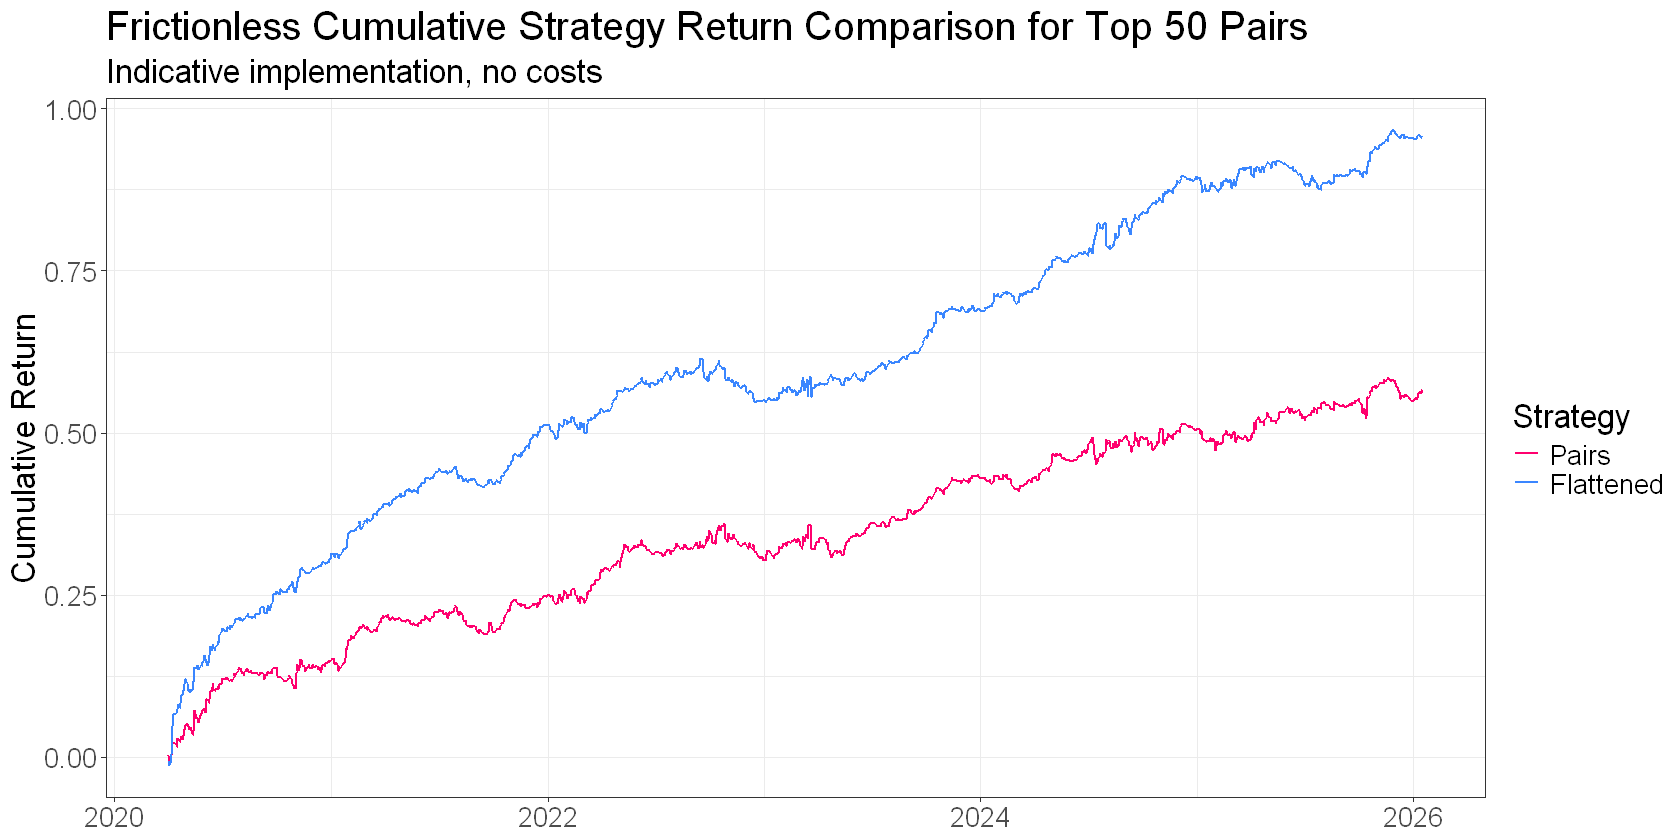
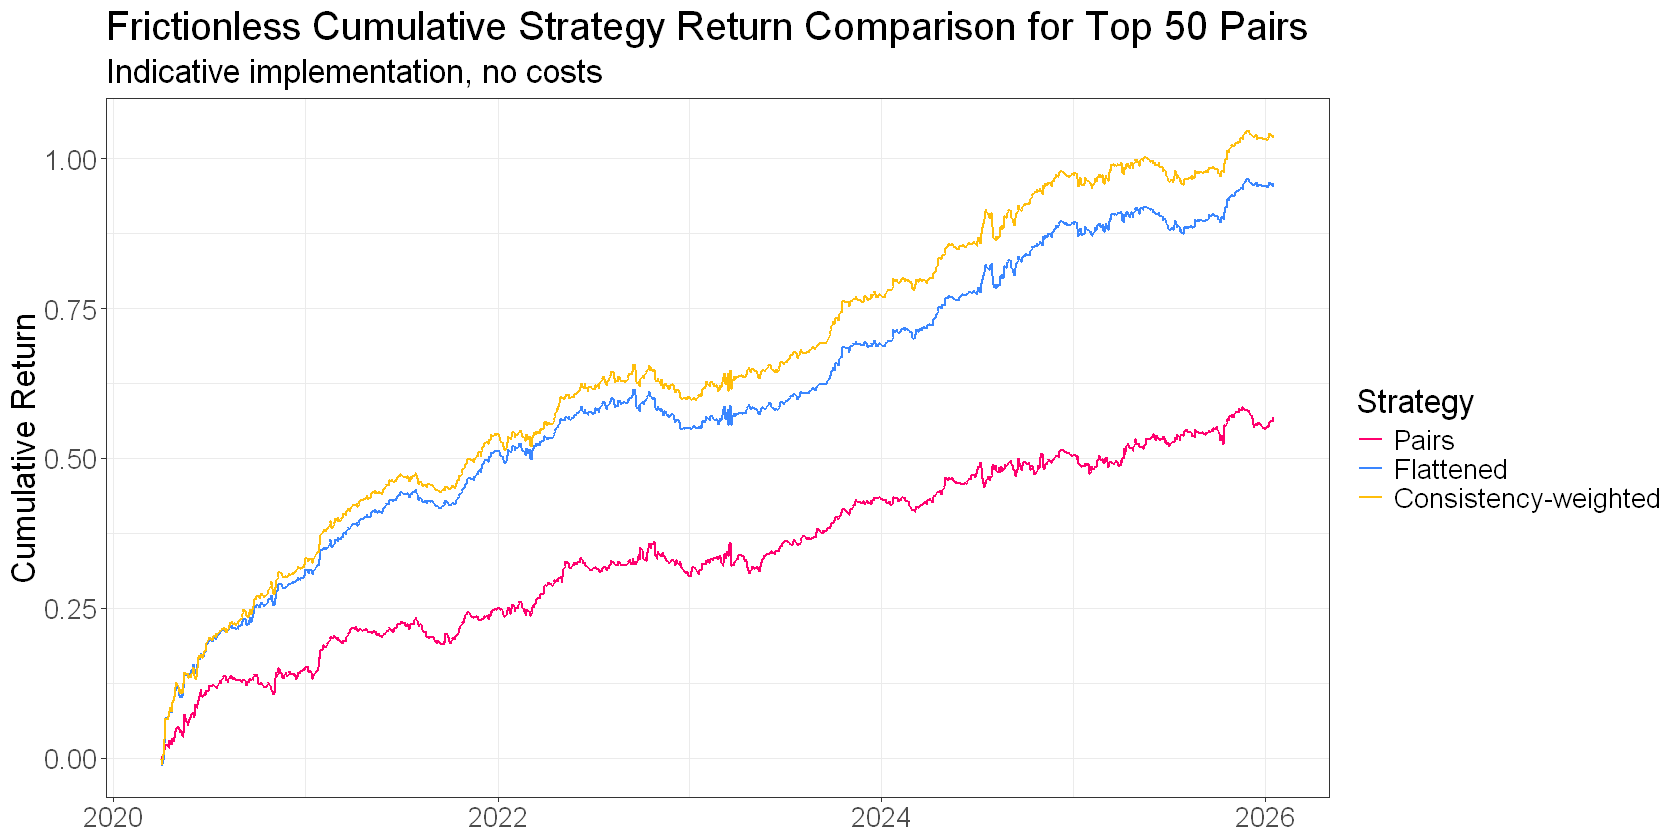
Empirical analysis of these network-derived factors, when applied to a rolling universe of top-performing pairs, reveals varying performance characteristics. While a direct backtest is beyond the scope of this overview, a high-level comparison of cumulative returns for different approaches highlights key differences:
- Traditional Pairs Trading: This serves as the baseline, representing a fundamental but often less efficient approach.
- Flattening (Network Aggregation): This initial step of aggregating spread signals into ticker-level insights demonstrates a significant performance uplift over traditional pairs trading, underscoring the power of network analysis.
- Consistency-Weighted Signals: Incorporating consistency further enhances performance by filtering out noisy signals and focusing on tickers with high agreement across the network.
- Regression Factors (Standard, Lasso, Ridge): These more sophisticated mathematical approaches can yield additional performance gains by more effectively isolating individual ticker alphas and managing portfolio concentration.
It is important to note that each of these factors comes with its own set of trade-offs. Some factors may lead to higher portfolio turnover, while others might result in more concentrated positions, requiring careful risk management. The quality of the underlying spread selection also plays a paramount role.
The most significant performance leap often comes from the transition from pairs-based trading to a portfolio approach driven by network analysis (flattening). Subsequent enhancements, while valuable, often provide incremental improvements.
The Three Pillars of Triangulated Stat Arb
Successfully implementing a sophisticated statistical arbitrage strategy relies on mastering three core components:
-
Finding Good Pairs: This is the foundational element. The ability to identify pairs of assets that exhibit a tendency to diverge and then converge in a statistically predictable manner is paramount. This involves rigorous selection criteria, focusing on fundamental relationships and historical co-movement, as explored in previous parts of this series. Without strong pair selection, even the most advanced network analysis will yield suboptimal results.
-
Identifying Mispriced Legs: This is where Triangulated Stat Arb truly shines. By flattening spread signals into ticker-level insights, utilizing metrics like consistency, and constructing a portfolio where every position targets a perceived mispricing, traders can achieve significantly improved capital efficiency and risk-adjusted returns compared to traditional methods. This transformation from individual pairs to a diversified portfolio is a key differentiator.
-
Separating Mispricing from Repricing: This is the "icing on the cake." By incorporating external data such as volume, news, and idiosyncratic events, traders can attempt to distinguish between temporary market dislocations and genuine fundamental repricings. While challenging, success in this area can lead to another significant step change in performance by helping traders avoid "dead" trades where spreads diverge but never revert.
While each component is important, their synergistic application is what creates a truly robust and profitable statistical arbitrage strategy. The foundation of good pair selection is non-negotiable. Triangulation and consistency then leverage these pairs to extract greater alpha. Finally, external data helps to mitigate risks associated with fundamental shifts.
The journey from traditional pairs trading to a fully realized Triangulated Stat Arb strategy is complex, involving numerous moving parts and subtle nuances. However, for independent traders willing to invest the time and intellectual capital, the potential rewards in terms of enhanced returns and risk management are substantial. The next steps in this exploration will delve into the practical implementation of these three pillars, showcasing what a fully resourced strategy looks like in action.