This was a hawkish meeting, with a unanimous vote for a hike and more hikes indicated.

The Federal Open Market Committee (FOMC) concluded its latest policy meeting with a decisive move, opting for a 25-basis-point interest rate hike that elevates the federal funds rate to a target range of 3.75% to 4.0%. Presiding over the meeting was Fed Chair Kevin Warsh, who has characterized these sessions as "good family fights"—a nod to the rigorous internal debate that precedes such critical monetary policy shifts. The decision was unanimous, signaling a rare moment of consensus among the 12 voting members in an environment otherwise characterized by deep uncertainty regarding inflation and economic trajectory.
The Shift in Monetary Strategy
The decision to hike rates comes as a response to persistent inflationary pressures and evidence of a surprisingly resilient domestic economy. For the bond market, the move was largely anticipated; traders had spent weeks pricing in the likelihood of a hike, creating a feedback loop where the prospect of tightening policy became the baseline expectation. While the immediate announcement provided a momentary sense of relief—causing a brief compression in bond yields—the optimism proved fleeting as the market processed the implications of a hawkish outlook.
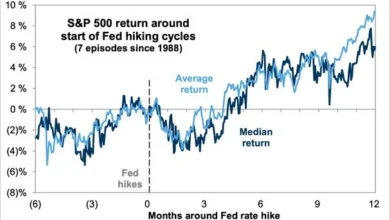
Historically, the Federal Reserve’s approach to rate cycles has often involved a series of adjustments before a pivot. One must look back to March 1997 to find the last instance of a single-hike cycle followed by a cut. By opting for a hike now, the Committee has signaled that it is likely initiating a new, sustained tightening cycle. The "dot plot"—the visual representation of FOMC members’ projections for future interest rates—supports this view, with a clear majority of participants forecasting further upward adjustments before the end of the year.
A Revised Narrative in the Policy Statement
The FOMC statement released following the meeting was notably sparse, reflecting Chair Warsh’s stated preference for eschewing explicit "forward guidance" in favor of data-dependent decision-making. Despite this brevity, the language changes from the previous July statement offer significant insight into the Fed’s evolving diagnosis of the economy.
The updated statement highlights that "economic activity is expanding at a solid pace," noting that despite geopolitical uncertainty, domestic spending remains robust. Furthermore, the Committee emphasized that productivity growth is strong and capital investment is holding steady, with job gains keeping pace with the workforce. Most tellingly, the Fed’s focus has sharpened significantly on inflation. The new statement removes references to specific "supply shocks" in energy, instead shifting toward a broader, more urgent commitment to returning inflation to the 2 percent target. This represents a pivot from the previous administration’s more nuanced, sector-specific view toward a singular, uncompromising mandate of price stability.
The "Dot Plot" and Projections
The Summary of Economic Projections (SEP), which includes the famous "dot plot," serves as the Fed’s quarterly barometer for where policymakers believe rates should head. Notably, Chair Warsh has continued his trend of not participating in these projections, reinforcing his philosophy that the Fed should not engage in the business of long-term forward guidance.
Even without his input, the 18 participants who did submit projections delivered a hawkish outlook. The median projection indicates that 12 participants expect at least one additional rate hike before the conclusion of 2026, while four participants anticipate two more. This consensus underscores a collective belief that the current policy rate remains insufficient to curb the prevailing inflationary pressures. The projections for inflation metrics within the SEP remain elevated, suggesting that the Fed expects the road to 2 percent to be longer and more difficult than previously envisioned.
Chair Warsh’s Rationale
During the post-meeting press conference, Chair Warsh provided a detailed justification for the policy shift, citing three primary catalysts that have emerged during the seven-week intermeeting period.
First, Warsh cited the "strengthening of the economy." He noted that labor market data and broader economic indicators have outperformed his initial expectations, suggesting that the economy is absorbing the current rate environment with greater ease than anticipated. Second, he addressed inflation trends, stating that the summer data failed to pass the "test" of cooling off, necessitating a more aggressive stance. Finally, he pointed to the escalation of geopolitical "hot spots." He argued that these tensions are not merely abstract risks but are actively influencing global supply chains and commodity prices, specifically noting the role of "crack spreads" in the energy sector.
"Price stability is foundational to economic growth," Warsh stated. "We took an important step today to deliver it. We did it in part by removing a dose of accommodation."
The Bond Market’s Volatile Reaction
The market’s initial reaction to the rate hike was one of temporary calm, but the tone shifted abruptly as the press conference progressed. Analysts observed that as Warsh articulated the hawkish nature of the Committee’s outlook, the initial rally in bonds evaporated. By the conclusion of his remarks, the 10-year Treasury yield had surged back to 5.0%, effectively erasing all gains made in the immediate aftermath of the announcement.
Equity markets followed a similar, albeit more erratic, trajectory. Stocks initially dipped upon the release of the statement, clawed back some losses during the start of the press conference, and ultimately settled in negative territory by the market close. This reaction suggests a growing realization among investors that the Federal Reserve is prepared to prioritize price stability over the maintenance of easy liquidity, even at the cost of higher borrowing costs for corporations and households.
Broader Economic Implications
The current economic climate is defined by a paradox: robust growth and strong employment figures are simultaneously fueling inflation, which in turn forces the Fed to raise rates. The "competition for capital" mentioned by Warsh—referencing the massive expenditure requirements of "hyperscalers" and other tech giants—is putting additional upward pressure on long-term yields.
This environment presents several challenges for the broader economy:
- Increased Cost of Capital: As the Fed moves away from an accommodative stance, the cost of borrowing for both corporate expansion and consumer debt will rise, potentially cooling the very "solid pace" of growth the Fed currently observes.
- Geopolitical Sensitivity: With the Fed explicitly linking its policy to geopolitical developments, the market must now account for the fact that international instability has become a primary driver of domestic monetary policy.
- The "Data-Dependent" Risk: By abandoning formal forward guidance, the Fed is attempting to preserve flexibility. However, this also introduces a new element of volatility, as the markets are forced to react to every incoming economic data point rather than a long-term roadmap.
As the Federal Reserve moves forward, the primary question for analysts remains whether the current rate environment will be enough to achieve a "soft landing" or if the commitment to price stability will necessitate a more restrictive policy that could tip the economy into a contractionary phase. For now, the signal from the FOMC is clear: the era of aggressive, data-driven tightening has arrived, and the committee remains united in its resolve to combat inflation as the defining challenge of the current economic cycle.