The National Bureau of Economic Research (NBER) has released Working Paper 35470, a seminal study that details a profound and troubling shift in the historical relationship between American wealth and public health. For nearly a century, the United States followed a predictable trajectory where increases in real per capita income were reliably mirrored by gains in life expectancy—a phenomenon known in economics and demography as the Preston curve. However, the new research reveals that this fundamental link effectively broke down during the 2010s. Despite continued growth in the nation’s aggregate resources and individual income levels, life expectancy in the U.S. stagnated and, in several key demographics, began a documented decline. This decoupling represents not merely a temporary fluctuation, but what researchers describe as a "weakening of institutional and social translation," where the mechanisms that once converted economic success into longer lives have ceased to function effectively.
The Preston Curve and the Historical Context of American Longevity
To understand the gravity of the findings in Working Paper 35470, one must first look to the work of sociologist and demographer Samuel H. Preston. In 1975, Preston published a landmark paper demonstrating the cross-sectional relationship between life expectancy and real per capita income. The resulting "Preston curve" showed that individuals in wealthier countries generally live longer than those in poorer countries, though the curve flattens at higher income levels, indicating diminishing returns.
For the vast majority of the 20th century, the United States was the primary exemplar of this curve. From 1980 to 2010, the U.S. followed the classic pattern: as states and counties became more affluent, their populations enjoyed longer life spans. This era was characterized by significant medical breakthroughs, the decline of smoking, and improvements in cardiovascular health, all of which were supported by a robust economic environment. During this thirty-year window, the Preston curve for U.S. states shifted upward, meaning that for any given level of income, life expectancy was higher than it had been in previous decades.
However, the data from 2010 to 2019 tells a radically different story. According to the NBER researchers, the Preston curve for the United States did not shift upward during this decade. Instead, it shifted exclusively to the right. This "rightward shift" indicates that while the population was becoming wealthier in real terms, that wealth was no longer purchasing additional years of life. This stagnation occurred prior to the onset of the COVID-19 pandemic, suggesting that the underlying causes of the U.S. mortality crisis are structural and long-standing, rather than the result of a singular viral event.

Chronology of a Crisis: From Growth to Stagnation
The researchers utilized a massive dataset, including state-level data from 1980 to 2019 and county-level data from 2000 to 2019, to map the evolution of the Preston curve. The chronology of this shift reveals three distinct phases in the American health-wealth relationship.
1980–2000: The Era of Consistent Gains
During these two decades, the U.S. experienced a relatively tight correlation between economic expansion and public health improvements. Even as income inequality began to widen during the 1980s, the "rising tide" of the economy continued to lift life expectancy across most geographic regions. Medical interventions for chronic diseases became more accessible, and public health campaigns successfully reduced the prevalence of infectious diseases and tobacco use.
2000–2010: The Slowing Momentum
While life expectancy continued to rise during the first decade of the 21st century, the rate of improvement began to decelerate in certain regions. The researchers noted that counties followed the classic Preston curve pattern during this time, but the "slope" of the curve began to change. Despite the economic shocks of the early 2000s and the Great Recession of 2008, the fundamental relationship between income and longevity remained intact, albeit under increasing pressure.
2010–2019: The Great Decoupling
This period represents the core of the modern mortality crisis. While the U.S. recovered from the Great Recession and saw steady growth in real per capita income, life expectancy hit a plateau and then began to drop. The NBER paper highlights that the Preston curves became significantly steeper during this decade. A steeper curve indicates that the gap in life expectancy between the rich and the poor grew wider. In essence, while the wealthy were still able to maintain or slightly increase their longevity, the middle and lower-income brackets saw their life expectancy gains vanish or reverse entirely.
Supporting Data: Inequality and Divergence
The NBER findings are supported by a rigorous decomposition of mortality data across sex, race, and educational attainment. One of the most striking aspects of the study is the "robustness" of the patterns observed. The reversal of the Preston curve was not limited to a specific demographic; it appeared across both male and female populations and across various racial groups.

The researchers also substituted income with educational attainment to see if the trend held. The results were nearly identical: the "education-longevity" curve also shifted right without moving up. This suggests that the crisis is not merely about the purchasing power of a dollar, but about the broader social and institutional environment that surrounds individuals of different socioeconomic statuses.
Key data points from the study include:
- State-Level Divergence: Between 2010 and 2019, states with the highest income growth did not necessarily see the highest gains in life expectancy, breaking a forty-year trend.
- County-Level Deterioration: At the county level, the researchers found that increases in aggregate resources no longer produced broad longevity gains. Instead, inequality in life expectancy by income grew at an accelerated rate.
- The Rightward Shift: The visual representation of the Preston curve from 2010 to 2019 shows a "horizontal" movement, where the x-axis (income) increases while the y-axis (life expectancy) remains flat or dips.
Analysis of Implications: The Failure of "Social Translation"
The most significant conclusion of the NBER paper is that the U.S. mortality crisis should be understood as a failure of "institutional and social translation." In a healthy society, economic resources are translated into health outcomes through various channels: access to quality healthcare, safe housing, nutritional security, social support networks, and environmental protections.
The researchers argue that these channels have weakened. The "social deterioration" hypothesis suggests that the U.S. is experiencing a breakdown in the basic social fabric that supports life. This includes the rise of "deaths of despair"—suicide, drug overdoses (particularly opioids), and alcohol-related liver disease—which have disproportionately affected working-age adults. However, the paper suggests that even these specific causes of death are symptoms of a larger problem: the inability of the American system to convert its vast wealth into a healthier population.
This failure of translation is particularly evident when comparing the U.S. to other high-income nations. While countries in Europe and East Asia have also faced economic challenges, they have generally managed to maintain the link between income and longevity, or at least have not seen the same degree of life expectancy reversal observed in the United States.
Inferred Reactions and Academic Context
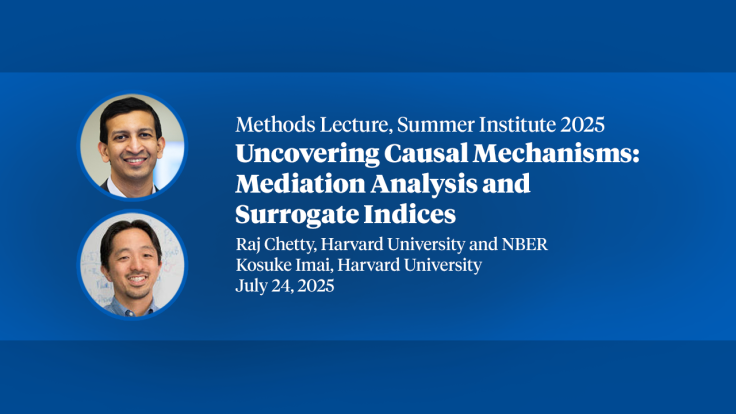
While the working paper is a standalone piece of research, it exists within a broader academic dialogue at the NBER and beyond. The mention of other recent NBER lectures—such as N. Gregory Mankiw’s discussion on the "Fiscal Future" and Raj Chetty’s work on "Causal Mechanisms"—provides context for how these findings might be received by the wider economic community.
Economists like Raj Chetty have long studied how geography and social mobility impact life expectancy. The findings in Paper 35470 reinforce Chetty’s research by suggesting that where a person lives and their socioeconomic standing are becoming increasingly deterministic of their lifespan, regardless of the national economic growth rate. Meanwhile, the fiscal implications mentioned by Mankiw are stark: if the U.S. is spending a larger share of its GDP on healthcare while life expectancy is falling, the "return on investment" for federal and state health spending is in a state of collapse. This raises urgent questions for policymakers regarding the efficiency of the American healthcare system and the need for investments in social determinants of health rather than just clinical care.
Conclusion: A Call for Institutional Reform
The NBER Working Paper 35470 serves as a definitive account of the decoupling of wealth and health in the United States. By demonstrating the reversal of the Preston curve, the researchers have provided a mathematical and economic framework for what many Americans have felt intuitively: that the country’s economic success is no longer a guarantee of a longer, healthier life for its citizens.
The implications of this study are far-reaching. If the "translation" of resources into longevity has broken down, then simply increasing the GDP or raising individual incomes may not be enough to solve the mortality crisis. Instead, the findings suggest a need for a fundamental reevaluation of the nation’s social and institutional infrastructure. Addressing the "social deterioration" mentioned in the study will require more than just medical interventions; it will necessitate a concerted effort to rebuild the community ties, economic security, and public health systems that once ensured that a wealthier America was also a healthier one. As the U.S. moves further into the 2020s, the challenge will be to restore the upward trajectory of the Preston curve and ensure that the nation’s prosperity is once again reflected in the well-being and longevity of all its people.