10-Year Treasury Yield Spikes as Inflation Spreads across Economy, Driven by Ugly Core Services CPI

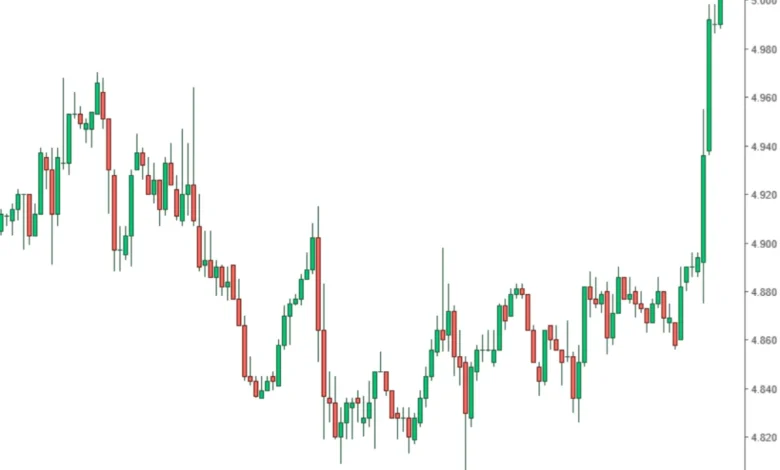
The release of the October 2026 Consumer Price Index (CPI) has sent shockwaves through global financial markets, serving as a stark reminder that the battle against inflation remains far from won. Following the announcement, the 10-year U.S. Treasury yield surged by approximately 12 basis points, reaching the psychologically significant 5.0% threshold. This immediate market reaction underscores growing investor anxiety regarding the persistence of price pressures and the potential for a "higher-for-longer" interest rate environment.
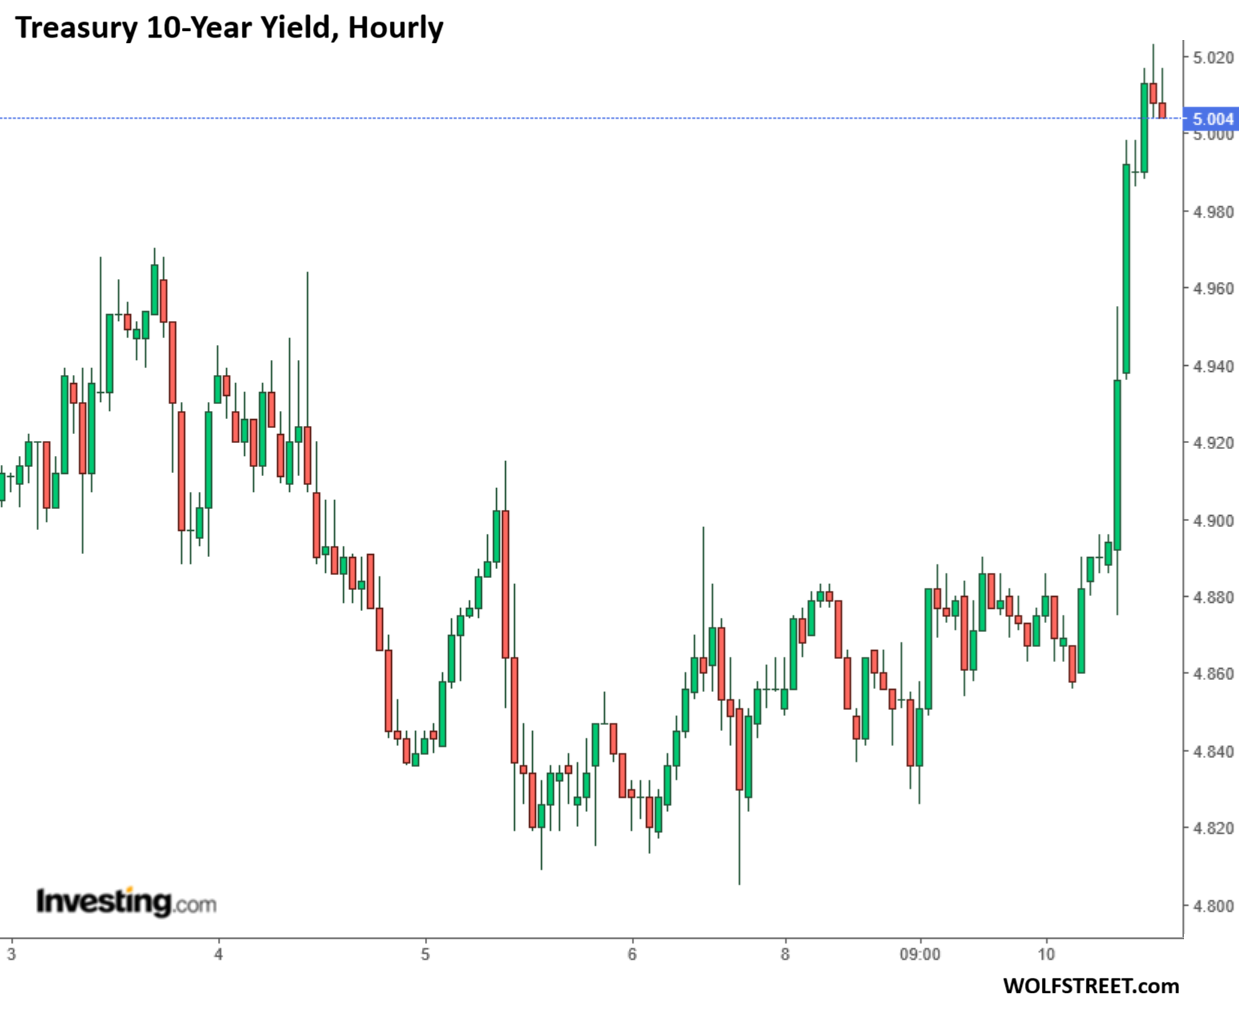
The data reveals a comprehensive inflationary environment, with price increases migrating beyond volatile energy and food sectors and embedding themselves firmly within core services. At the subsequent $42 billion 10-year Treasury note auction held hours after the release, the market demanded a yield of 5.02% to absorb the debt, reflecting a significant repricing of risk and expectations in the bond market.
A Complicated Chronology: Addressing the Data Gap
A unique technical complication overshadowed this month’s report. Due to a government shutdown in the fall of 2025 that hindered data collection, the Bureau of Labor Statistics (BLS) lacked the necessary baseline figures to publish standard year-over-year percentage changes.
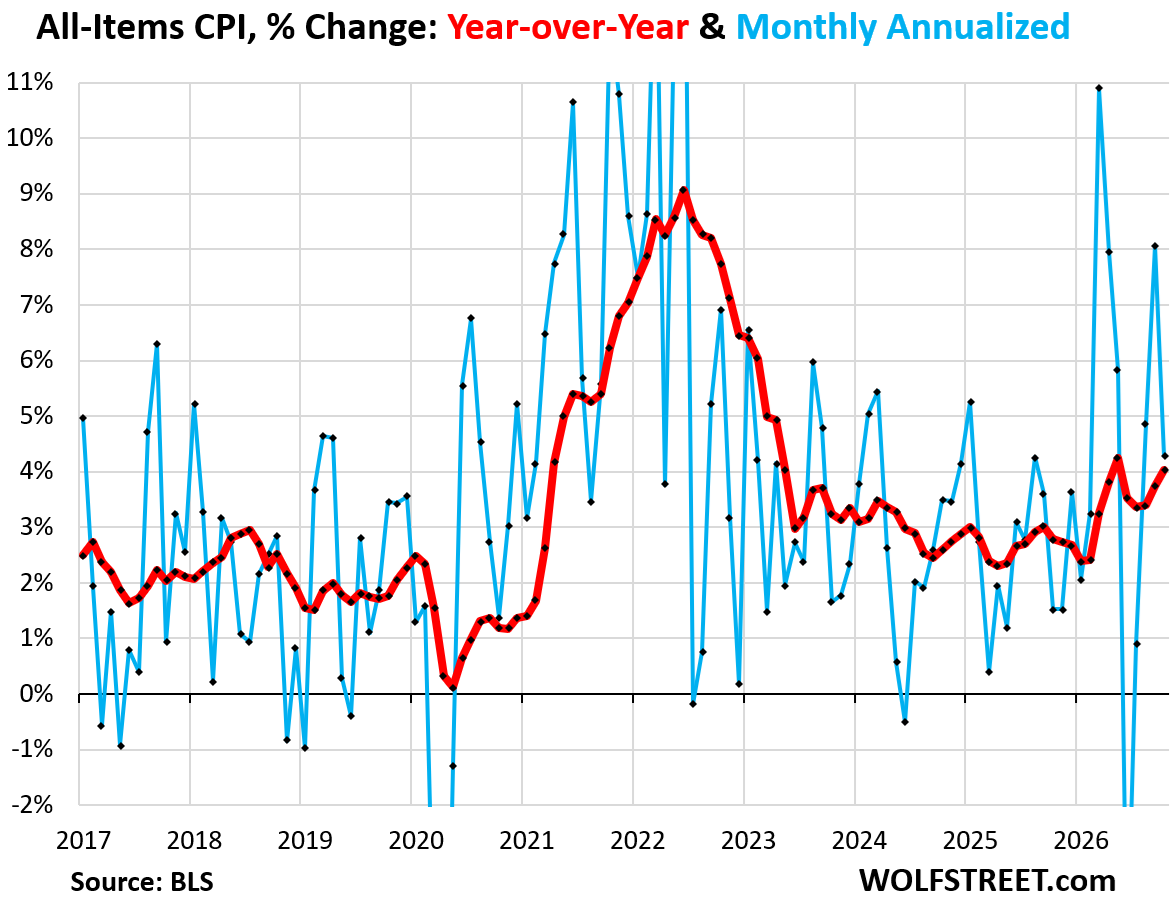
To bridge this statistical gap, the BLS employed a standard methodological adjustment, using the mean of the index values from the months preceding and following the missing October 2025 data point to create a synthetic base. Under this framework, the all-items CPI for October 2026 was calculated at a 4.0% increase year-over-year. While this adjustment provides a mathematical anchor, it highlights the lingering institutional challenges that have periodically hampered the clarity of economic reporting over the past year.
The Anatomy of Price Pressures
The October data painted a concerning picture across almost every category. The "all-items" index, which captures the total cost of the consumer basket including food and energy, rose 0.35% on a monthly, seasonally adjusted basis. This represents an annualized rate of 4.3%, signaling that inflationary momentum has not only persisted but accelerated.
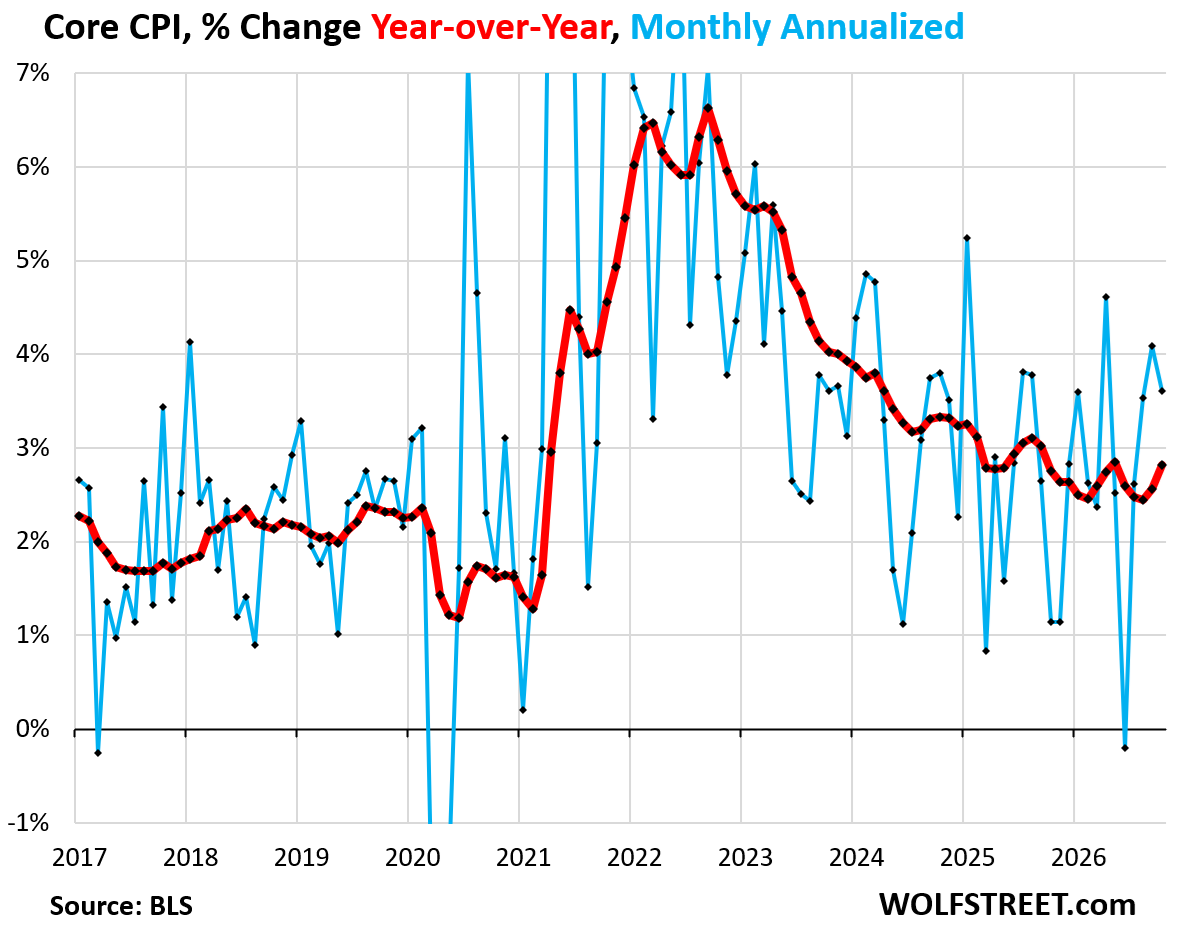
Core CPI—the metric favored by policymakers because it strips out the volatile food and energy components—rose 0.30% for the month. This puts the annualized core rate at 3.6%, marking the third consecutive month that the core reading has remained above the 3.5% threshold. Economists note that this level of core inflation is significantly elevated above the Federal Reserve’s long-term target of 2.0%, complicating the outlook for future monetary policy easing.
The Spread of Services Inflation
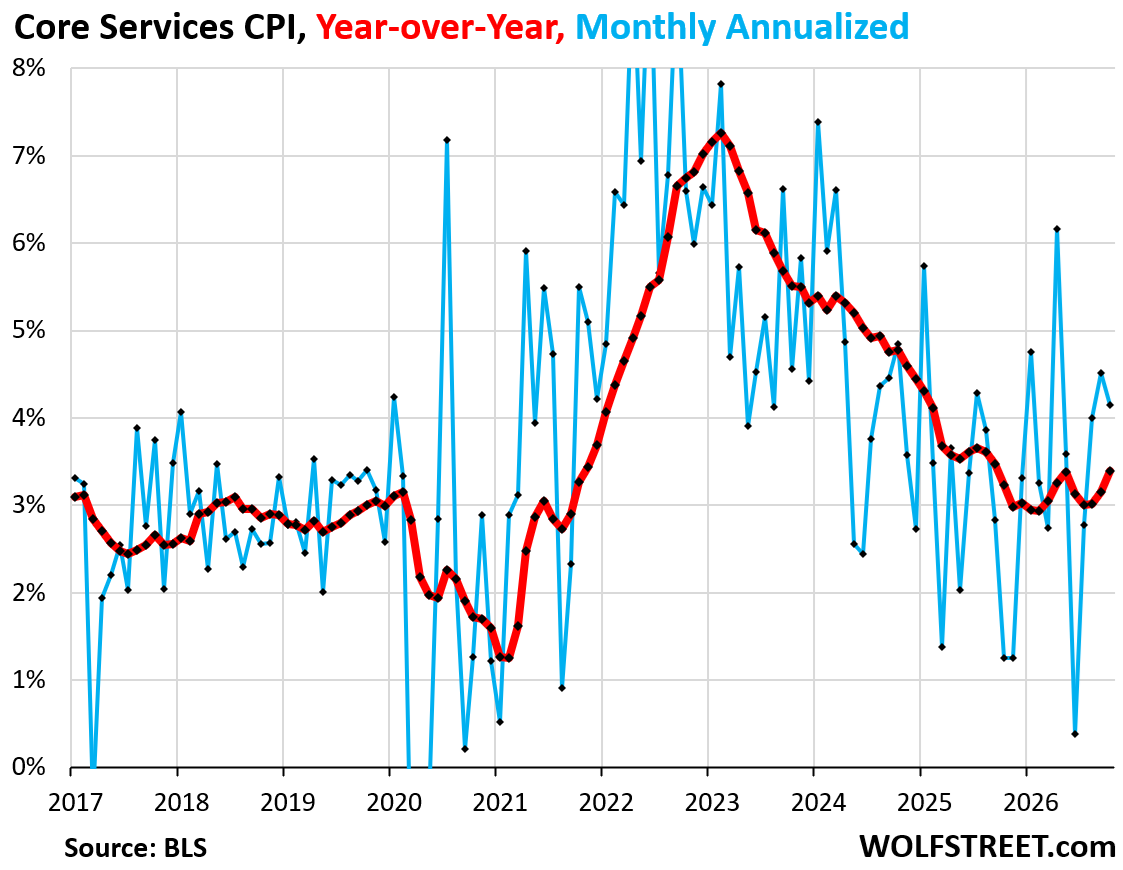
Perhaps the most alarming trend identified in the October report is the breadth of price increases within the services sector. Core services, which exclude energy utilities, rose by 0.34% month-over-month, or 4.2% on an annualized basis.
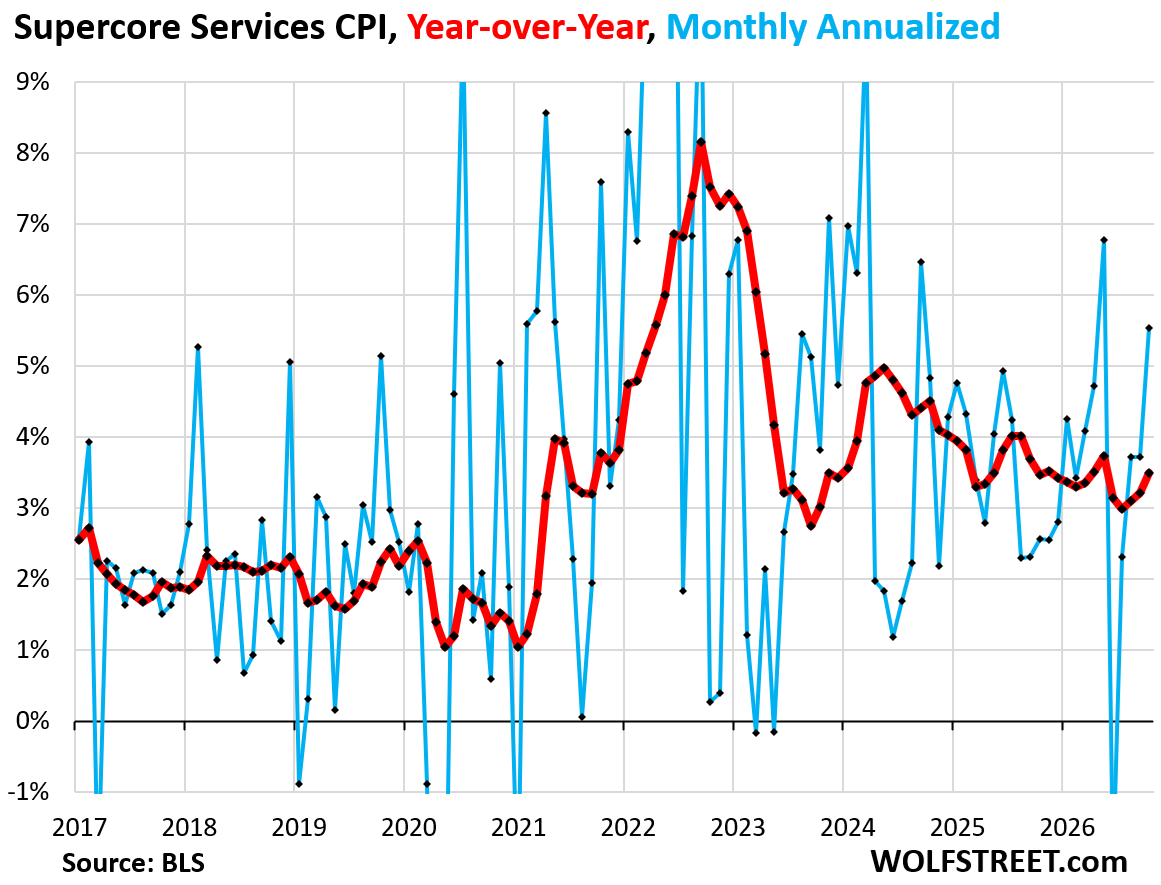
Of particular concern is the "super-core" services index, which excludes both energy and housing costs. This category, which often tracks labor-intensive services and is highly sensitive to wage growth, spiked by 0.45%—an annualized 5.5% increase. This is the second-highest monthly jump since September 2024. The data suggests that inflation is no longer merely a byproduct of supply chain bottlenecks or energy price spikes, but is instead being driven by structural factors within the domestic services economy.
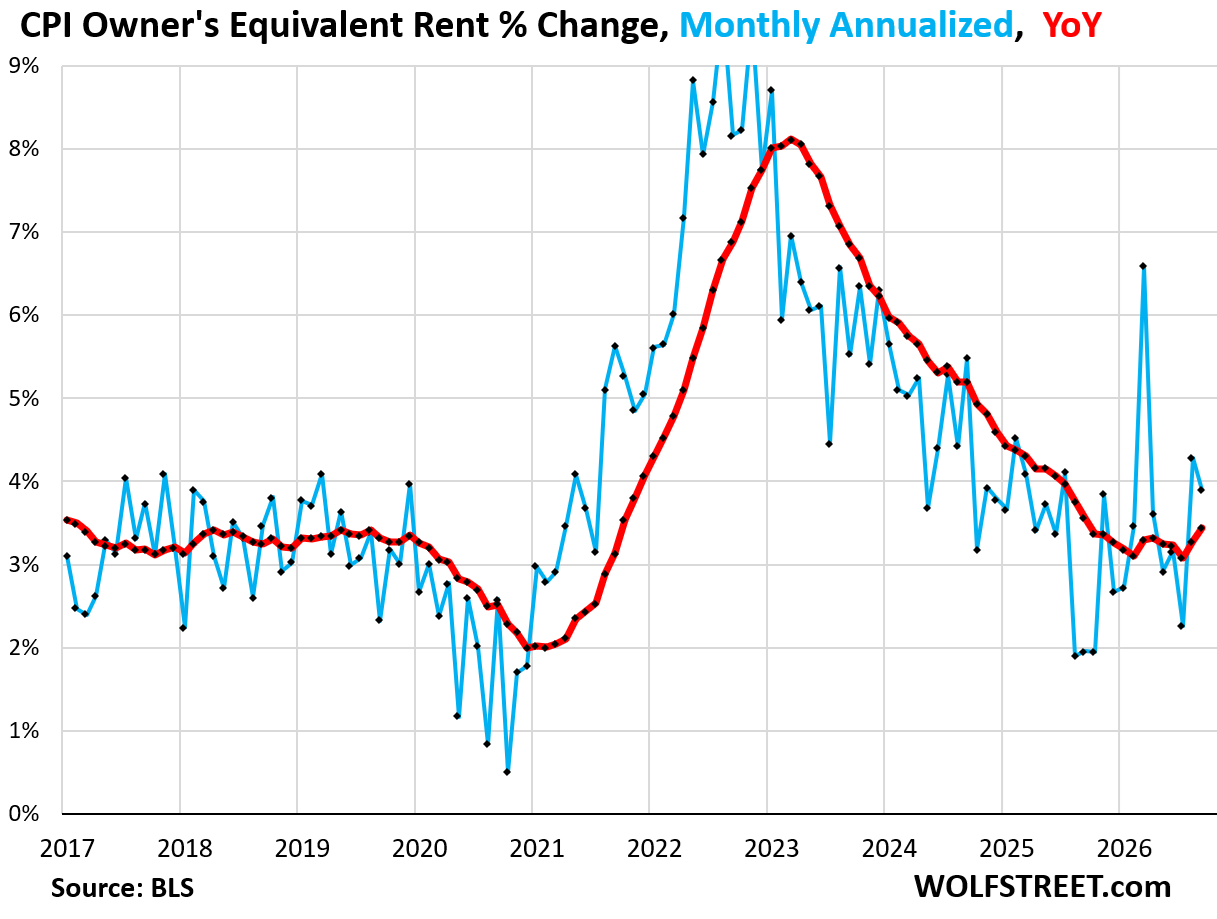
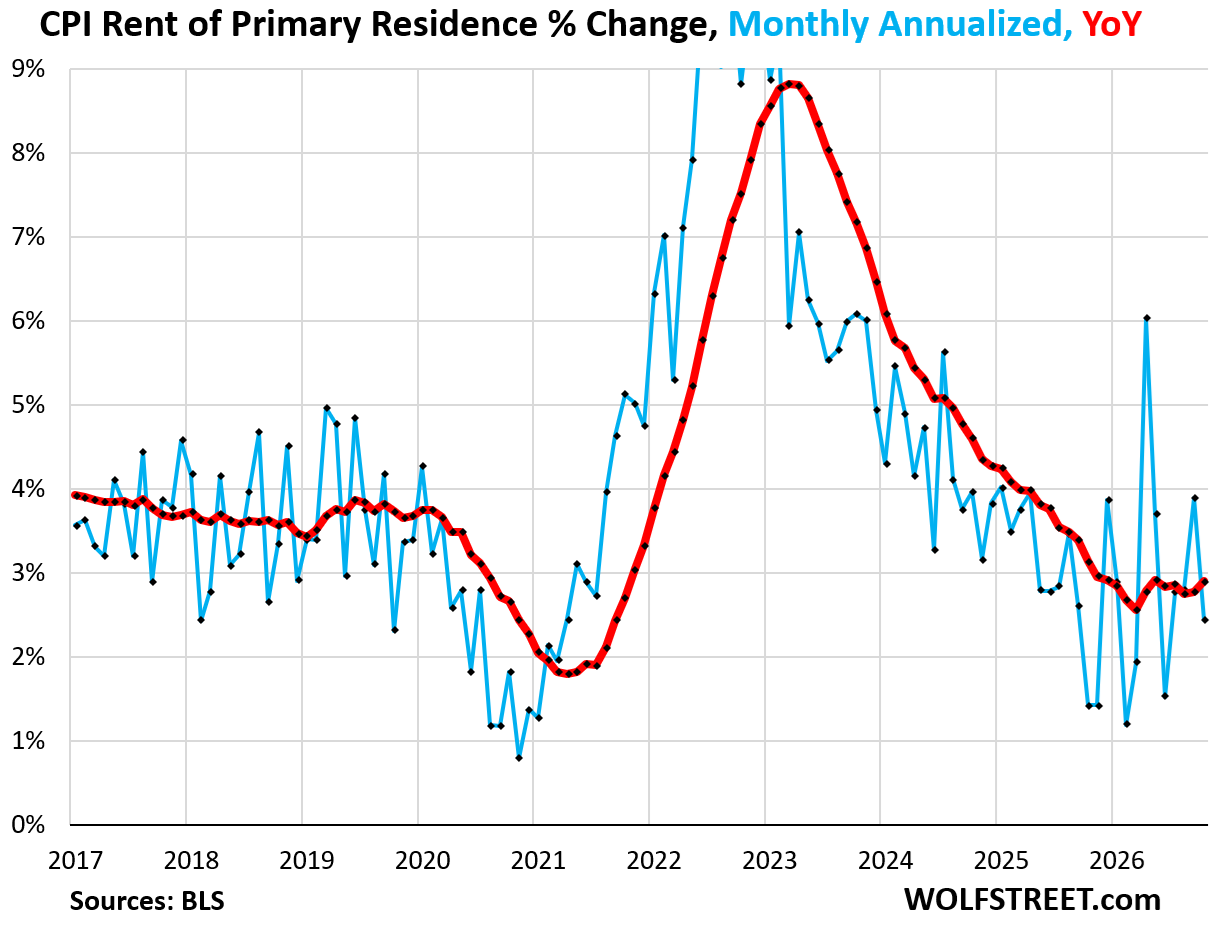
Housing services, which traditionally account for a large portion of the CPI, continued to show moderate but steady growth. The Owner’s Equivalent of Rent (OER) increased 0.32%, while the Rent of Primary Residence index rose by 0.20%. While these figures are lower than the "super-core" metrics, their heavy weighting in the overall CPI index ensures they remain a significant contributor to the persistent year-over-year headline numbers.

Core Goods: The Missing Counterbalance
Historically, core goods inflation—which covers everything from apparel to electronics—has acted as a deflationary buffer for the broader economy. Driven by global competition, technological advancement, and efficient automation, prices in this sector have often remained flat or negative.
However, the October report showed a 0.39% increase in core goods prices—the largest monthly gain since May 2023. This is a troubling development for analysts, as it suggests the traditional "counterbalance" provided by goods is failing. When both services and goods prices rise in tandem, the economy loses its shock-absorber, making the overall inflationary pressure more difficult to contain.
Energy and Food: A Sustained Burden
The impact of inflation is most visible to households in the prices of basic necessities. Food at home increased by 0.44% in October, pushing the total increase in food prices to 32% since the beginning of 2020. Similarly, the energy index rose 0.70% for the month.
While natural gas piped to the home saw a slight decline of 0.76%, the aggregate energy index remains a major driver of household cost-of-living increases. Since early 2020, energy costs have surged by a staggering 55%. These persistent increases in essential spending act as a regressive tax, disproportionately affecting lower- and middle-income families and curtailing discretionary spending power.
Market Implications and Policy Outlook
The immediate reaction in the bond market—with the 10-year Treasury yield hitting 5.0%—suggests that investors have largely abandoned hopes for aggressive near-term interest rate cuts. The market is increasingly aligning with the sentiment that inflation has become deeply entrenched in the economic architecture.
Financial analysts point to several implications of this data:
- Monetary Policy Stance: The Federal Reserve is now under increased pressure to maintain, or potentially tighten, its current interest rate stance. The persistence of "super-core" inflation suggests that restrictive conditions may be required for a longer duration than previously anticipated.
- Corporate Pricing Power: The fact that core goods and services are rising simultaneously suggests that businesses retain significant pricing power, likely due to a combination of strong consumer demand and rising input costs.
- Real Wage Growth Challenges: While nominal wages have risen over the last two years, the persistent 4% headline inflation rate erodes these gains. If the CPI continues to climb at this pace, real wage growth could turn negative, potentially triggering a decline in consumer sentiment and spending.
- Fiscal Policy Considerations: With borrowing costs rising in line with Treasury yields, the federal government faces increasing interest expenses on its own debt. This creates a feedback loop where higher interest rates increase the fiscal deficit, which can in turn contribute to further inflationary pressure.
Conclusion: A Testing Period for the Economy
The October 2026 CPI report is not merely a collection of data points; it is a signal of a shift in the economic landscape. The "ugly" results across the board—from goods to services, and from food to core items—suggest that the inflationary fire is not yet extinguished.
As the Federal Reserve and other financial institutions analyze these figures, the primary focus will remain on the sustainability of the current price trends. If the "super-core" and core goods categories continue to show upward movement, the economy may be entering a period of prolonged structural inflation. For now, the bond market has delivered its verdict: uncertainty is on the rise, and the cost of capital is adjusting to a new, higher baseline. The months ahead will prove critical in determining whether these figures are a temporary anomaly or the early stages of a more difficult, long-term economic challenge.
Related posts: