Leveraging Large Language Models for Risk Management in Algorithmic Trading

The quest for robust and consistently profitable algorithmic trading strategies has led researchers and practitioners to explore the potential of advanced artificial intelligence, particularly Large Language Models (LLMs). However, a common pitfall identified in many LLM-driven trading approaches is the inherent difficulty in accurately predicting future market returns, a task that remains elusive for even the most sophisticated models. This fundamental challenge has prompted a re-evaluation of how LLMs can be best utilized in financial markets. A notable development in this area, as detailed by José Carlos Gonzales Tanaka, involves reframing the LLM’s role from a directional market predictor to a sophisticated risk manager, dictating optimal investment allocation rather than specific trade execution.
This innovative strategy, meticulously outlined and validated, centers on empowering an LLM, specifically DeepSeek, to act as a daily risk assessor. Instead of forecasting price movements, the LLM is tasked with determining the appropriate level of investment exposure based on prevailing market conditions. This approach acknowledges the limitations of predictive modeling in financial markets and instead focuses on managing the inherent uncertainties. The system employs a monthly walk-forward loop to continuously update the LLM’s policy, ensuring its decisions remain relevant to evolving market dynamics. Furthermore, robust "hard guardrails"—volatility stops, drawdown stops, and a forced re-entry mechanism—are integrated to act as a critical safety net, preventing catastrophic losses and mitigating the risk of prolonged capital lockouts. The entire methodology has undergone rigorous out-of-sample (OOS) verification from January 2023 onward, providing a credible assessment of its performance.
Foundational Concepts and Prerequisites
To fully grasp the intricacies of this LLM-driven risk management strategy, a foundational understanding of several key concepts is beneficial. On the technical front, proficiency in Python, particularly with libraries like pandas for DataFrame manipulation and numpy for array operations in time-series analysis, is essential. Familiarity with making API calls using the requests library is also a prerequisite for interacting with LLM services. For those seeking to enhance their skills, resources such as "Python for Trading: A Step-By-Step Guide" offer comprehensive coverage of these fundamental tools.
In terms of backtesting methodology, a clear understanding of out-of-sample evaluation is assumed. This involves assessing a model’s performance on data it has not seen during its training phase, thereby providing a more realistic gauge of its future applicability. Key performance metrics such as Sharpe Ratio, Sortino Ratio, Calmar Ratio, and maximum drawdown are central to evaluating trading strategies, and a solid grasp of their computation and interpretation is expected. A valuable refresher can be found in resources like "What Is Backtesting & How to Backtest a Trading Strategy Using Python."
The strategy itself sits at the confluence of three critical ideas: market regimes, LLM-assisted decision-making, and risk-aware position sizing. Market regimes refer to distinct periods in financial markets characterized by different statistical properties, such as volatility and trend behavior. Discretizing continuous price signals into these labeled states is a crucial step, and concepts from Hidden Markov Models, as explored in "Market Regime using Hidden Markov Model," provide valuable theoretical grounding. The walk-forward loop, a core component of the backtesting process, is explained in detail in "Walk-Forward Optimization (WFO): A Framework for More Reliable Backtesting," offering insights into its role in creating more robust and reliable performance estimates.
The position-sizing layer of the strategy draws upon principles of volatility targeting and the Kelly criterion. Volatility targeting aims to maintain a consistent level of risk exposure regardless of market conditions. The intuition behind the Kelly criterion, which suggests an optimal betting fraction to maximize long-term growth, informs the approach to capital allocation. Further exploration of these mechanics can be found in "Position Sizing Strategies and Techniques in Trading." Finally, this particular blog post builds upon prior work, specifically "AI Forex Backtesting with LLM Regime Labels: DeepSeek vs KMeans in Python," which introduced the initial DeepSeek workflow. Readers unfamiliar with the concept of passing compact numeric summaries to an LLM and parsing strict JSON policy tables are advised to consult this prior work first.
The Strategic Imperative: Shifting the LLM’s Role
A significant impediment to the success of many LLM-powered trading strategies lies in the fundamental question they attempt to answer: "Will the stock go up or down tomorrow?" This direct prediction task, particularly for liquid large-cap stocks like Apple (AAPL), is notoriously difficult. As highlighted by E.P. Chan in his 2024 work, "Machine Learning in Trading," no model, whether statistical, machine-learned, or language-based, possesses a reliable edge in consistently forecasting next-day returns for such assets.
Recognizing this limitation, the strategy pivots by asking the LLM a different, potentially more tractable question: "Given what I know about how this stock has behaved in each market state over the past three years, does today’s state look like one where I should be fully invested, or should I pull back?" This reframing shifts the focus from prediction to risk assessment, acknowledging the distinction between predicting returns and predicting volatility.
DeepSeek, in this context, is fed a curated table of historical statistics for each identified market state. These statistics include the mean return, standard deviation, and a Sharpe-like score, all calculated over a relevant historical window. Based on this information, the LLM outputs a policy that dictates the investment allocation for each state. Crucially, the strategy is long-only, with allocations ranging between 50% and 100% of capital. This "calibrated, regime-aware exposure" strategy aims to navigate market uncertainties by adjusting position size rather than attempting to time market direction.
To further enhance safety and robustness, a layer of "hard guardrails" is implemented above the LLM’s policy. These guardrails act as an independent safety mechanism. If realized volatility experiences a significant spike, confirmed by an acceleration condition, or if the strategy’s equity drawdown exceeds a predefined threshold, also confirmed by trend-break indicators, the system automatically de-risks. A built-in re-entry mechanism ensures that the strategy is not permanently sidelined, even after triggering these protective measures. The entire implementation, from feature engineering and prompt design to the walk-forward backtesting loop, is meticulously detailed to provide a comprehensive understanding of the strategy’s operational logic.
Step 1: The Control Panel – Configuring the Experiment
Effective algorithmic trading system development begins with a centralized control mechanism, akin to a "control panel," where all key parameters can be easily adjusted. This approach facilitates experimentation and systematic refinement of the strategy. For this LLM-driven risk manager, three primary layers of settings are defined: data parameters, cost assumptions, and the exposure mapping that translates the LLM’s qualitative output into concrete position sizes.
Within the settings, constants such as LONG_FULL_EXP, LONG_HALF_EXP, and FLAT_EXP serve as the critical bridge between the LLM’s risk assessment and the portfolio’s actual capital deployment. These constants define the base exposure levels. Notably, FLAT_EXP is set to 0.5, not 0.0. This deliberate choice reflects the strategy’s philosophy: when the LLM signals caution, it implies a reduction in exposure rather than a complete exit from the market. This "floor" of 50% capital participation ensures the strategy remains engaged with the market’s positive drift, even during periods of uncertainty, thereby preserving potential upside participation. For instance, during a strong bull market such as that experienced by AAPL between 2023 and 2026, a complete cash exit on every cautious signal could have significantly hampered compound annual growth rate (CAGR), potentially costing around 10 percentage points. The 0.5 floor mitigates this by maintaining market participation while still signaling the LLM’s risk-off sentiment.
Settings like MAX_FLAT_DAYS and REENTRY_SIZE are specifically designed to address a subtle but potentially devastating issue known as the "guardrail deadlock." This problem, which can silently cripple a strategy’s performance, will be discussed in greater detail when the guardrail logic is examined in Step 7.
Step 2: Data Integrity – The Foundation of Trading Strategies
The adage "no data, no strategy" holds paramount importance in algorithmic trading. However, simply acquiring data is insufficient; it is crucial to obtain the right data, especially for assets with a complex history. For a stock like AAPL, which has undergone multiple stock splits since 1990, data accuracy is critical for all subsequent calculations.
The auto_adjust=True flag during data retrieval is non-negotiable. Without this setting, days with stock splits would manifest as enormous, artificial return spikes. These distortions would contaminate all downstream calculations, including rolling volatility, z-scores, and trend scores, rendering them unreliable. To preemptively address such issues, a critical sanity check is implemented immediately after feature engineering. This defensive measure, requiring only two lines of code, has proven instrumental in preventing backtests from yielding completely erroneous results by identifying and flagging data anomalies.
Step 3: Feature Engineering – Decoding Market Sentiment
Raw price data indicates the market’s position, but engineered features reveal its underlying "mood" or state. This strategy computes seven distinct signals derived from Open, High, Close, and Volume (OHLCV) data. The overarching objective of these features is to encapsulate the current market state in a compact and interpretable format.
The authors encourage further exploration and incorporation of additional features and technical indicators, such as those available in the ta-lib library. An installation guide for ta-lib in Python is readily accessible for those wishing to expand their analytical toolkit.
Step 4: Discretizing Market States – From Continuous to Categorical
Working with continuous features can be challenging for reasoning and leads to an overwhelming number of potential combinations. To address this, each signal is categorized into two or three distinct bins. These binned signals are then combined to form a single, comprehensive "state string." This process results in a manageable set of 12 distinct market states, which is small enough for the LLM to process effectively while ensuring each state has a sufficient number of historical examples for robust analysis.
Several design choices enhance the adaptability of this state discretization. The volatility threshold, for instance, employs a rolling 252-day median rather than a fixed value. This makes the threshold adaptive across different market regimes and historical periods. What might have been considered "high volatility" in the low-volatility environment of 2017 would be considered "normal" in the post-COVID era. The rolling median approach automatically accounts for these shifts.
The resulting state strings are intentionally designed to be human-readable. When these descriptive strings are presented to DeepSeek, the model can leverage its extensive world knowledge to infer the historical implications of conditions like "trending upward in a calm, overbought market" for risk. This qualitative judgment is precisely the type of insight desired from the LLM.
Step 5: The LLM Risk Manager – Constructing the Policy Table
This stage represents the core of the strategy, where the LLM is tasked with generating an investment policy. Once a month, DeepSeek is prompted to analyze historical statistics for each market state and output a policy table. This table specifies, for each state, whether the investment should be fully invested, partially invested, or scaled back.
A pivotal design decision lies in how the task is framed for the LLM. While one might consider a strategy that asks the LLM to directly predict market direction (LONG/SHORT/FLAT), research and practical experience indicate that this approach is prone to failure. The most effective framing positions the LLM as a risk manager, not a forecaster.
Computing State Statistics
The first step involves computing the statistics that the LLM will use for its reasoning. A function is employed to calculate these statistics, incorporating a one-day lag to prevent lookahead bias. Specifically, the market state observed at the close of day t-1 is used to inform predictions about the return on day t.
The sharpe_like column within these statistics is arguably the most critical. A strongly positive value historically indicates that when the market was in a particular state, AAPL tended to exhibit favorable risk/reward dynamics on the following day. Conversely, a strongly negative value suggests the opposite, while a value close to zero implies that the historical evidence is inconclusive.
The Prompt: Framing the LLM as a Risk Manager
The system prompt is the embodiment of the strategy’s underlying philosophy. Each sentence is carefully chosen for its impact on the LLM’s output. Three guiding principles inform this prompt design:
-
Explicit Task Reframing: The prompt clearly states what the model should not do before defining its actual task. Phrases like "Your job is NOT to predict tomorrow’s price direction" are crucial because language models are highly sensitive to task framing. Without such explicit guidance, models can easily revert to their default tendency of attempting direction forecasting.
-
Default to Action, Penalize Inaction: The prompt includes a "Default bias: LONG. Most states should be LONG." instruction. This counteracts the LLM’s natural inclination towards conservatism when faced with uncertainty. In a long-only strategy on a stock with a positive long-term drift, maintaining a "flat" or zero-exposure position incurs a real opportunity cost – the missed positive expected return of the market.
-
Strict JSON Output with Retry: Requesting strict JSON output and providing a precise schema prevents the model from including extraneous prose that could disrupt parsing. A retry mechanism and an increased
max_tokenslimit (set to 2000) are also incorporated. Earlier versions, with a token limit of 900, would sometimes truncate responses mid-JSON, leading to silent parsing failures.
A valuable pro-tip for practical implementation is to always cache LLM responses. The cache key incorporates essential identifiers like the month, symbol, model name, and a version tag (e.g., ‘longonly-v1’). This caching mechanism ensures that re-running backtests does not incur additional API calls once the cache is populated. The cache itself is a simple JSON dictionary, allowing for direct inspection of the LLM’s monthly decisions.
Step 6: From Policy to Position – Sizing with Volatility Targeting
The LLM’s output is a qualitative judgment: "LONG full," "LONG half," or "FLAT." This must be translated into a quantitative measure – the fraction of capital to invest. This conversion occurs in two stages: first, mapping the LLM’s action to a base exposure level, and second, scaling that exposure based on volatility targeting.
Exposure Mapping
This mapping defines the strategy’s personality. The three defined exposure levels (1.0 for full, 0.8 for half, and 0.5 for flat) dictate how aggressively the LLM’s risk signals translate into actual position changes. These are tunable parameters within the settings cell. For example, if the LLM is observed to be excessively cautious, leading to frequent "FLAT" signals, increasing FLAT_EXP to 0.6 can keep more capital invested without altering the core prompt.
Volatility Targeting
Volatility targeting aims to maintain a roughly constant level of risk contribution from the strategy, irrespective of the prevailing market regime. For instance, if AAPL’s realized volatility is 0.30 (indicating a stressed market) and the TARGET_VOL is set to 0.25, the scaling factor becomes approximately 0.25 / 0.30 ≈ 0.83. This means the strategy automatically holds a slightly reduced position. Conversely, when volatility is lower, at 0.15 (a calm market), the scaling factor would be approximately 0.25 / 0.15 ≈ 1.67. However, a MAX_LEVERAGE cap of 1.0 ensures that the strategy never applies leverage, regardless of the volatility targeting calculation.
Momentum Tilt
An additional overlay is applied to further refine position sizing. This involves a +/- 15% tilt based on the 63-day momentum, applied before the MAX_LEVERAGE cap. If the 63-day cumulative return is positive (indicating an uptrend), the position size is scaled up by 15%. If it is negative (indicating a downtrend), it is scaled down by 15%. This "momentum tilt" imbues the strategy with a bias towards trending markets without altering the LLM’s fundamental qualitative judgments.
The final position is assembled in the build_agent_positions function. This function also incorporates state_lag and vol_lag to ensure that the first day of each month is not artificially forced into a flat position due to the continuous nature of the walk-forward loop.
Execution Timing Note: The position calculated at time t, denoted as pos[t], represents the position held during day t and is determined at the close of day t-1. This position directly earns the return ret[t], without any further shifts. This constitutes a single-lag execution model: the state is observed at the close of t-1, the position is set, it is held through the close of day t, and the return for day t is collected. This model strictly avoids lookahead bias.
Step 7: Hard Guardrails – Safeguarding Against the Unexpected
While the LLM provides sophisticated risk management based on historical patterns, financial markets can exhibit unprecedented behavior—flash crashes, unexpected macroeconomic events, or sudden liquidity crises. Hard guardrails serve as a critical, independent safety net that operates irrespective of the LLM’s decisions.
The strategy incorporates three primary triggers for overriding the LLM’s position:
-
Volatility Stop: This trigger activates if realized volatility exceeds a predefined
vol_stopthreshold AND short-term volatility (measured byvol5) surpasses 80% of thevol_stopthreshold. This "acceleration condition" requires both a sustained increase in volatility and a rapid uptick to prevent false exits during temporary, single-day vol spikes that quickly revert. Upon activation, the position is immediately cut to zero. -
Drawdown Stop: This trigger is activated if the strategy’s equity has declined by more than a
dd_limitfrom its peak AND the market trend is demonstrably broken. Trend confirmation is assessed by checking if the 63-day momentum is negative AND the current price is below the 50-day moving average. This trend-confirmation filter is designed to prevent premature exits during typical bull-market pullbacks where drawdowns are transient. -
Cooldown: Following the activation of either the volatility stop or the drawdown stop, the strategy remains flat for a specified
cooldown_days.
A "warning zone" is also implemented. If the drawdown exceeds 60% of the dd_limit (a softer threshold), the current position is halved instead of being exited entirely. This creates a tiered response: a warning at 60% of the limit, a hard stop (exit plus cooldown) at 100%, and a forced re-entry mechanism after MAX_FLAT_DAYS.
The Guardrail Deadlock Problem and Its Resolution
A subtle but critical bug, the "guardrail deadlock," can plague many drawdown-stop implementations and has the potential to silently destroy a strategy’s performance. This scenario unfolds as follows:
- The drawdown stop is triggered, setting the position to zero.
- With a zero position, the strategy’s equity effectively freezes, as there are no returns being generated.
- The peak equity value remains unchanged and is now significantly above the frozen equity.
- The drawdown check fires again on the next trading day. Since equity is still frozen and the peak remains high, the drawdown condition is still met.
- The position is set to zero again, and the cycle repeats indefinitely, locking the strategy in a perpetual flat state.
The implemented fix for this deadlock is a re-entry counter. After MAX_FLAT_DAYS (set to approximately 10 trading days, or two weeks), a "re-entry gate" opens. The strategy then resumes trading at its full intended size (calculated as REENTRY_SIZE=1.0 multiplied by the agent’s proposed position). Once re-entered, equity begins to accrue again. This allows the equity to either recover above the drawdown threshold or trigger another 20-day wait if the drawdown condition persists. Crucially, this mechanism breaks the deadlock, ensuring the strategy can resume its operations.
Monthly Guardrail Re-optimization
The thresholds for the guardrails—vol_stop, dd_limit, max_delta, and cooldown_days—are subject to a grid search on the training window every month. This monthly re-optimization aligns with the LLM policy cadence, ensuring that the risk gates are consistently adjusted to reflect the same training window used for the LLM’s risk assessment. While this adds computational cost due to the grid-search process (approximately 36 combinations each month), it is essential for maintaining the adaptive nature of the risk management system.
Rationale for Monthly Re-optimization: Keeping both the LLM policy and the guardrail thresholds on the same monthly cadence is critical. It guarantees that the risk gates dynamically adapt and consistently reflect the market conditions and data used to generate the LLM’s policy, thereby maintaining a cohesive risk management framework.
Step 8: The Walk-Forward Loop – Ensuring Honest Evaluation
Walk-forward backtesting represents the closest approximation to true out-of-sample testing without the necessity of waiting for future market data to materialize. The core principle is straightforward: at any given point in time, the model only has access to information that would have been available up to that point, thereby eliminating any form of hindsight bias or future data leakage into past decisions.
The loop is structured on a monthly basis. For each out-of-sample month, starting from January 2023, the system trains on the preceding three years of data. This training period is used to build the LLM’s policy. Subsequently, the strategy trades through the following month using this generated policy. A critical aspect of this process is that equity and positions are carried forward continuously; there is no reset to an initial capital of 1.0 at the beginning of each month. This ensures a realistic simulation of capital growth and decay.
Upon completion of the walk-forward loop, the monthly performance blocks are stitched together to form a single, continuous out-of-sample equity curve. This unified curve is then used to generate and compare the equity curves for both the agent-only strategy and the agent-plus-guardrails version.
Step 9: Performance Metrics and Analysis
Once the walk-forward loop concludes, a standard suite of risk-adjusted performance metrics is computed for all three equity curves: the buy-and-hold benchmark, the agent-only strategy, and the agent-plus-guardrails strategy. Presenting these metrics side-by-side is crucial for a comprehensive evaluation. The inclusion of the buy-and-hold benchmark serves as the most stringent test of whether the strategy demonstrably adds value beyond passive investment.
CAGR vs. Sharpe Ratio: Different Perspectives on Performance
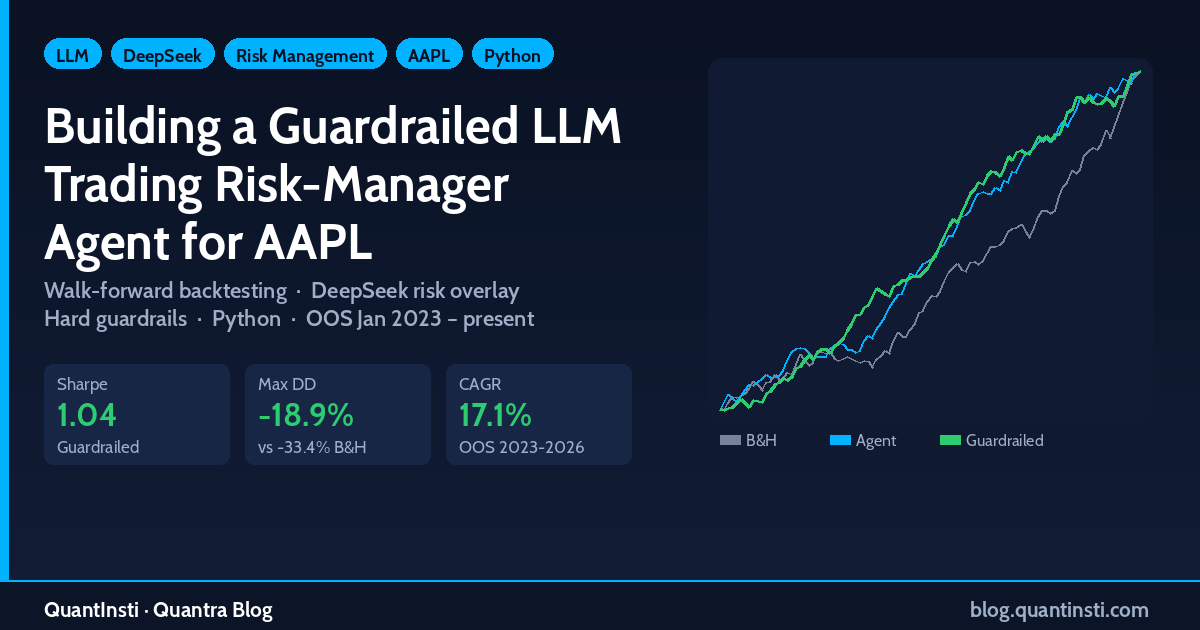
The strategy’s Compound Annual Growth Rate (CAGR) of approximately 12.5% to 12.8% (depending on the configuration) appears modest when directly compared to the buy-and-hold benchmark’s 27.1%. However, this comparison can be misleading, as the strategies undertake vastly different levels of risk. The LLM agents operate with annualized volatilities of around 14.1% and 13.9%, significantly lower than AAPL’s historical volatility of 25%. When assessed on a risk-adjusted basis, as measured by the Sharpe ratio, the performance gap narrows considerably, indicating a more competitive risk-return profile for the strategy.
Guardrails: A Trade-off Between Return and Drawdown Reduction
The implementation of hard guardrails, while introducing an element of caution, results in a slight reduction in CAGR. This "extra caution" comes at a cost. However, the benefits are substantial: the maximum drawdown decreases from -22% (for the agent-only) to -18%. More significantly, during periods of market stress, the guardrails demonstrably prevented larger losses. For a risk-managed portfolio, the agent-plus-guardrails version emerges as a compelling choice, while the agent-only version serves as a vital baseline to quantify the guardrails’ impact.
The Honest Takeaway: Risk Modulation, Not Alpha Generation
With the current set of state features and the LLM prompt, the strategy does not consistently outperform the buy-and-hold approach in terms of CAGR. The primary value proposition of the LLM in this architecture is not alpha generation but rather risk modulation. The strategy’s potential lies in its ability to participate in the upside of assets like AAPL while simultaneously mitigating the most severe drawdowns. For investors whose primary goal is to achieve this balance, the strategy offers a promising framework. However, for those seeking to outperform a passive index purely on returns, further development is required, likely focusing on enhancing predictive features.
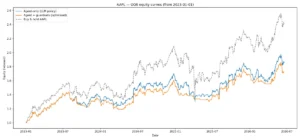
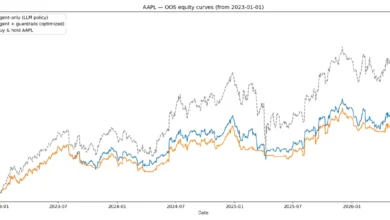
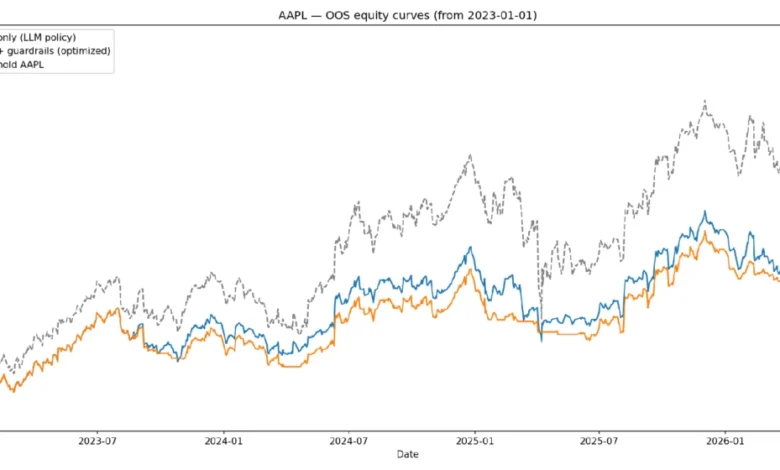
Figure: AAPL Out-of-Sample Equity Curves (January 2023 – Present), all rebased to 1.0.
The accompanying equity curve chart reveals three key observations. Firstly, all three curves exhibit upward trends through 2023 and 2024, confirming that the strategy effectively participates in AAPL’s upward trajectory. Secondly, the "Agent + Guardrails" curve consistently mirrors the "Agent-only" line during market rallies but diverges downwards more gradually during corrections. This divergence is a clear visual representation of the guardrails actively trimming exposure to prevent losses from compounding. Thirdly, the Buy & Hold strategy finishes highest, a reflection of AAPL’s unusually strong uptrend and shallow corrections during the 2023-2026 period. In a more volatile or bearish market environment, the lower volatility and reduced drawdown of the guardrailed strategy would likely translate into a more pronounced risk-adjusted advantage, as evidenced by its Calmar ratio of 0.91 compared to the Buy & Hold’s 0.88.
Step 10: Pathways for Strategy Improvement
The strategy developed thus far serves as a robust foundation. The emphasis is not on presenting a definitive "best" strategy but rather on providing insights and rationale that empower users to refine existing approaches or embark on further research.
Enhancing Signal Quality
- Multi-Horizon Momentum: Incorporating 5-day and 63-day cumulative returns alongside the current 20-day trend score can provide the LLM with a more nuanced understanding of whether the stock is in an early, mid, or late-stage trend.
- Earnings Blackout: Mandating a
FLAT_EXPposition in the two trading days surrounding each AAPL quarterly earnings release can mitigate significant gap-risk events. Since earnings dates are publicly known, this introduces no lookahead bias. - Macro Regime Filter: Adding a binary feature indicating whether the S&P 500 is trading above or below its 200-day moving average (with the window itself being an optimizable parameter) can provide the LLM with crucial market-wide context, particularly during broad market corrections where single-stock features might lag.
- Volume Z-score: Including today’s volume relative to its 20-day average as a state dimension can capture important signals. Unusually low volume often precedes a reversal, while unusually high volume can confirm momentum.
Refining Position Sizing
- Kelly Fraction Hints: Calculating a fractional Kelly size per state from training statistics and passing it to the LLM as a sizing hint can lead to more informed allocations. Using 25% of full Kelly helps avoid overbetting on potentially noisy estimates, and its benefit should be verified through out-of-sample testing.
- Regime-Conditional Leverage Cap: During high-volatility states (
VOL_HIGH), tighteningMAX_LEVERAGEto 0.6, irrespective of the volatility targeting output, can prevent the strategy from rebuilding a full position into a still-stressed market after a guardrail re-entry. - Continuous Size Output: Prompting the LLM to output a continuous exposure level between 0 and 1, rather than discrete levels, can lead to finer-grained position modulation and smoother equity curves. This approach, however, necessitates more stringent output validation.
Strengthening Guardrail Robustness
- Relative Drawdown Limit: Replacing the absolute drawdown stop with one that compares strategy equity to the buy-and-hold benchmark over the same window can prevent premature exits during bull markets where an absolute drawdown might still represent relative outperformance.
- Noise-Filtered Volatility Stop: Requiring three consecutive days of elevated volatility before the stop triggers, rather than reacting to a single day, can effectively filter out most spurious triggers caused by short-lived spikes.
- Separate Cooldowns: Implementing distinct cooldown periods for the volatility stop (e.g., 3 days) and the drawdown stop (e.g., 15 days) acknowledges that volatility spikes normalize quickly, while drawdowns can persist for longer durations.
- Guardrail Optimization Frequency: Exploring annual, semi-annual, and quarterly re-optimization cadences for guardrail thresholds can help identify the optimal balance between adaptability and robustness against overfitting. For slower-moving regimes, annual re-optimization might prove more stable than the current quarterly default.
Advanced LLM Prompting Techniques
- Comparative Ranking Prompt: Instructing the LLM to rank all states by risk/reward and assign exposure based on these rank tiers (e.g., top 50% receive full exposure, bottom 25% receive FLAT) can prevent the degenerate case where the model assigns favorable ratings to every state in isolation.
- Regime Classification First: Prompting the LLM to first classify the overall market regime (e.g., BULL, CHOP, or STRESS) before setting per-state exposure can anchor all decisions to a coherent macroeconomic view and produce a loggable regime label that can be plotted over the out-of-sample period.
- Multi-Model Comparison: Running the same prompt through multiple LLMs (e.g., GPT-4o and Claude) and comparing their resulting out-of-sample policies can provide a stronger indication of signal quality if there is systematic agreement between the models.
Evaluation and Validation Enhancements
- Rolling Sharpe Chart: Visualizing the rolling one-month Sharpe ratio over the out-of-sample period can reveal whether the strategy’s edge is persistent or concentrated within specific lucky windows, a detail that an aggregate Sharpe number might obscure.
- Volatility-Targeted Benchmark: Including a volatility-targeted buy-and-hold strategy (which maintains a constant target volatility through scaling) in the metrics table is essential. If the LLM strategy cannot outperform this benchmark, it suggests that the volatility-targeting module is responsible for most of the risk reduction, rather than the LLM’s intelligence.
- Transaction Cost Sensitivity Sweep: Reporting performance results at various transaction cost levels (e.g., 0.5 bps, 1.0 bps, and 2.0 bps) helps assess the strategy’s fragility. A strategy that only performs well under ideal pricing conditions is less robust than one that maintains its edge even with higher transaction costs.
Frequently Asked Questions
Q: Why use an LLM for this strategy? Couldn’t a simple rule-based system achieve the same results?
A: The strategy includes a comparison against a simple rule-based system (POLICY_MODE='rule') within the notebook. Running both and comparing their metrics is crucial for intellectual honesty. If the rule-based system outperforms the LLM, the LLM is not adding value and should be omitted. In tests, the LLM’s advantage has been observed in its ability to make smoother decisions across borderline states where statistical ambiguity exists, preventing the noisy, binary flips characteristic of simple rule-based thresholds.
Q: What is the guardrail deadlock, and why is it significant?
A: The guardrail deadlock occurs when a drawdown stop triggers, setting the position to zero. This freezes the strategy’s equity, preventing any improvement in the drawdown calculation. Consequently, the drawdown check continues to fire daily, indefinitely locking the strategy in a zero-position state. The MAX_FLAT_DAYS re-entry counter is designed to resolve this by forcing a partial re-entry after approximately one trading month, regardless of the persistent drawdown level.
Q: Can this strategy be applied to other stocks?
A: Yes, the architecture is adaptable. The primary adjustments involve changing the SYMBOL parameter and re-downloading the relevant data. The LLM policy cache is keyed by symbol, necessitating fresh API calls for new tickers. The framework is suitable for any liquid single stock or ETF with a substantial price history. For assets with less historical data than AAPL, reducing TRAIN_YEARS to 2 might be necessary to avoid overly sparse state statistics.
Q: What is the approximate cost of running the DeepSeek API for this strategy?
A: The walk-forward loop initiates approximately 40 API calls, each with a max_tokens limit of 2000. DeepSeek-chat is recognized as one of the more cost-efficient frontier models. At current pricing, the entire out-of-sample run costs less than $0.10. Furthermore, once the policy cache is warm, subsequent re-runs are effectively free.
Q: What is the most impactful next step for improving performance?
A: The single most impactful improvement lies in enhancing the quality of the state features. The current three-feature state space (trend, volatility, z-score) is relatively coarse. Incorporating technical indicators from libraries like ta-lib is highly recommended to meaningfully improve signal quality and provide the LLM with richer contextual information.
Conclusion
The framework presented herein is designed to illustrate a method for LLM-assisted risk management, rather than to provide a definitive alpha-generating machine. The LLM earns its place in this strategy not through market prediction, but by discerning nuanced distinctions between market states that a simpler rule-based system would handle with less sophistication.
The architecture comprises three distinct layers, each serving a unique purpose. Feature engineering and state bucketing translate raw price action into a format amenable to LLM interpretation. The LLM prompt, carefully framed as a risk manager rather than a forecaster, establishes a monthly exposure policy across these states. Finally, the hard guardrails, augmented with a re-entry mechanism, ensure that no single adverse market period can permanently sideline the strategy.
The results demonstrate a strategy that meaningfully participates in an asset’s upside while achieving a substantial reduction in maximum drawdown—a significant and valuable characteristic for real-world portfolios. While this is not the final word on LLM-driven trading, the framework is sound, the walk-forward methodology provides an honest evaluation, and every design decision is traceable. The state features could be more granular, the LLM prompt can be further refined, and the guardrail thresholds optimized.
The most effective way to learn from this research is to actively engage with it: run the code, identify areas for improvement, and rebuild it. Experiment with different prompts, incorporate new momentum features, or test the strategy on alternative assets like SPY. The provided notebook is structured for modification, with all key parameters accessible from the initial settings cell.
Further Reading
For those interested in delving deeper into the fundamentals of quantitative trading, the "Learning Track: Quantitative Trading for Beginners" offers a comprehensive introduction. To explore the practical applications of LLMs in trading, the "Trading Using LLM: Concepts and Strategies" track provides hands-on insights into implementing these advanced models. For a more rigorous academic and professional development path, the "Executive Programme in Algorithmic Trading (EPAT)" covers advanced topics in statistical modeling, machine learning, and algorithmic trading strategies using Python.
References
[Chan, 2024] E. P. Chan, "Machine Learning in Trading," YouTube, 2024. Available: https://www.youtube.com/watch?v=VzF-tvz3DAk&t=411s
Note:
- The strategy concept originated from the author.
- The blog content was generated with the assistance of an AI large language model and subsequently curated/edited by the author.
- Disclaimer: This educational and illustrative blog post is for informational purposes only. Trading in financial markets carries substantial risk of loss. The code and concepts discussed herein do not constitute financial advice. Always exercise due diligence and thoroughly understand any automated trading system before deploying it in a live trading environment.