The Easy Part of the Dollar Rally May Be Done as Greenback Faces Formidable Resistance

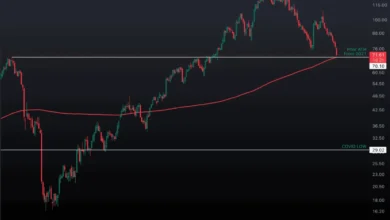
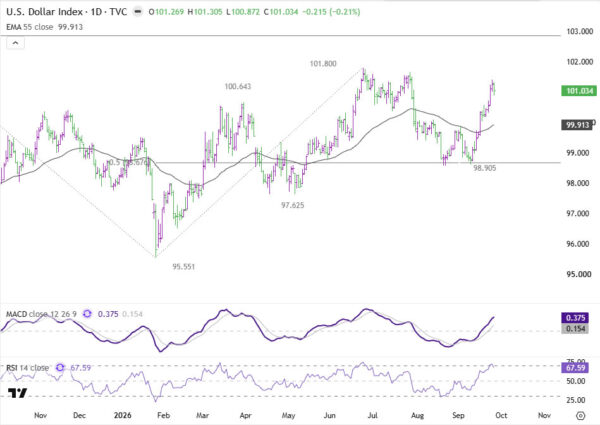
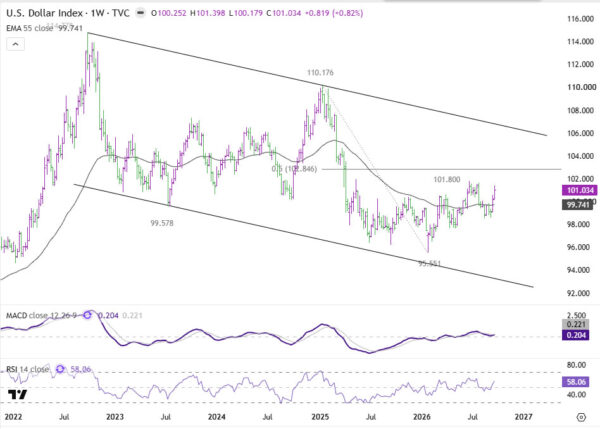
The global foreign exchange market closed out the previous trading week with the United States Dollar securely holding its recent gains, underpinned by aggressive monetary policy recalibrations and surging domestic yields. The benchmark Dollar Index (DXY), which tracks the greenback against a basket of six major foreign currencies, settled firmly near the 101.03 threshold. This movement followed a decisive technical breach that saw the index reclaim its 55-week exponential moving average (EMA) situated near 99.74, successfully extending a robust two-week upward trajectory. However, as financial markets transition into a new week packed with high-impact macroeconomic data releases, institutional analysts and technical strategists are increasingly warning that the path of least resistance is shifting. The greenback is no longer emerging from foundational support levels; instead, it is rapidly closing in on a dense and historically formidable resistance cluster ranging between 101.80 and 102.86. Navigating through and ultimately sustaining a break above this critical technical barrier will likely demand a fresh wave of macro catalysts, placing the onus squarely on the long end of the US Treasury yield curve rather than the heavily stretched front end.

To fully understand the current macroeconomic standing of the US currency, it is essential to examine the chronological sequence of events and policy decisions that ignited this aggressive multi-week rally. The primary catalyst materialized during the Federal Open Market Committee (FOMC) monetary policy meeting held on September 15–16. In a unanimous 12-0 decision, central bank policymakers voted to raise the benchmark federal funds rate by 25 basis points, lifting the target range to 3.75%–4.00%. While the rate hike itself was largely anticipated by forward-looking interest rate swaps, the accompanying quarterly economic projections and dot-plot consensus delivered an unmistakably hawkish surprise. A commanding 16 out of 18 FOMC participants indicated that the appropriate federal funds rate level by the conclusion of the calendar year should sit above the current midpoint, signaling clearly to market participants that the Federal Reserve’s monetary tightening cycle may not be finished yet.
Following the conclusion of the September FOMC meeting, senior Federal Reserve officials stepped up their public messaging campaign to reinforce the central bank’s inflation-fighting mandate. Federal Reserve Governor Michael Barr delivered remarks emphasizing that further monetary policy adjustments are likely to be required in the coming months, citing persistently robust economic growth, a remarkably tight and solid labor market, and headline inflation metrics that continue to print above the central bank’s symmetrical 2-year target. These official hawkish pronouncements were swiftly validated by hard economic data later in the week. S&P Global released its preliminary September flash survey data, which revealed that the US PMI Composite index jumped from an already expansionary 56.0 to 58.4—marking its highest reading since July 2021. Within the report, underlying cost growth accelerated to nearly a four-year high, driven primarily by renewed global energy price pressures and persistent domestic industrial capacity constraints. Concurrently, the Services PMI climbed to 58.7, while the Manufacturing PMI reached 57.0 alongside a Manufacturing Output reading of 56.7.
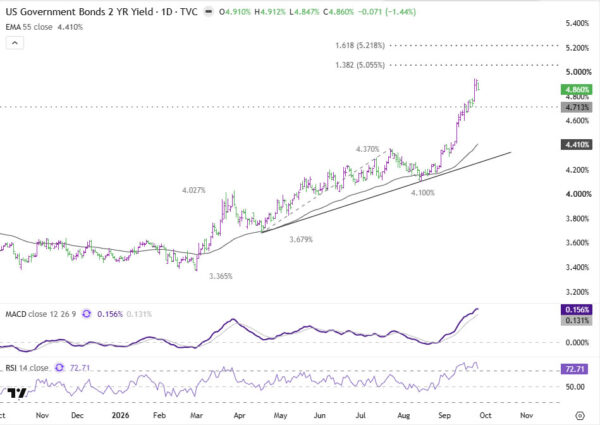
Financial markets reacted to this potent cocktail of hawkish monetary policy and strong macroeconomic indicators with swift, aggressive repricing. In the fixed-income market, the policy-sensitive 2-year US Treasury yield surged dramatically, climbing as high as 4.912% before trimming a portion of those gains to close the week around the 4.86% mark. Yet, this aggressive front-end repricing has left the short-duration space looking increasingly overextended from a technical perspective. Daily Relative Strength Index (RSI) readings for the 2-year yield have pushed decisively above the 72 threshold, signaling overbought conditions as yields approach the psychological 5.00% milestone and subsequent technical projections near 5.055%. Furthermore, interest rate futures pricing retreated slightly from its mid-week extremes as Friday’s closing bell approached. While the 2-year yield maintains the structural capacity to grind moderately higher, any substantial extension moving forward will necessitate fresh macroeconomic data rather than simple reiteration of a hawkish narrative that has already been thoroughly digested by market makers.
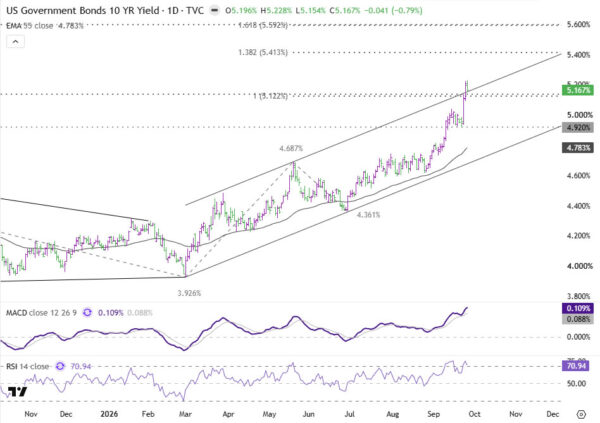
Given the technical constraints now facing the front end of the yield curve, market participants are increasingly pivoting their attention further out the duration spectrum. The 10-year US Treasury yield emerged as a critical focal point last week, touching a high of 5.228% before settling near 5.17% as it aggressively probed the upper boundary of its prevailing rising technical channel. This makes the 10-year yield the single most consequential swing factor—both fundamentally and technically—for the future trajectory of the US Dollar. A sustained, confirmed breakout above this recent multi-year high and channel ceiling would signal to fixed-income desks that the broader bond selloff is deepening at the long end of the curve. Under such a scenario, the next major measured technical objective sits at the 138.2% Fibonacci projection level, calculated from the 3.926% low through the 4.687% pivot, which points directly to 5.413%.
The macroeconomic implications of a sustained push toward 5.4% in the 10-year yield extend far beyond traditional bond market mechanics. Longer-term yields incorporate critical variables that stretch beyond the probability of a single near-term Federal Reserve interest rate hike. They reflect entrenched market expectations regarding structurally persistent inflation, economic resilience, shifting term premia, and the expanding ongoing supply of US sovereign debt duration. If the 10-year yield successfully marches toward the 5.4% objective even as short-term yields consolidate, the fundamental rate-differential channel that powered the greenback’s recent ascent will continue to widen. This dynamic would provide the most compelling fundamental argument for the Dollar Index eventually breaching the formidable 102.86 resistance barrier rather than stalling out underneath it. Conversely, if the 10-year yield fails to hold its ground above the channel ceiling, the foreign exchange market would lose its primary source of bullish momentum precisely as the DXY tests major technical resistance.
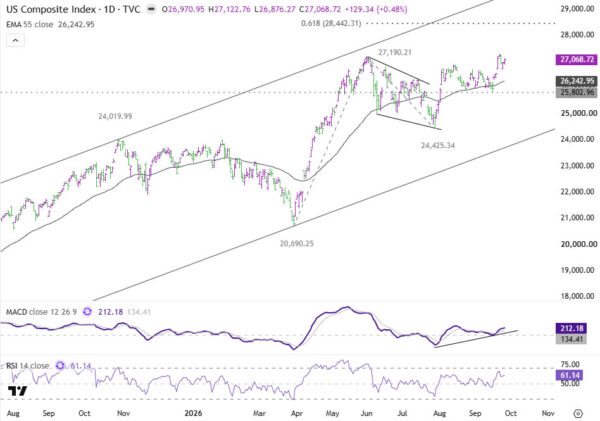
Equity markets have painted a notably different, though not necessarily contradictory, underlying picture regarding the broader health of the US economy. The technology-heavy Nasdaq Composite index has maintained a highly constructive technical posture, hovering near the 27,069 level. Operating comfortably above its rising 55-day exponential moving average, the index continues to target the 61.8% Fibonacci projection of the rally spanning from 20,690 to 27,190 anchored at 24,425, with an ultimate objective of 28,442. This sustained equity strength has been heavily propelled by renewed corporate enthusiasm surrounding artificial intelligence infrastructure and applications. Notably, several of the Nasdaq’s strongest trading sessions occurred concurrently with spikes in global crude oil prices and US bond yields, indicating that the equity and currency markets have been driven by partially decoupled underlying cross-currents rather than operating as a unified risk-on or risk-off proxy.
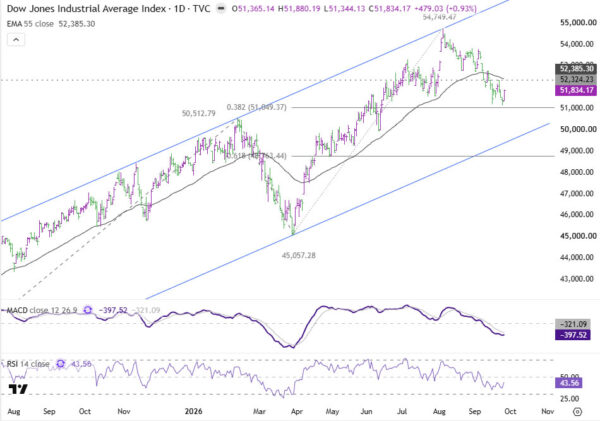
Meanwhile, the blue-chip Dow Jones Industrial Average has displayed a more measured technical profile, though it continues to successfully defend the critical 38.2% retracement level of its broader corrective fall from 54,749 down to 45,057, located at 51,049. A decisive technical breakout above horizontal resistance situated near 52,324 would successfully complete a textbook double-bottom reversal pattern, signaling a definitive end to the recent corrective phase and cementing a broader bullish continuation. For foreign exchange traders monitoring the US Dollar, the primary significance of persistent equity market resilience is indirect. An ongoing secular bull market in technology equities alongside a technical reversal in industrial averages serves to sustain broader risk sentiment, which can occasionally cap aggressive safe-haven demand for the greenback.
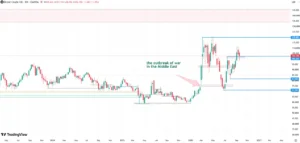
Standing in direct opposition to the dollar-positive inflation and rates narrative is the recent dramatic selloff observed in global energy markets. West Texas Intermediate (WTI) crude oil experienced a sharp downward correction last week, plunging nearly 8% from an intra-week high near $100.30 down to settle at $92.45 per barrel. This notable price contraction was driven by growing market speculation that ongoing diplomatic channels could eventually alleviate maritime transportation disruptions and security risks surrounding the vital Strait of Hormuz. In recent statements, Iranian officials indicated a theoretical willingness to reopen the strategic shipping lane within a week under the condition that the United States scales back regional military pressure and lifts active naval blockages—though market analysts continue to treat this as a highly conditional geopolitical proposal rather than a formalized diplomatic agreement.
From a technical standpoint, the WTI crude oil chart warrants close monitoring by macro traders. The commodity is rapidly approaching its 55-day exponential moving average positioned near $89.14, with the much more consequential $86.90 level looming directly below. The $86.90 mark represents the exact 50% retracement of the broader impulsive advance originating at $67.42 and peaking at $106.75. A sustained weekly close beneath the $86.90 threshold would significantly validate the technical hypothesis that the entire post-67.42 rally has matured into a completed three-wave corrective structure, subsequently opening the door for an extended decline toward the low-$80 per barrel range.
The macroeconomic transmission mechanism connecting lower oil prices to the foreign exchange market is direct, though economists advise against oversimplifying the relationship. S&P Global’s recent robust business survey data highlighted that American manufacturers and service providers are currently facing acute cost pressures stemming directly from elevated fuel, transportation, and broader energy expenses. If international crude oil prices continue to drift lower, this specific pillar of upstream inflation pressure will gradually begin to dissipate. Consequently, the hypothetical bearish-Dollar transmission chain operates as follows: lower crude oil prices translate into softening domestic inflation readings, which subsequently allow the Federal Reserve to adopt a less restrictive policy stance, leading to a retreat in benchmark Treasury yields and ultimately narrowing the interest rate differential advantage that has continuously supported the DXY.
Naturally, falling energy prices in isolation will not dictate the path of monetary policy. If broader US gross domestic product growth and nonfarm payroll employment figures maintain their current resilience, the Federal Reserve’s underlying justification for maintaining higher interest rates can comfortably withstand cheaper energy inputs. However, a technical breakdown in WTI crude oil below $89.14 and subsequently $86.90, if accompanied by a synchronized downward correction in sovereign bond yields, would directly challenge the fundamental macroeconomic mechanism that powered the dollar’s explosive rally throughout the previous week.
Ultimately, the short-term trajectory of the Dollar Index does not present a simple linear continuation narrative; rather, it resembles a complex macro-driven decision tree. The DXY clearly retains the technical space required to advance into the 101.80–102.86 resistance zone. Such an advance would remain entirely consistent with prevailing medium-term momentum, a successful weekly close back above the 55-week moving average, and an interest rate environment that remains structurally biased toward central bank hawkishness. Nevertheless, this specific overhead resistance zone represents the threshold where market hurdles multiply exponentially.
If the 10-year US Treasury yield manages a decisive technical breakout above the 5.23% mark and begins an aggressive march toward the 5.413% projection level—particularly if accompanied by another round of hotter-than-expected domestic economic data—the greenback will possess the necessary secondary rates impulse to successfully challenge and ultimately clear the 102.86 ceiling. Conversely, if the 10-year yield stalls out near channel resistance while the 2-year yield remains overbought and rate-hike expectations continue to moderate, the Dollar Index may struggle heavily during its initial test of overhead resistance, risking a tactical consolidation back toward the 99.70–99.90 moving-average support band. A deeper, more prolonged reversal in the currency would require a fundamental breakdown in macro drivers, most notably sustained weakness in crude oil prices coinciding with a broader retreat across the entire fixed-income yield curve.
Market participants will not have to wait long for the macroeconomic data necessary to resolve this directional debate. The upcoming economic calendar features two high-impact releases that will dictate whether the foreign exchange rally receives a second vital catalyst. On Thursday, the Institute for Supply Management (ISM) will publish its September Manufacturing PMI survey, providing a critical test of whether the exceptional business activity reported in S&P Global’s flash survey is broadly reflected across a wider industrial sample. This will be followed immediately on Friday by the official Bureau of Labor Statistics nonfarm payrolls report for September. As the definitive monthly gauge of US labor market health, the employment report will determine whether domestic hiring and wage growth remain robust enough to re-accelerate Federal Reserve repricing or whether they will confirm a cooling trend that validates the recent moderation in interest rate expectations.
Last week successfully established the foundational first leg of the foreign exchange move, characterized by stronger domestic economic growth, renewed supply-side inflation pressures, and aggressive Fed monetary tightening expectations being aggressively priced into sovereign bond yields and the US Dollar. The upcoming trading sessions will determine whether this powerful macro trade can secure a secondary catalyst precisely as the Dollar Index collides with major technical resistance. The greenback undoubtedly retains room to navigate higher; the more complex question facing global currency traders is whether US Treasury yields—specifically the benchmark 10-year note—possess the fundamental fuel required to run alongside it.