Global fast-food giant McDonald’s Corp. (NYSE: MCD) slumped to four-year lows late last week, registering a staggering 22% decline for the year and sitting 31% below its peak recorded in March. The downward trajectory culminated in a grueling seven-week losing streak—the corporation’s most extended negative run since 2014. For many financial analysts and market observers, the struggles of an iconic consumer-facing behemoth like McDonald’s are frequently interpreted as a reliable bellwether for the financial health of the American consumer. However, a deeper examination of internal corporate strategies, sector-wide performance divergences, and macroeconomic indicators reveals that the root cause of McDonald’s recent underperformance is less about broad economic distress and more about specific operational missteps and shifting consumer expectations.

The Pricing Paradox and Strategic Realignments
The core of McDonald’s recent market correction lies in its pricing strategy over the preceding years. In an effort to offset rising labor, supply chain, and operational overheads, the company instituted aggressive menu price hikes. Over time, these increases eroded the brand’s long-standing reputation for affordability, alienating cost-conscious patrons who historically relied on fast-food chains for budget-friendly meals.
To win back its value-driven reputation, management was forced to pivot, introducing $5 value meals and other promotional price compressions. While these tactics succeeded in driving foot traffic, corporate leadership noted that the discounting compressed U.S. company-operated margins down to unacceptable levels. Despite these promotional efforts, same-store sales grew by a meager 0.8% during the final quarter, a sharp deceleration from the 2.5% growth recorded during the same period a year prior. By contrast, chief competitor Taco Bell reported a robust 7% surge in same-store sales over a comparable timeframe, underscoring that McDonald’s struggles were largely self-inflicted rather than systemic to the quick-service restaurant industry as a whole.
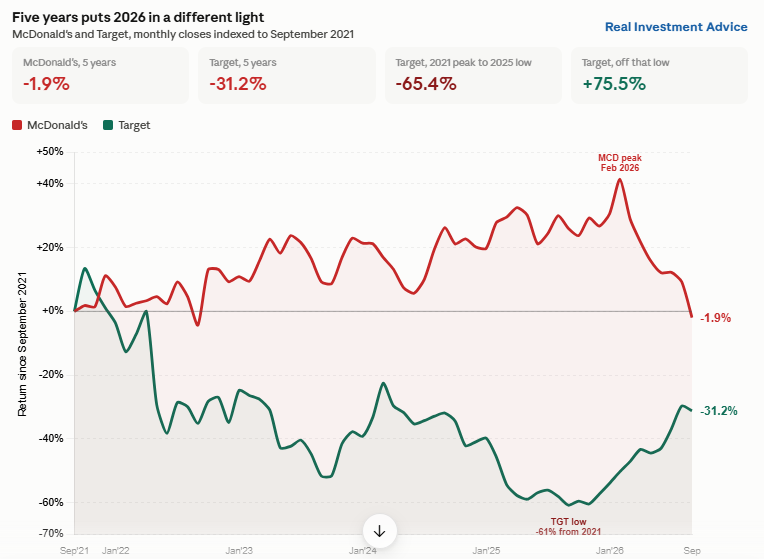
The downslide in MCD shares accelerated sharply following an investor day presentation where corporate leadership outlined a massive $8.5 billion financial support package destined for its franchisee network, equating to approximately $800,000 per individual store location. While necessary to support franchise operators facing compressed margins, the sheer scale of the capital commitment unnerved Wall Street investors.
Dissecting the Consumer Complex: The Haves and the Have-Nots
The narrative that McDonald’s woes signal a widespread collapse of the American consumer is quickly dismantled when looking at the broader retail and consumer discretionary landscape. Performance across consumer-facing equities has been exceptionally fragmented, displaying stark divergences that point to evolving consumer tastes and brand positioning rather than macroeconomic constraints.
Take Nike, for instance, which has seen its shares plummet 43.5% over the course of the year and nearly 80% from its late-2021 all-time highs. Like McDonald’s, Nike’s steep losses are primarily attributed to increased market competition, missteps in product distribution, and brand fatigue. On the opposite end of the spectrum, traditional retail giants like Target have thrived, posting a year-to-date gain of 56.7%, while coffee giant Starbucks has largely tracked in line with the broader S&P 500 benchmark.
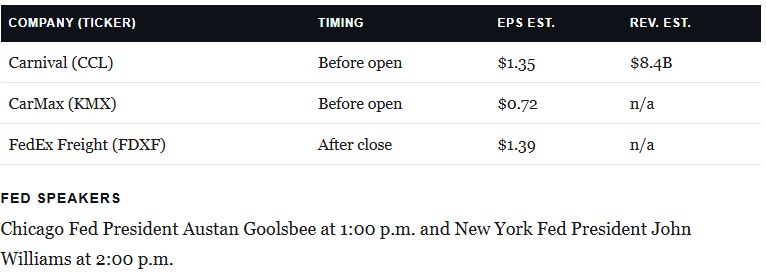
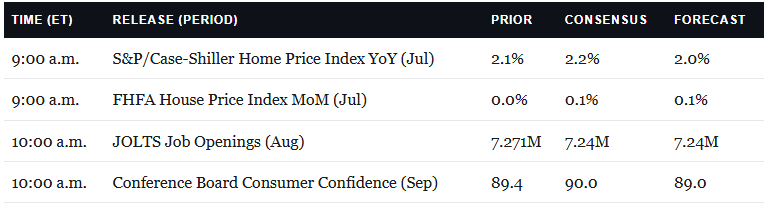
Broader economic data further complicates the bearish narrative. Aggregate retail sales figures demonstrated resilience, with August retail sales rising by 1.2%—marking the largest monthly gain since March. Although consumer discretionary stocks broadly lagged, down 6.6% on the year compared to the S&P 500’s 13.2% advance, the persistent expansion in retail spending proves that consumers continue to deploy capital. The divergence between falling stock prices and rising retail sales underscores that modern market pressures are heavily concentrated in companies grappling with specific branding, pricing, and execution challenges.
Market Breadth, Investor Sentiment, and Historical Analogies
Away from the microeconomics of the restaurant industry, the broader U.S. equity market is exhibiting fascinating behavioral dynamics. Wall Street has recently been guided by the classic adage, "never short a dull market," popularized by market historians and analysts. The S&P 500 has spent extended stretches moving sideways without registering a single 1% daily or weekly decline, creating a deceptively calm surface masking underlying structural shifts.
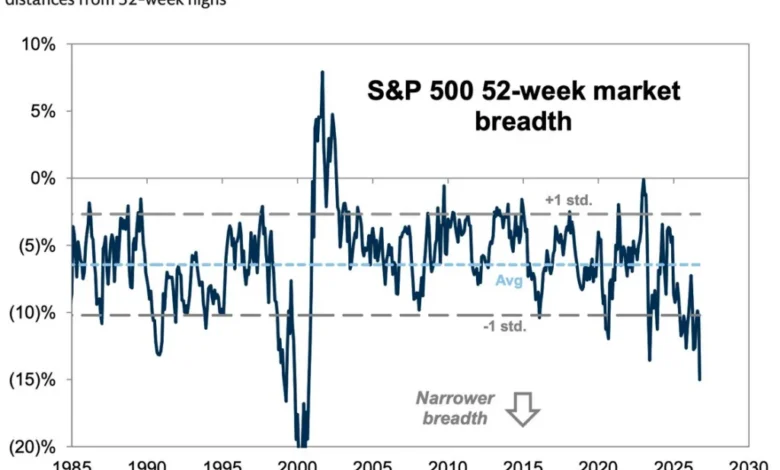
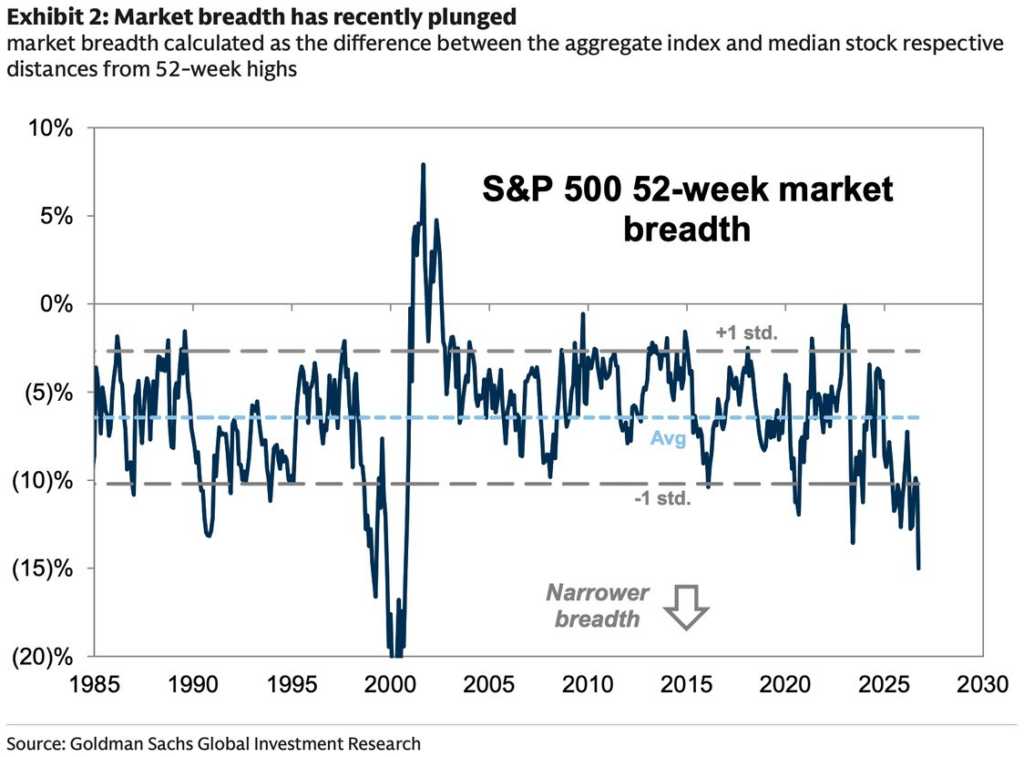
Beneath this calm exterior, however, market breadth has narrowed considerably. Measures tracking the gap between the headline index and the median stock’s distance from its 52-week high have plunged to approximately -15%, marking the narrowest reading since the year 2000. This narrow breadth has naturally fueled anxiety among retail and institutional market participants.
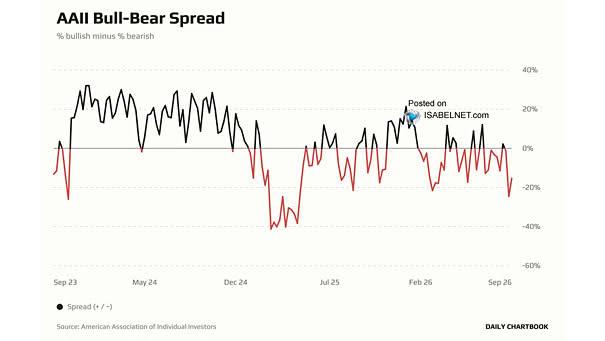
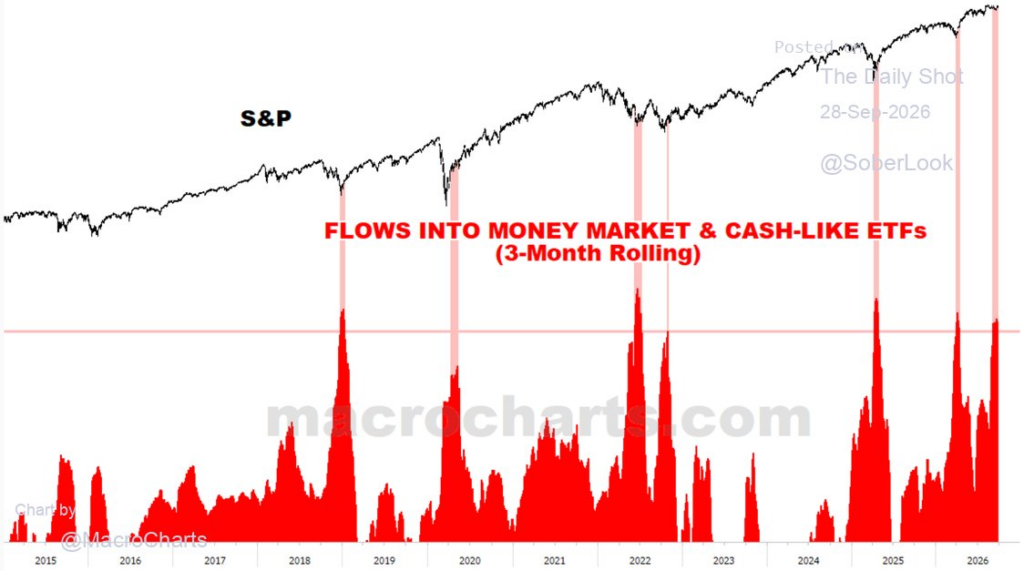
Sentiment surveys, such as the American Association of Individual Investors (AAII) sentiment index, revealed a sudden 14% spike in bearish respondents within a single week, driving the bull-bear spread deep into negative territory. Simultaneously, retail investor capital has poured aggressively into money market funds and cash-equivalent exchange-traded funds (ETFs). Historically, surges in cash allocations of this magnitude have aligned with major market bottoms, such as those observed in 2018, 2020, 2022, and 2025.
However, a critical distinction separates the current environment from past corrective phases: rather than fleeing realized portfolio losses after a market crash, investors are currently piling into cash as a preemptive hedge against anticipated risks while the S&P 500 trades near record highs. When bearish sentiment, risk-off capital flows, and weak market breadth reach extremes simultaneously, these indicators frequently reverse their signaling, acting as powerful contrarian tailwinds for a forthcoming market rally.
Seasonality, Technical Outlook, and Year-End Projections
As the market transitions into the final quarter of the year, seasonal tailwinds offer additional support for equity bulls. Historical market data dating back to 1950 highlights that October has historically been the strongest-performing month during midterm election years, boasting an average gain of 3.0% and finishing in positive territory nearly 74% of the time. November historically follows close behind with an average return of 2.7%.
Combined with the imminent kickoff of the third-quarter corporate earnings season, the resumption of corporate share buyback programs, and deeply oversold conditions among lagging sectors, the market is structurally positioned for potential upside continuation into year-end. Rather than signaling an impending bear market, the prevailing wall of worry and deeply entrenched consensus bearishness are providing the psychological digestion required for a healthy market to climb higher.
From a technical perspective, market participants are advised to monitor key moving averages, notably the 50-day moving average, as a vital risk management threshold. Unless breadth deteriorates further and critical technical support levels are decisively breached, the probability distribution heavily favors the upside. The market’s ability to absorb widespread investor pessimism without suffering severe price damage illustrates that the path of least resistance may ultimately surprise the consensus trade, rewarding selective optimism over fear-driven hesitation.