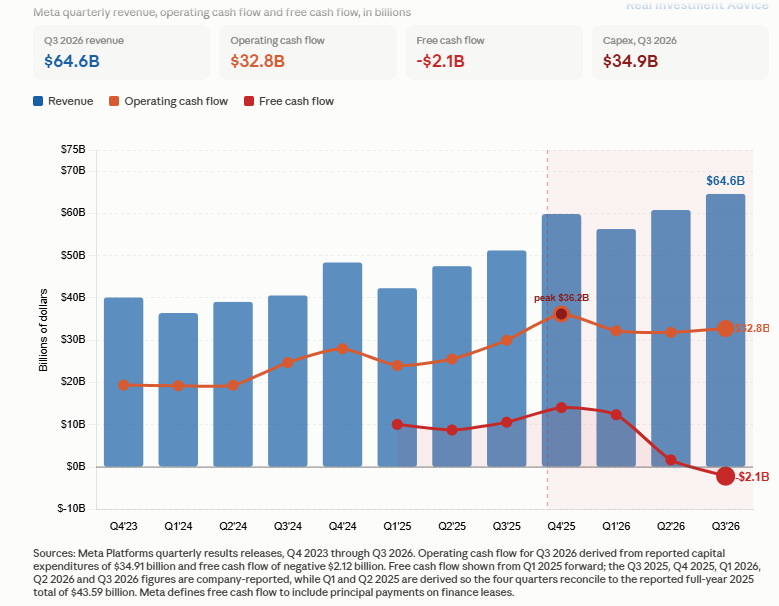
Meta Platforms reported a massive financial milestone for the third quarter of fiscal 2026, posting record revenue of $64.60 billion—a 26% year-over-year increase that easily surpassed the Wall Street consensus estimate of $63 billion. Diluted earnings per share (EPS) skyrocketed to $3.83, nearly quadrupling the $1.05 reported during the same period in the previous year. However, this headline EPS figure was severely distorted by a massive $18 billion legal charge stemming from a settlement regarding teen mental health liabilities. Excluding this one-time legal penalty, Meta’s adjusted diluted EPS would have landed at an impressive $7.40.

Despite the blowout top-line growth and stellar earnings performance, the most critical underlying metric for the tech giant centered around liquidity and capital allocation. Driven by an aggressive, unrelenting expansion into artificial intelligence infrastructure, Meta’s capital expenditures (capex) reached an astonishing $34.91 billion during the third quarter alone. This figure outstripped the company’s operating cash flow generation, pushing its quarterly free cash flow deep into negative territory at -$2.12 billion.
Simultaneously, management significantly escalated its full-year capex guidance. The company now expects total annual capital spending to land between $135 billion and $145 billion, a drastic upward revision from its previous projection of $85.8 billion. The sheer scale of these cash outflows highlights a monumental shift in corporate strategy: Meta’s legacy advertising ecosystem can no longer comfortably self-fund the staggering financial demands of the ongoing generative AI buildout.
A Structural Shift: Creating the Class C Share Class
To bridge this unprecedented cash gap without compromising liquidity or operational flexibility, Meta announced a corporate stock split paired with a major structural overhaul. While a traditional stock split does not directly generate capital for an issuer, Meta’s unique execution creates a strategic mechanism designed to facilitate future fundraising.
The company is establishing a brand-new class of nonvoting Class C common stock. This new stock will be distributed as a special dividend to existing shareholders, granting one Class C share for every existing share held. Mechanically, this action will double the total share count while cutting the individual share price in half, producing the immediate economic equivalence of a classic two-for-one stock split. Trading for the newly created Class C shares is officially scheduled to commence in late January 2027.
Unlike the common stock typically issued in retail-focused stock splits, the design of the Class C structure addresses a much more specific corporate finance objective. CEO Mark Zuckerberg addressed the strategic rationale during the earnings call, explicitly noting the utility of the new equity.
"Creating a publicly traded nonvoting stock usable for, you know, capital raising, employee compensation, acquisitions, and other general corporate purposes while preserving the voting power of existing class A and B shareholders," Zuckerberg stated.
Preserving Executive Control Amid Massive Capital Needs
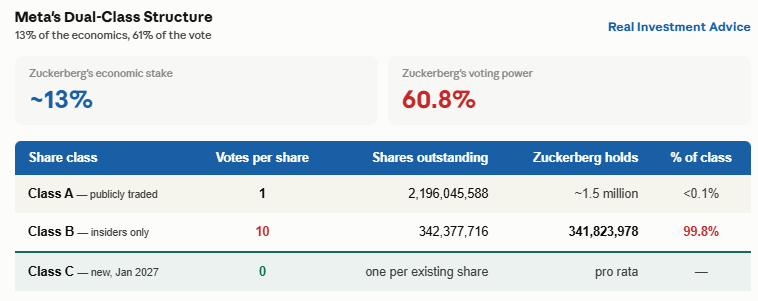
The introduction of nonvoting Class C shares serves as a masterclass in corporate governance designed to protect executive voting power. Meta currently operates under a dual-class share structure. Class A shares—held primarily by public investors and institutional funds—carry one vote per share. Class B shares carry ten votes per share and are tightly held, with Chief Executive Officer Mark Zuckerberg controlling roughly 99.8% of the entire Class B tier.
Although Zuckerberg owns an outright economic stake of approximately 13% in Meta Platforms, his absolute grip on the company’s voting power stands at roughly 61% thanks to the weighted nature of his Class B holdings. Under normal circumstances, issuing billions of dollars in new equity to fund multi-year AI initiatives would require selling voting Class A shares, which would dilute Zuckerberg’s majority voting control over time.
By introducing the nonvoting Class C shares, Meta unlocks a vast, liquid currency that can be deployed for institutional capital raises, large-scale technology acquisitions, and high-level talent compensation. Because these shares carry zero voting rights, Zuckerberg’s commanding 61% voting majority remains completely insulated from dilution.
Financial historians have quickly drawn parallels to corporate maneuvers executed by rival tech giants. Alphabet (Google) implemented a virtually identical stock restructuring in 2014, introducing nonvoting Class C shares for the explicit purpose of executive voting preservation and capital flexibility. That move subsequently triggered major friction with institutional investors, culminating in a multi-million-dollar shareholder class-action lawsuit that Google ultimately settled for roughly $522 million. Market observers will undoubtedly monitor whether Meta faces similar legal scrutiny from institutional shareholders regarding the disenfranchisement inherent in the new share tier.

The Broader Market Implications: From Buybacks to Capital Raises
Meta’s dramatic pivot from a cash-rich, aggressive share-buyback machine into an aggressive capital-raising entity may signal a broader, structural inflection point across the entire megacap technology landscape. For well over a decade, the dominant members of the S&P 500 tech cohort utilized excess balance-sheet cash to repurchase their own shares, largely due to a lack of transformative, capital-intensive investment opportunities.
The sudden onset of the generative AI revolution has completely inverted that paradigm. With hyperscalers like Meta, Microsoft, Amazon, and Alphabet committing hundreds of billions of dollars to data centers, advanced microprocessors, and proprietary large language models, organic cash flow is increasingly insufficient. Meta’s willingness to cross the Rubicon—moving from negative free cash flow to explicit equity issuance to fund infrastructure—suggests that other members of the Magnificent Seven may soon be forced to follow suit, fundamentally altering the supply and demand dynamics of the U.S. equity market.

Macroeconomic Backdrop and the Stock-Bond Correlation Dilemma
As corporate governance and AI spending dominated technology headlines, macro strategists were simultaneously forced to grapple with shifting correlations in the broader financial markets. The traditional 60-30-10 or 60/40 balanced portfolio has faced significant stress throughout 2026 due to an unstable relationship between equities and fixed-income assets.
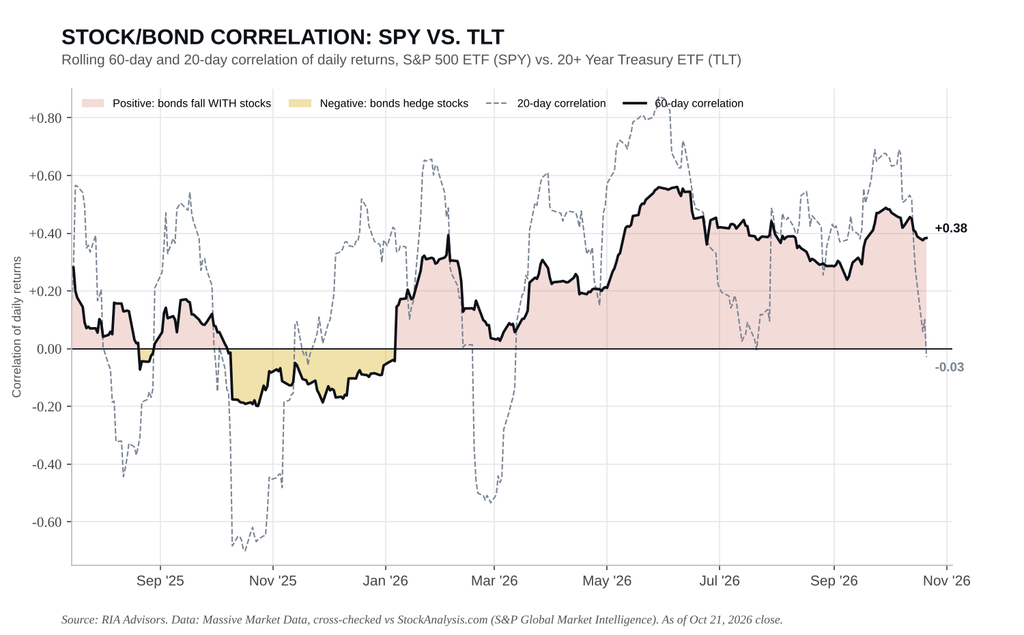
For much of the year, the 60-day correlation between the daily returns of the S&P 500 and long-term U.S. Treasury bonds (TLT) broke historical norms. After hovering near zero in February, the rolling correlation climbed aggressively, peaking at +0.56 in June and remaining elevated at +0.38. In a healthy macroeconomic environment, bonds are expected to act as a shock absorber—rallying when equities sell off. A positive correlation coefficient means that long-term bonds fall in tandem with stocks, turning the supposed safety net into a secondary source of capital destruction. Over the preceding twelve-month window, the S&P 500 posted a solid 15.2% price gain, while long Treasuries suffered a severe 12.8% drawdown.
However, early signs of mean reversion emerged on a short-term basis. As the S&P 500 experienced a modest retracement from its October record highs near the 7,800 threshold, slipping roughly 0.8% to 7,748, long-duration Treasuries staged a notable counter-trend rally. TLT prices climbed approximately 4.1% off their early October lows as the benchmark 10-year Treasury yield eased from an intraday peak of 5.31% down to 5.12%. Consequently, the 20-day stock-bond correlation flipped negative for the first time since July, indicating that fixed-income assets were briefly resuming their traditional role as a portfolio hedge.
Technical Analysis and Risk Management in Fixed Income
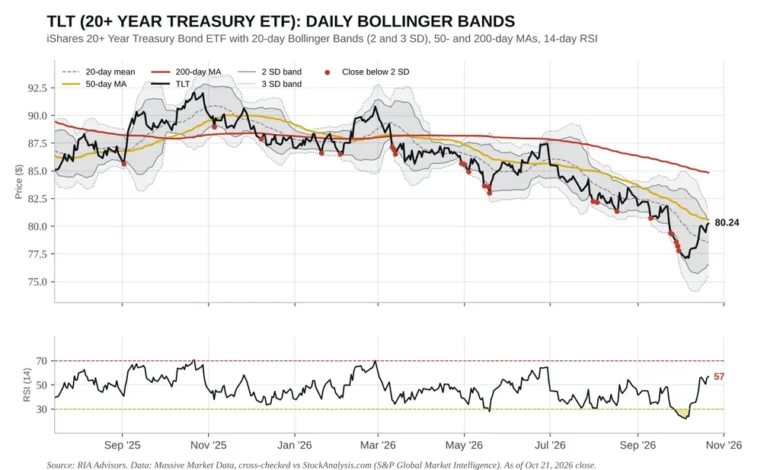
Despite the encouraging rebound in long-duration bonds, technical strategists urge caution against premature celebration. The TLT ETF recently rallied into a heavy cluster of technical resistance, pressing directly against its declining 50-day moving average and the upper boundary of its Bollinger Bands. Meanwhile, the longer-term 200-day moving average remains situated significantly higher, highlighting the ongoing structural downtrend that has plagued fixed income amid persistent inflationary pressures and elevated interest rates.

Applying classic market principles—such as Bob Farrell’s foundational rules on market behavior—suggests that asset classes ultimately tend to revert to their long-term moving averages. With TLT trading roughly 5% below its 200-day moving average, meaningful upside potential exists should macroeconomic data continue to validate falling yields. Nevertheless, disciplined risk management dictates that price action must confirm the thesis before portfolio allocations are aggressively adjusted.
Investment managers emphasize that a hedge which only functions intermittently ceases to be an effective risk-mitigation tool. Moving forward, portfolio models will likely remain dynamic: if long-term bond prices secure sustained closes above critical moving-average resistance levels while maintaining a negative correlation to equities, duration targets will be systematically restored. Conversely, should the bond rally fail at overhead resistance, cash reserves—rather than long-term government debt—will serve as the primary shock absorber against equity market volatility, ensuring that institutional and retail portfolios alike remain resilient heading into the final stretch of 2026.