Ethereum Stabilizes Above $2,430 as Spot ETFs Pour $1 Billion into Market and Technical Breakout Faces Crucial Test


Ethereum traded defensively near the $2,434 mark on September 10, registering a moderate 2.5% decline over the daily session as broader macro-driven risk-off sentiment washed across the digital asset landscape. Despite the minor pullback, the leading smart contract platform continues to inhabit a remarkably narrow consolidation band, holding firmly above the critical threshold it reclaimed during a late-August market rotation. This price action preserves a broader technical restructuring that materialized when ETH definitively breached a descending trendline—a persistent overhead barrier that had dictated the coin’s downward trajectory throughout the 2025-2026 bear cycle. Institutional participation has concurrently provided a resilient structural floor, evidenced by sustained net inflows into United States spot Ethereum exchange-traded funds and a robust resurgence of open interest across major derivatives markets back toward previous cycle peaks.
The Anatomy of a Trend Reversal: From Ceiling to Floor
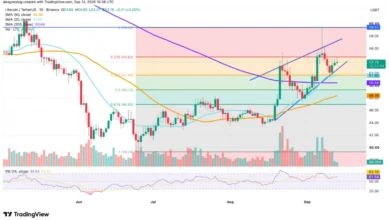
To understand Ethereum’s current market standing, analysts must look back at the nearly year-long macro slide that tracked a descending trendline meticulously anchored to the September 2025 cycle high of $4,949. For close to twelve months, price action respected this downward boundary, capping every attempted relief rally and punishing bullish momentum. However, a structural shift occurred in August 2026 when buyers mobilized sufficient volume to decisively break above the trendline. Following the breakout, the asset successfully completed a textbook technical retest, validating the former resistance line from the opposite side and establishing it as a newly minted support shelf. In technical analysis, a multi-year overhead ceiling transitioning into a baseline floor frequently signals a fundamental shift in market psychology, transforming trapped sellers into committed accumulators.
At the heart of this operational floor lies the 0.236 Fibonacci retracement level, precisely calculated at $2,333. This metric measures the magnitude of the pullback from the cycle low of $1,525, established in June, up to the $4,949 zenith. Unlike theoretical technical indicators that often serve as visual decoration, these Fibonacci markers have repeatedly acted as definitive reaction points on multi-timeframe charts. Reclaiming the $2,333 threshold is of paramount importance because that exact price point acted as a brick wall during the market’s descent. The ability of buyers to successfully convert this historical resistance into a dependable support level is the defining characteristic that separates a legitimate macroeconomic recovery attempt from an ephemeral, fading dead-cat bounce.

Institutional Conviction: Spot Ethereum ETF Accumulation Crosses $1 Billion
While spot market volatility frequently dictates short-term sentiment, institutional allocation vehicles in the United States have quietly supplied an immense, price-insensitive bid throughout the recent consolidation phase. Data compiled by Farside Investors highlights a remarkable period of sustained accumulation across the twelve trading sessions spanning from August 24 to September 9. During this window, spot Ether ETFs recorded net positive capital inflows on ten out of the twelve trading days, experiencing only two minor, shallow net-outflow sessions on September 2 and September 8.
The cumulative net inflow over this concise stretch comfortably cleared the $1 billion milestone, landing at approximately $1.04 billion. BlackRock’s exchange-traded fund, trading under the ticker ETHA, spearheaded the institutional demand, capturing the lion’s share of daily allocations. Concurrently, Fidelity’s FETH and various offerings from Grayscale contributed steady secondary inflows. This passive, continuous absorption of underlying token supply plays a vital role in explaining why the $2,333 support floor has successfully repelled downward pressures, absorbing selling liquidity even during broader market correction days such as September 10.
Derivatives Market Dynamics: Open Interest Nears Cycle Highs While Spot Volume Cools
Beneath the serene surface of the current price range, the derivatives ecosystem tells a story of aggressive positioning and building leverage. Open interest across global Ethereum derivatives venues hovered near $33.6 billion on September 10, bringing market exposure almost shoulder-to-shoulder with the peak levels observed during the previous market cycle. When open interest rises while an asset remains locked inside a tight horizontal range, market technicians interpret the behavior as market participants actively opening and expanding positions in anticipation of a forthcoming directional expansion, rather than liquidating or closing out risk.

Conversely, spot trading volume has displayed a contrasting trajectory. The explosive volume surge that initially powered the August trendline breakout has steadily dissipated, giving way to the subdued, orderly trading activity characteristic of a market in digestion. While declining volume during a consolidation range typically indicates that a market is successfully absorbing prior volatility rather than preparing for an immediate reversal, it also serves as a warning label: any upcoming breakout attempt will require a fresh injection of organic liquidity and participation to decisively clear overhead resistance boxes.
Navigating the Macro and Technical Landscape: Resistance Levels and Downside Risks
Market structure is currently bracketed by two pivotal technical zones. Directly below current prices sits the reclaimed support cluster, anchored by the $2,333 Fibonacci level, with intermediate intraday defense lines resting near $2,399. Should spot prices drift lower, deeper historical safety nets from the spring and summer consolidation phases wait at $1,970 and $1,830.
On the upside, the immediate hurdle is marked by the 0.382 Fibonacci retracement level at $2,833. A decisive daily candlestick close above this barrier would confirm that Ethereum’s recent price action has officially graduated from a standard relief rally into a fully fledged structural uptrend. Further up, heavy historical supply zones loom at the 0.5 retracement level ($3,237) and the 0.618 retracement level ($3,641)—the exact regions where the primary bear market distribution occurred.
Market analysts emphasize that Ethereum’s recent 2.5% daily retracement was fundamentally macro-driven rather than native to the asset itself. On the same trading day, Bitcoin traded softer near $76,994, reflecting a generalized risk-off sentiment sweeping through traditional and digital financial markets alike. As long as daily closes continue to print safely above the $2,333 baseline, the macro structure remains constructively positioned for another test of the upper resistance bands.

Fundamental Horizons: The 2029 Quantum Resistance Roadmap
While traders closely monitor short-term derivatives metrics and ETF inflows, the underlying protocol development calendar has established a concrete long-term foundation. On September 7, the Ethereum Foundation’s Protocol Cluster published a unified, cohesive roadmap that formally commits the Layer 1 network to achieving full quantum resistance by December 2029. To safeguard this ambitious timeline, core developers have opted to streamline and trim the implementation scope of the upcoming Hegota upgrade.
This forward-looking structural roadmap provides the multi-year fundamental backdrop against which technical price levels, institutional fund flows, and regulatory developments will ultimately be priced. As Ethereum navigates its current technical consolidation range, the convergence of institutional ETF accumulation, surging derivatives interest, and aggressive protocol hardening highlights a network maturing into its next structural era.