Quantitative Analysis of Insider Purchase Filings Reveals Short-Term Market Association and Long-Term Uncertainty

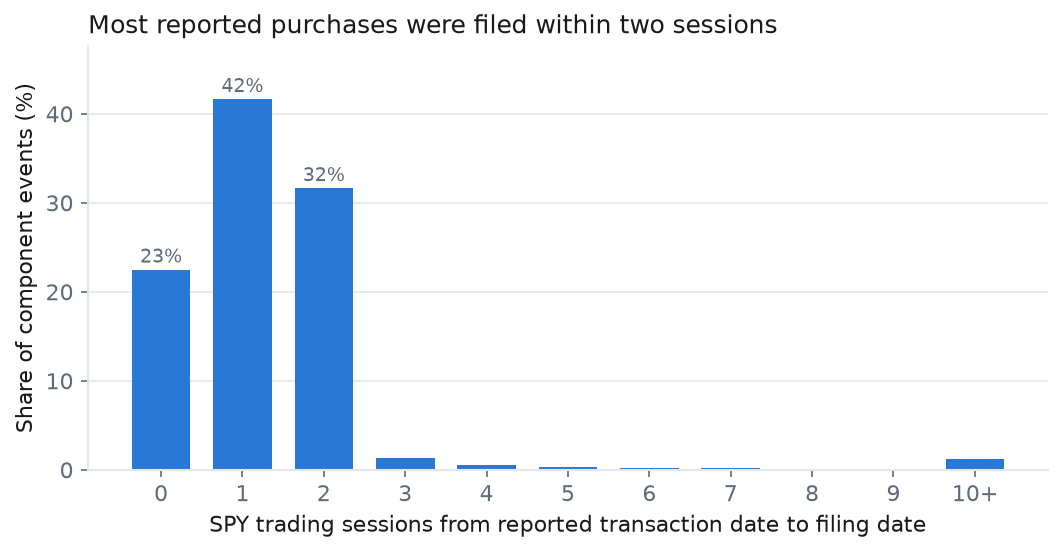
The landscape of corporate insider trading disclosures provides a uniquely structured, public-facing data set for quantitative researchers. Under the regulatory framework established by the U.S. Securities and Exchange Commission (SEC), corporate insiders—defined as officers, directors, and beneficial owners of more than 10% of a company—are required to report changes in their equity holdings via Form 4. This reporting mechanism, which mandates filings by the end of the second business day following a reportable transaction, creates a consistent event-driven environment that serves as a cornerstone for academic and professional event studies. By analyzing 1,345,036 non-derivative transaction rows from January 1, 2022, through June 30, 2026, researchers have synthesized a granular view of how market participants react to "Code P" (open-market or private purchase) filings.
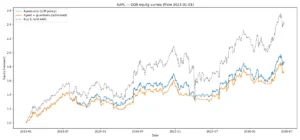
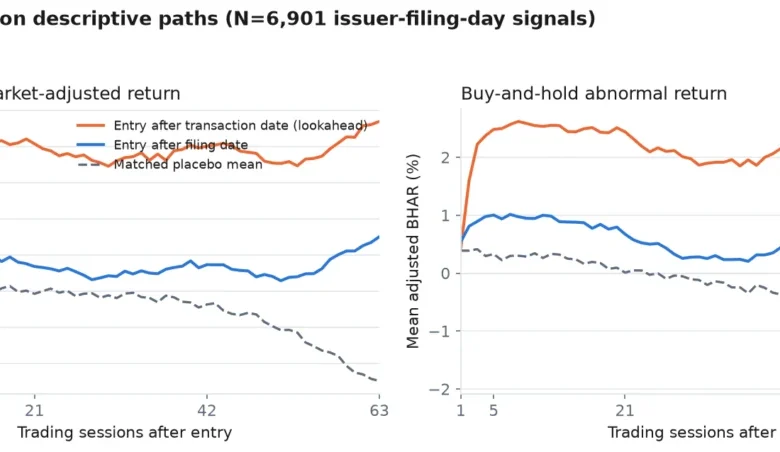
The research funnel, which distills over a million raw rows into 11,957 component events, highlights the complexity of SEC data. After filtering for price coverage, validating fill prices, and aggregating data at the issuer-day level, the study arrives at 7,406 public signals. These signals are not merely individual trades but represent meaningful clusters of market information. The primary findings suggest a modest but statistically significant immediate market reaction: an SPY-adjusted mean cumulative abnormal return (CAR) of +0.534% for the next trading session, rising to +1.009% over a five-session window. These results, supported by issuer-and-entry-month two-way clustered t-statistics of 6.460 and 5.053 respectively, provide a rigorous baseline for understanding the immediate impact of insider disclosures.
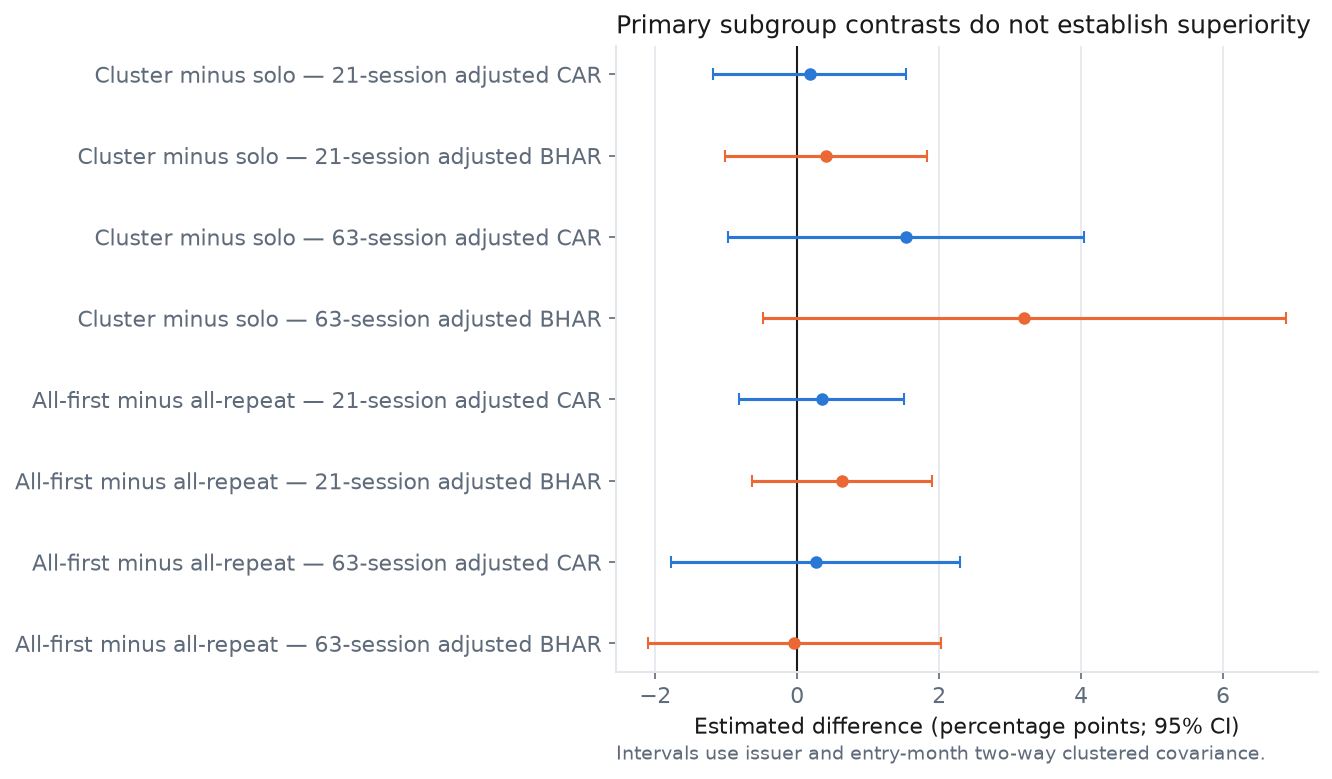
However, the predictive power of these signals diminishes as the time horizon extends. At 21 and 63 sessions, the adjusted CAR confidence intervals widen significantly to include zero, suggesting that the initial market enthusiasm may not translate into long-term price drift. This finding aligns with established financial literature, such as the work of Lakonishok and Lee (2001), which observed that while purchase activity is more informative than sales, the alpha generation is often concentrated in specific market segments, particularly smaller firms.
Anatomy of the Filing and the 10b5-1 Distinction
A critical challenge in parsing Form 4 data is the "one insider, one trade" fallacy. SEC filings often contain multiple transaction rows, and beneficial owners frequently file jointly. To maintain data integrity, the study employs a conservative approach, excluding multi-owner filings to prevent the over-attribution of trade signals. Furthermore, the analysis accounts for the evolution of Rule 10b5-1, a regulation that allows insiders to schedule trades in advance to avoid allegations of insider trading.
Following the SEC’s April 1, 2023, mandate for clearer disclosure of Rule 10b5-1(c) plans, the study excludes transactions explicitly flagged as being part of such pre-planned arrangements. By normalizing affirmative values and removing these flagged trades, the researcher isolates transactions that are more likely to be discretionary. Yet, even with these precautions, the observational nature of the study remains a limitation; an officer might purchase shares following a price decline or during corporate financing rounds for reasons that remain invisible to the structured data fields. Consequently, these returns are best described as associations rather than causal proofs of private information.
Methodological Rigor and the Price Anchor
The process of data acquisition and validation serves as a masterclass in financial data hygiene. Because the raw Form 4 data does not inherently identify whether a transaction occurred on an exchange, the study implements a "fill-price anchor." By comparing reported VWAP (Volume-Weighted Average Price) against reconstructed nominal closes, the methodology filters out significant unit errors and mismatches.
The reliance on Yahoo Finance for historical pricing, while convenient, introduces a survivorship bias that must be acknowledged. The study reports that 1,888 components were dropped due to a lack of price coverage, a group likely composed of delisted, renamed, or highly distressed securities. This exclusion is a non-random event that impacts the study’s conclusions. Furthermore, the treatment of corporate actions—such as stock splits or dividends—requires meticulous reconstruction of historical nominal closes. In 602 instances where action-like intervals were deemed ambiguous or invalidated, the study chose to exclude those specific outcome horizons rather than discarding the issuer entirely. This nuance is vital for researchers attempting to replicate or build upon these findings.
Comparative Analysis: Filing-Date vs. Transaction-Date
One of the most persistent issues in insider trading research is "lookahead bias." Many studies fall into the trap of using the transaction date as the starting point for their analysis, ignoring the fact that the market is unaware of the trade until the filing is submitted. By contrasting transaction-date entry with filing-date entry, the study quantifies the bias inherent in many existing models.
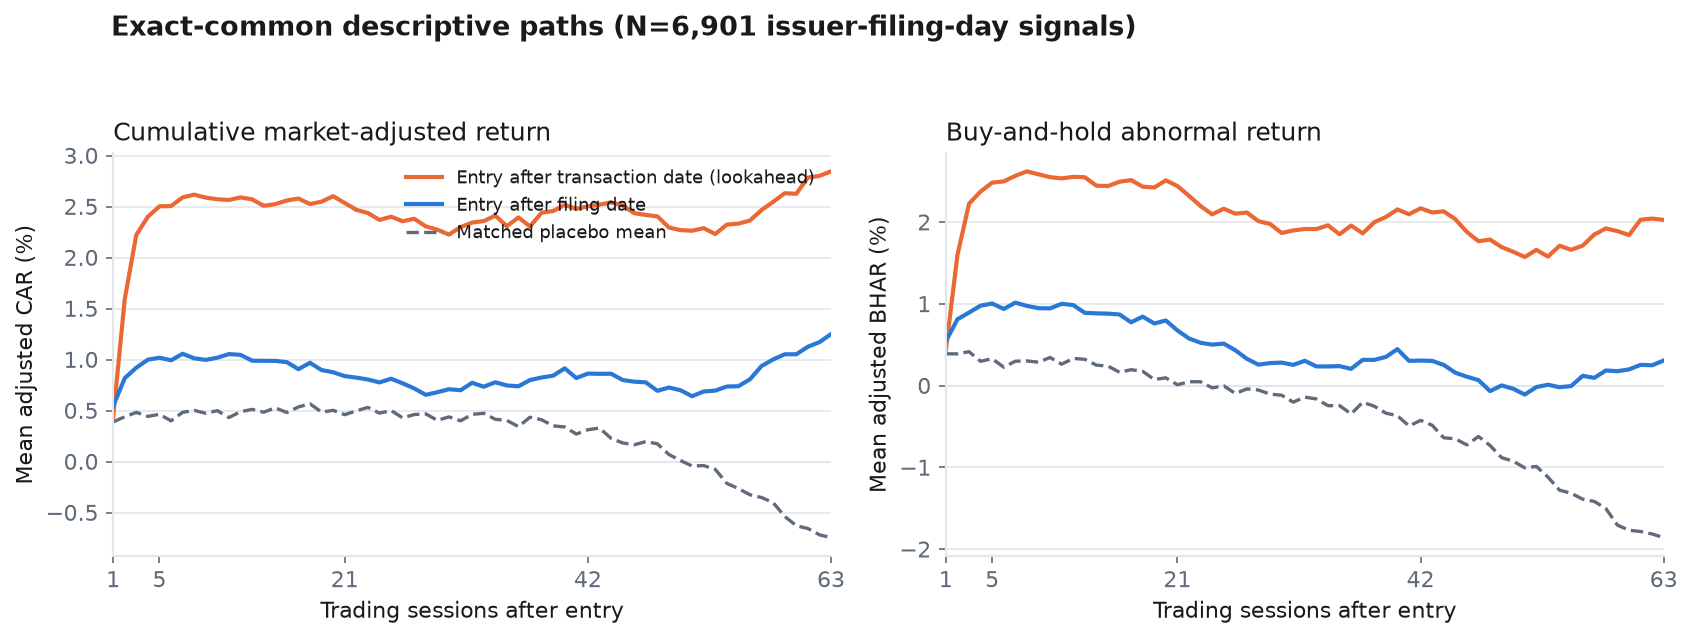
The results demonstrate that transaction-date paths show higher returns because they capture pre-publication information—returns that were, by definition, unavailable to the public at the time. At a 63-session horizon, the difference between transaction-date and filing-date entry is approximately 1.595 percentage points. This gap serves as a diagnostic tool for researchers, reinforcing that any study failing to anchor on the public filing date is likely overestimating the "information value" of the disclosure.
Statistical Inference and Market Sensitivity
To ensure the robustness of the results, the study employs the Cameron-Gelbach-Miller two-way clustered covariance estimator. This method accounts for the fact that an issuer may appear in the sample multiple times and that many issuers share the same market month. By clustering on both dimensions, the study prevents the artificial inflation of t-statistics.
The research also explores a "market model" sensitivity check, which produces larger estimates than the primary adjusted CAR analysis. While a market model might suggest a 63-session return as high as 6.560%, this figure is largely driven by a negative pre-event alpha. Because 65.2% of the fitted alphas in the model are negative, the cumulative residuals are mechanically lifted over time. The study emphasizes that this is a sensitivity check, not the headline result, warning readers against the danger of selecting models that favor higher, albeit less stable, return estimates.
Implications for Market Participants
The study concludes with a sobering assessment for those seeking a "silver bullet" for portfolio management. While the positive association observed in the first five sessions is statistically robust, it does not constitute a deployable trading strategy. There is no accounting for transaction costs, market impact, or the liquidity constraints of the underlying securities. For instance, in nearly 10% of the signals, the disclosed purchase value exceeds 100% of the median daily dollar volume, illustrating that an attempt to replicate these trades would significantly move the market.
For institutional investors and academics, the takeaway is clear: the utility of Form 4 data lies in its role as a high-frequency, event-driven signal that carries short-term informational value, but it is not a harbinger of sustained, long-term alpha. The methodological rigor required to arrive at this conclusion—preserving filing times, cleaning corporate actions, and employing conservative statistical clustering—is essential for any serious study of corporate disclosure.
The full dataset, including the manifest of SHA-256 checksums and the execution environment, has been made available via open-source repositories to encourage reproducibility. As the financial industry continues to lean into automated data pipelines, the lessons learned from this analysis—namely, that data quality and rigorous filtering often matter more than the sophistication of the model itself—will remain the gold standard for evidence-based research. By transparently documenting the "funnel" of data, from the raw SEC filings to the final result, this research provides a template for how modern financial data engineering can bridge the gap between regulatory transparency and market reality.