The Market’s Biggest Buyer Is Stepping Back As Corporate Buybacks Slow and Massive IPO Waves Alter US Equities Landscape

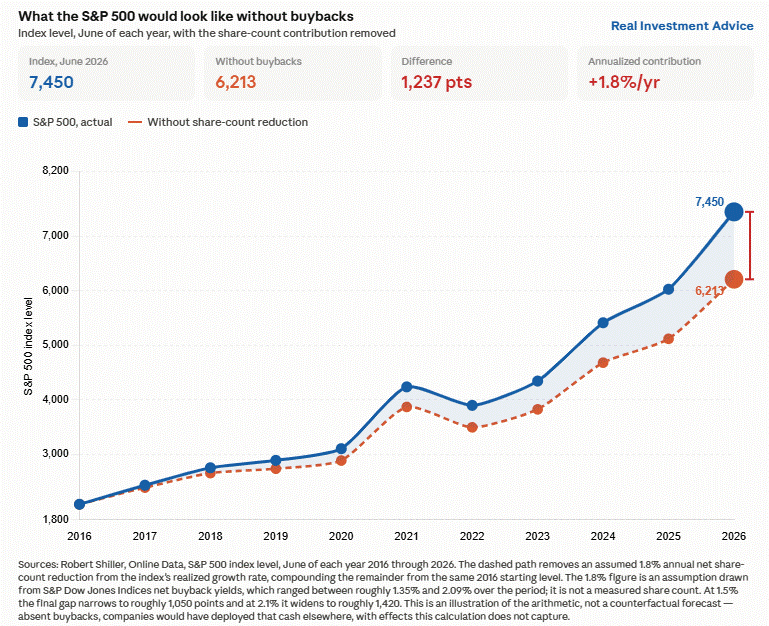
For the better part of the past decade, corporations have served as the single largest marginal buyer of United States equities, anchoring a historic bull market through a relentless wave of stock repurchases. However, structural shifts are beginning to materialize across Wall Street. According to recent market data, stock buybacks reached a staggering peak of $1.020 trillion during the twelve-month period ending in September 2025, constituting roughly 60% of all cash returned to shareholders by S&P 500 companies. This immense liquidity tailwind has heavily influenced historical equity returns. A granular decomposition of S&P 500 performance from June 2021 to June 2026 reveals that while earnings per share expanded at an annualized rate of 13.2%, the price-to-earnings multiple actually contracted by 1.1%. Consequently, the entirety of the index’s net advance derived directly from organic corporate earnings growth. Within that expansion, share count reductions accounted for an estimated 1.8% annually—representing roughly 14% of total returns and translating to approximately 1,240 index points accumulated since 2016.

This monumental financial cushion, however, is rapidly losing momentum. Major technology titans and capital-intensive corporations are pivoting away from share buybacks to fund aggressive, multi-billion-dollar investments in artificial intelligence infrastructure. Alphabet and Meta notably paused their respective share repurchase programs during the first half of 2026 to redirect capital toward AI development. Meta took an even more radical step by introducing a novel class of nonvoting stock designed explicitly as a capital-raising mechanism, effectively transforming the former buyback champion into a net issuer of equity. Simultaneously, primary markets are experiencing a massive influx of new equity supply. SpaceX completed a massive public offering raising approximately $85.7 billion in June, with additional shares slated to hit the open market as insider lock-up periods expire. Furthermore, secondary offerings and new tech floats are compounding the supply shock; Anthropic is widely anticipated to launch an initial public offering valued near $1 trillion in November, with OpenAI expected to follow suit with a similarly scaled public debut over the subsequent two quarters.
Market Structure and Technical Developments
The broader equity market is consequently being tasked with absorbing an unprecedented wave of newly issued equity precisely as its historical bedrock of demand—corporate buybacks—begins to retreat. While this dynamic does not guarantee an immediate market downturn, analysts emphasize that one of the most influential structural supports for American equities is losing its potency.
The S&P 500 closed the week ending October 24, 2026, at 7,623.68, marking a 0.4% weekly decline and resting roughly 2.4% below its record-setting close near 7,815 achieved on October 6. Technically, the benchmark index trades 1.0% below its 50-day moving average of 7,702, while stabilizing directly on its 100-day moving average of 7,605. Despite these near-term pullbacks, the broader structural uptrend remains intact, with the index maintaining a 4.5% cushion above its 200-day moving average of 7,293.
Market breadth indicators corroborate the cooling momentum among mega-cap leaders. The 14-day Relative Strength Index (RSI) has drifted downward to a neutral reading of 42, while the Moving Average Convergence Divergence (MACD) indicator has slipped below its signal line, signaling potential exhaustion in near-term rallies. Notably, unlike previous sharp corrections confined strictly to the technology sector, current breadth shows divergences: equal-weight indices managed a 1.1% gain over the week, and the Dow Jones Industrial Average rose 1.4%. This performance disparity indicates that average stocks are holding ground while mega-cap technology names drag capitalization-weighted indices lower.
Sector performance analysis underscores a rotation beneath the market’s surface. Eight of the eleven primary S&P 500 sectors currently trade ahead of the headline index relative to their 50-day moving averages, with technology, industrials, and communications serving as the primary laggards. Energy, healthcare, and consumer staples are exhibiting the most extended technical setups, prompting portfolio managers to evaluate rebalancing strategies that shift capital away from crowded defensive trades and toward beaten-down growth segments once technical indicators reach deeply oversold extremes.
Macroeconomic Catalysts and Federal Reserve Policy
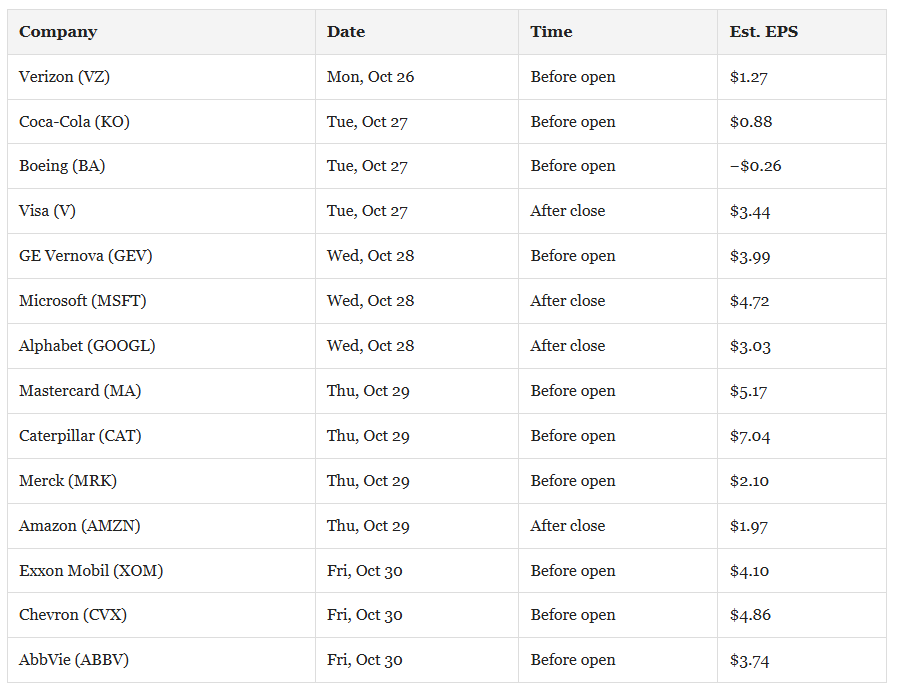
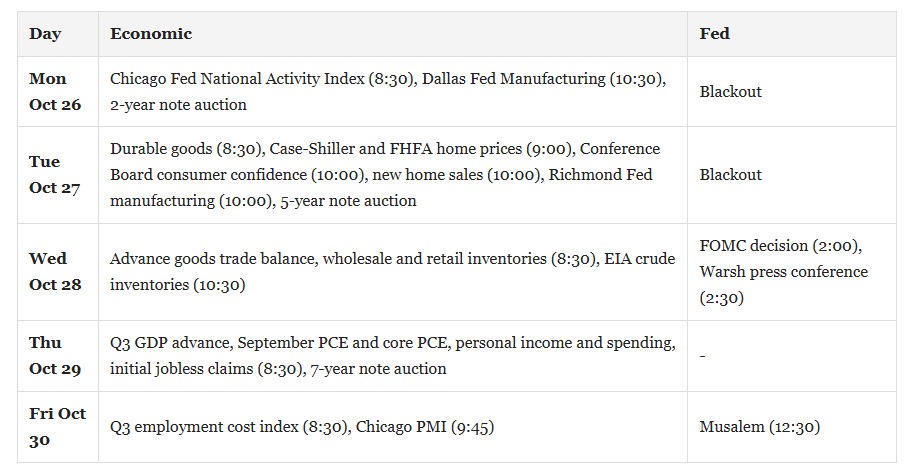
The incoming economic data calendar presents a formidable test for market stability, concentrating critical macroeconomic decisions and corporate reports into a compressed 48-hour window. Approximately 44% of the S&P 500 by market capitalization is scheduled to report earnings, led by Microsoft and Alphabet on Wednesday, followed by Amazon on Thursday, and Apple in early November. These reports will be heavily scrutinized for concrete evidence regarding whether massive capital expenditures directed toward artificial intelligence are beginning to yield tangible financial returns.

Concurrently, the Federal Open Market Committee (FOMC) is convening for its scheduled monetary policy meeting. Federal Funds futures indicate that market participants assign a roughly 10% probability to a benchmark interest rate hike at this meeting—down sharply from 28% the prior week. However, pricing for the December policy meeting leaves an 85% probability of further tightening on the table. Following the Federal Reserve’s decision to raise the target range to 3.75%-4.00% in September—its first rate increase since 2023—the 10-year Treasury yield has surged above 5.3%, touching levels last observed in 2007.
This sharp ascent in long-term borrowing costs has ignited intense debate among economists and strategists regarding the cumulative risks of monetary over-tightening. Because the central bank’s traditional policy tools primarily impact aggregate demand, economists question how much economic runway remains before high borrowing costs induce broader financial strain.

Implications and Outlook for Investors
The intersection of receding corporate buybacks, soaring primary equity supply, sticky long-term interest rates, and towering valuations creates a complex trading environment heading into the final months of 2026. Financial advisors recommend a disciplined approach for market participants, advising against chasing stretched defensive sectors and instead utilizing market strength to trim overextended positions.
The immediate technical battleground centers on the 100-day moving average at 7,605. A decisive hold at this threshold, supported by resilient mega-cap earnings and accommodating Federal Reserve communications, could provide the foundation for a relief rally toward the 50-day moving average near 7,700. Conversely, a breakdown below the 100-day moving average risks exposing deeper support levels at the September low of 7,564 and the July low near 7,494, placing the foundational 200-day moving average at 7,293 under direct scrutiny. As corporations step back from their historic role as the market’s primary shock absorber, investor selectivity and rigorous risk management will remain paramount.