The Dollar Pauses Amidst Inflation Crosscurrents as Geopolitical Tensions Resurface


The US Dollar concluded the trading week without a definitive directional bias, a notable outcome given the significant shifts observed in the US inflation landscape. Recent Consumer Price Index (CPI) and Producer Price Index (PPI) data for June both registered surprisingly strong declines, reinforcing the prevailing narrative of moderating price pressures across the economy. However, instead of prompting a sustained weakening of the Greenback, these encouraging inflation figures were met with investor caution. A palpable uncertainty emerged regarding the durability of this disinflationary trend, with market participants questioning whether the positive inflation readings would hold firm beyond a single reporting period.

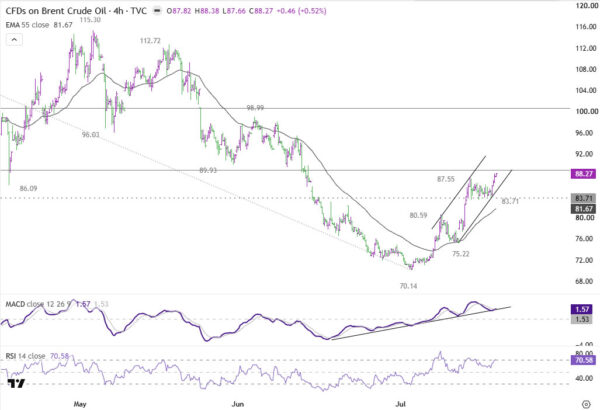
This underlying hesitation was largely driven by the week’s second, and arguably more forward-looking, development: a renewed escalation in the US-Iran conflict. This geopolitical flare-up sent oil prices sharply upward, with Brent crude closing above the $88 per barrel mark and West Texas Intermediate (WTI) reclaiming the $80 level. Given that the softer inflation observed in June was significantly influenced by a decline in energy prices, the rebound in crude oil immediately raised concerns that much of the progress made in taming inflation could be unwound in the upcoming one or two inflation reports. In essence, financial markets shifted their focus from what inflation had done in the recent past to what it was likely to do in the near future.
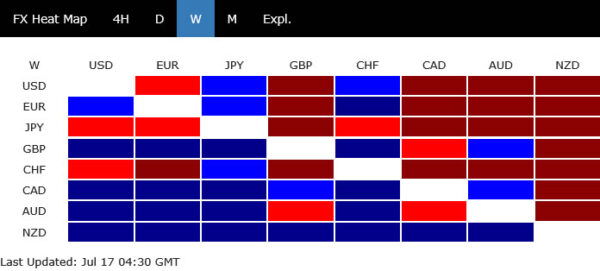
This confluence of factors created a market environment caught between opposing forces. On one hand, softer inflation data diminished the perceived urgency for further monetary tightening by the Federal Reserve. On the other hand, the surge in oil prices simultaneously revived the risk of inflation re-accelerating, thereby preventing a complete erosion of rate-hike expectations. This tug-of-war was clearly reflected in currency performance. The New Zealand Dollar emerged as the week’s leading gainer, followed by the Canadian Dollar and Sterling. Conversely, the Japanese Yen finished as the weakest major currency. The US Dollar itself settled near the middle of the pack, a fitting representation of a market still grappling with the delicate balance between the receding disinflationary pressures and the resurfacing inflation risks.
Soft CPI and PPI Briefly Shifted the Fed Outlook
The inflation reports released for June offered some of the most compelling evidence to date that US price pressures were indeed moderating. The headline CPI figure registered a significant month-over-month decline of -0.4%, a sharp reversal from the 0.5% increase seen in May. This brought the annual inflation rate down from 4.2% year-over-year to 3.5% year-over-year, comfortably below market expectations. Core CPI, which excludes volatile food and energy components, remained unchanged on a monthly basis, slowing its annual rate from 2.9% year-over-year to 2.6% year-over-year. At the wholesale level, the PPI also saw a substantial decrease, falling -0.3% month-over-month. This marked the largest monthly decline in producer prices in over six years, further reinforcing the view that upstream inflationary pressures were easing.
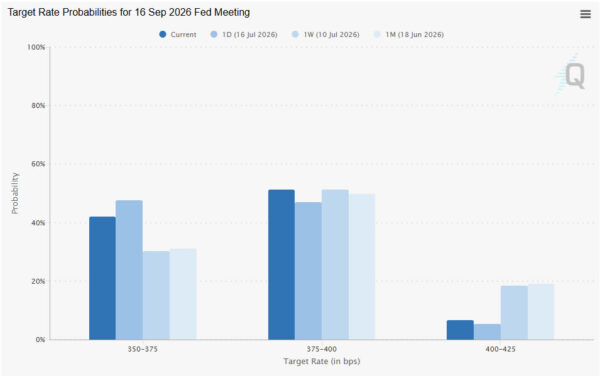
The broad-based nature of this slowdown suggested that it was more than just a transient statistical anomaly. After months of persistent and stubborn inflation, the consecutive downside surprises in both consumer and producer prices prompted a reassessment of the Federal Reserve’s tightening trajectory. Market reactions were swift. Fed funds futures, which track expectations for future interest rate movements, saw the implied probability of a September rate hike plummet from approximately 70% a week prior to around 58% in the immediate aftermath of the data release.
However, a crucial caveat was embedded within the composition of this inflation deceleration. A significant portion of the improvement in both CPI and PPI was attributable to lower gasoline prices. This reflected a period where geopolitical tensions in the Middle East had temporarily eased, leading to a retreat in oil prices. As energy markets reversed course later in the week, investors quickly recognized that the encouraging inflation data from June was built upon a foundation that was already beginning to shift. Consequently, the disinflationary narrative, while appearing genuine, also started to look increasingly fragile.
WTI Above $80 Reshapes the Inflation Narrative
Perhaps the most defining market development of the week was not the softer inflation data itself, but the decisive rebound in crude oil prices. As the geopolitical conflict between the United States and Iran intensified, concerns over global energy supply chains escalated sharply. The conflict expanded beyond previous tit-for-tat exchanges, with reports of strikes targeting critical infrastructure within Iran, including bridges, rail networks, telecommunications facilities, and an airport. In parallel, Iranian retaliation spread across the Persian Gulf region, impacting Kuwait, Bahrain, Qatar, and Oman, as well as a US military position in Syria. Against this backdrop of heightened geopolitical risk, WTI crude settled above $80 per barrel, and Brent crude closed above $88 per barrel, marking their strongest weekly gains since April.
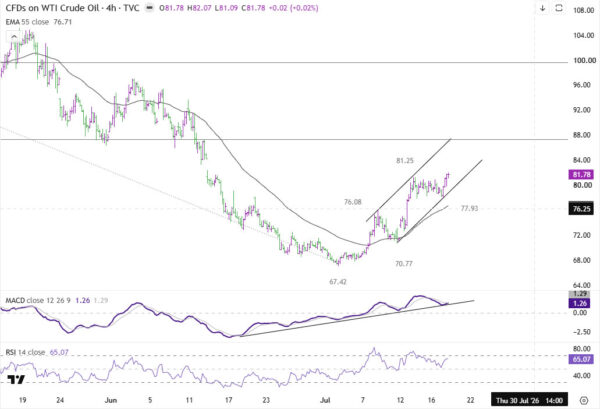
The significance of WTI reclaiming the $80 level cannot be overstated in terms of its implications for the inflation outlook. The disinflationary surprise recorded in June was heavily influenced by the decline in energy prices, which in turn followed a brief easing of Middle East tensions earlier that month. With crude oil now retracing those losses, the energy component of inflation is poised to move in the opposite direction in the coming months. Consequently, markets are increasingly questioning whether the encouraging CPI and PPI readings from June represent a temporary dip rather than the beginning of a sustained moderation in inflation.
This evolving inflation outlook also helps explain why expectations for further Federal Reserve rate hikes did not continue to decline despite the softer economic data. Investors have shifted their focus from what June inflation revealed to what July and August inflation might look like if oil prices remain elevated. With crude oil now acting as a renewed source of inflationary pressure, energy markets – rather than last month’s economic data – have become the primary driver of Federal Reserve repricing and, by extension, the direction of the US Dollar.
Fed Officials Maintain a Hawkish Stance
Throughout the week, Federal Reserve officials largely maintained a cautious, hawkish-leaning tone, even as the June inflation reports came in softer than anticipated. In testimony before Congress, Federal Reserve Chair Kevin Warsh explicitly rejected any suggestion that the Fed’s work on inflation was complete. He argued that, despite recent progress, inflation remained unacceptably high. Warsh also reiterated his view that monetary policy was "not particularly restrictive," underscoring the Committee’s belief that there remained scope for further tightening should inflation risks intensify.
Governor Christopher Waller echoed this sentiment. Prior to the release of the inflation data, Waller had indicated that an additional rate hike could be warranted in the near term if CPI and PPI reports surprised on the upside. While the actual data reduced the immediate case for further tightening, his remarks highlighted the Fed’s heightened sensitivity to any signs of renewed inflationary pressure. Dallas Fed President Lorie Logan emerged as the week’s most hawkish voice, becoming the first Fed official to publicly support another interest rate increase since Warsh assumed the chairmanship.
The overarching message from the Federal Reserve remained consistent despite the encouraging inflation data. Policymakers acknowledged the improvement in price stability but showed no inclination to signal that further rate hikes were definitively off the table. Instead, the Committee appears content to allow incoming economic data – and increasingly, developments in energy markets – to guide its future policy decisions. With little deviation from established Fed rhetoric, markets are now closely observing whether elevated oil prices will ultimately compel policymakers to revert to a more aggressive tightening stance.
Technical Outlook: Dollar Awaits Confirmation from Oil and Yields
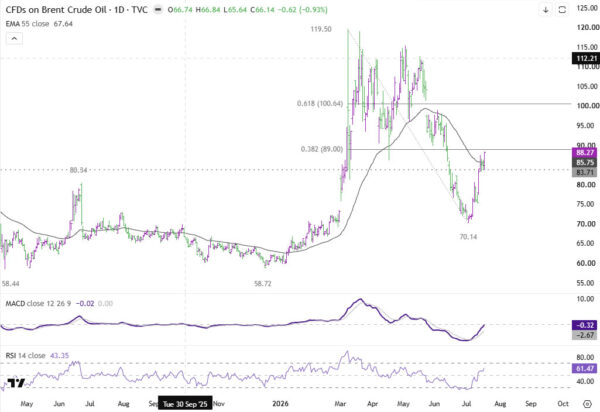
Brent Crude Oil: The trajectory of Brent crude remains a critical market indicator. The recent advance from a low of $70.14 has exhibited characteristics of a five-wave impulsive rally, suggesting a potential bullish trend reversal. The closing price above the 55-day Exponential Moving Average (EMA), now situated at $85.75, strengthens this interpretation. The next significant technical hurdle lies at the 38.2% Fibonacci retracement level of the move from $119.50 to $70.14, which falls at approximately $89.00. This price zone also coincides with the psychologically important $90 level.
A decisive break above this $89-$90 resistance zone would strongly argue for a reversal of the entire decline from $119.50. Such a move would then pave the way for a potential retest of the 61.8% Fibonacci retracement level at $100.64, which is in proximity to the $100 psychological mark. Conversely, a failure to overcome the $89-$90 area, followed by a break below the $83.71 support level, would suggest that the recent rally was merely a corrective rebound and has likely concluded.
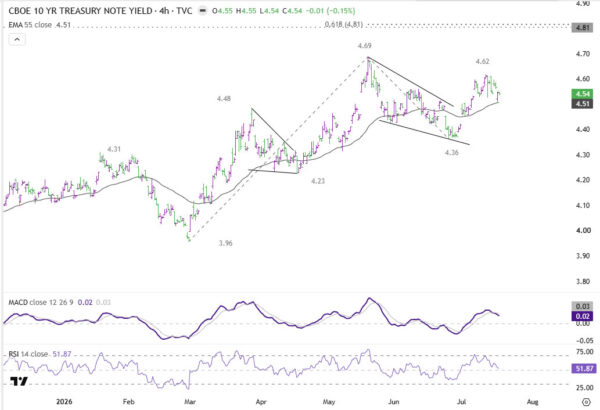
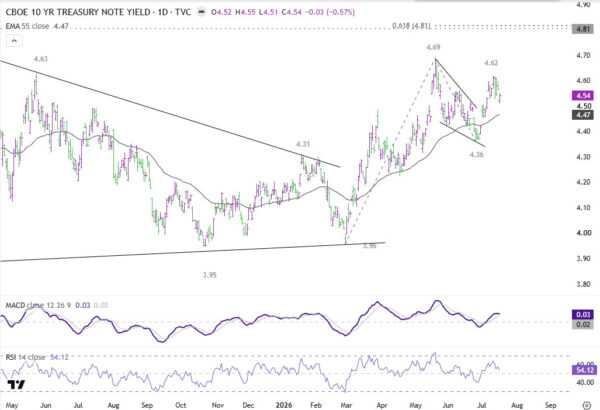
US 10-Year Treasury Yield (TNX): The US 10-year Treasury yield experienced a dip to 4.51% but subsequently recovered after finding support at the 55-day 4-hour EMA, currently at 4.51%. The outlook remains unchanged, with the correction from the 4.69 high having potentially completed at 4.36%. This suggests that the rise from the 3.96 low is resuming. A move above the 4.62 resistance level would affirm this bullish case, targeting a retest of the 4.62 high.
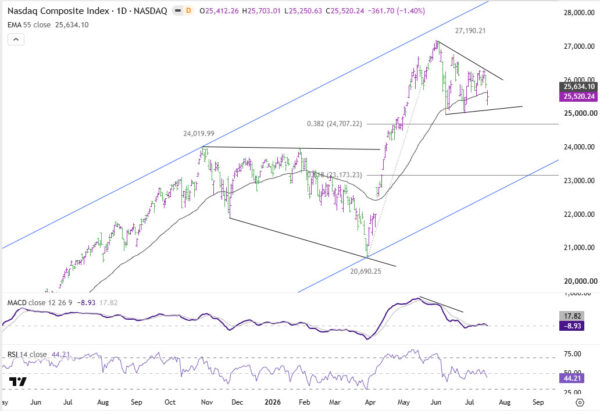
NASDAQ Composite: Friday’s selloff in the NASDAQ and its breach of the 55-day EMA (currently at 25634.10) indicates that the consolidation pattern from the 27190.21 high is extending with another downward leg. Strong support is anticipated around the 38.2% Fibonacci retracement of the move from 20690.25 to 27190.23, which is located at 24707.22. This level should contain the downside and potentially trigger a rebound. However, a firm break below this Fibonacci support would suggest that the current decline is not merely a short-term correction but could be part of a larger-scale downturn, posing a risk of deeper selloffs towards the 61.8% retracement level at 23173.23.
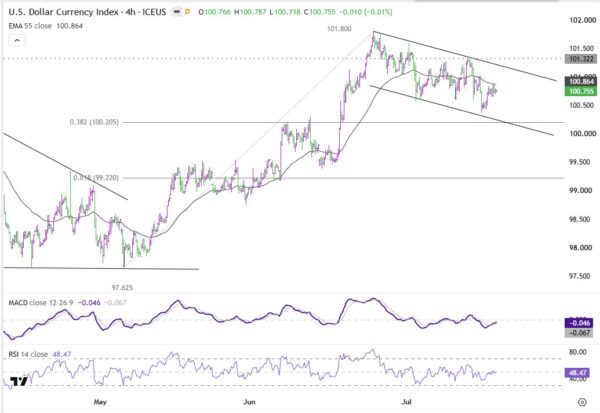
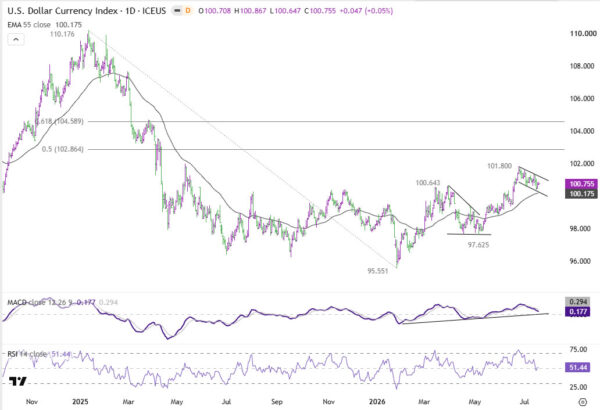
US Dollar Index (DXY): The US Dollar Index’s correction from the 101.80 high extended lower last week but managed to hold above the 38.2% Fibonacci retracement of the move from 97.62 to 101.80, which sits at 100.20. This level also coincides with the 55-day EMA, currently at 100.17. Further upside is still anticipated. A move above the minor resistance at 101.32 would bring a retest of 101.80 into focus. A decisive break above this level would extend the overall rise from the 95.55 low towards the 50% retracement of the 110.17 to 95.55 move, which is at 102.86. Conversely, a sustained break below the 55-day EMA would signal a deeper decline back towards the 97.62 support level, increasing the probability of a near-term bearish reversal.
Outlook: Gulf Developments Likely to Dictate Dollar’s Next Move
As the trading week commences, the US Dollar remains in search of a clear directional catalyst. If the geopolitical tensions between the US and Iran continue to escalate, Brent crude oil is likely to challenge or surpass the $90 per barrel threshold. Such a scenario would reinforce market expectations that the recent disinflationary trend is temporary. This outcome would likely lead to a rise in Treasury yields, strengthen pricing for an additional Federal Reserve rate hike later this year, and provide renewed support for the US Dollar.
Conversely, any meaningful de-escalation in the conflict that allows oil prices to retrace would rekindle confidence that inflation is indeed returning to a downward path. This would encourage markets to scale back tightening expectations and potentially reopen the door for broader US Dollar weakness.
At present, the escalation scenario appears marginally more probable. The increasing coordination of recent military operations and Iran’s expanding retaliatory actions suggest that the conflict is entering a more perilous phase than earlier exchanges. Nevertheless, investors have learned in recent weeks that geopolitical developments can shift rapidly. Consequently, the US Dollar remains at a critical juncture, with its next significant move likely to be determined less by Federal Reserve pronouncements or scheduled economic data releases, and more by the ongoing trajectory of oil prices and their impact on the inflation outlook.
EUR/USD Weekly Outlook
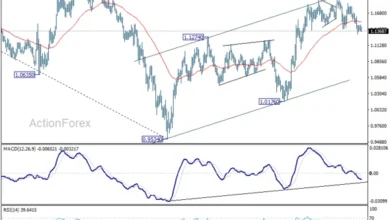
Near-Term Outlook: The EUR/USD pair extended its consolidation pattern above the 1.1323 level last week, and the outlook remains unchanged. The initial bias for the current week is neutral. With the support at 1.1499 now acting as resistance, further downside movement is anticipated. A break below 1.1323 would resume the decline from the 1.2081 high, targeting the 100% projection of the move from 1.2081 to 1.1408, which falls at 1.1175. However, a decisive break above 1.1499 would shift the bias back to the upside, with a potential target at the 1.1621 resistance level.
Medium-Term Outlook: In the broader context, focus remains on the 38.2% Fibonacci retracement of the move from 1.0176 to 1.2081, situated at 1.1353. A decisive break below this level would revive the case for a medium-term bearish trend reversal, following rejection by the significant 1.20 key cluster resistance. Further declines could then target the 61.8% retracement level at 1.0904. Conversely, a strong rebound from 1.1353, followed by a break of the 1.1621 resistance, would preserve the medium-term bullish outlook.
Long-Term Outlook: Over the long term, the 38.2% Fibonacci retracement of the move from 1.6039 to 0.9534, located at 1.2019 and close to the psychological 1.2000 level, is the key determinant for the outlook. Rejection by this level would maintain the multi-decade downtrend from the 1.6039 high (achieved in 2008) and keep the outlook neutral at best. However, a decisive break above the 1.2000/1.2019 zone would suggest a long-term bullish trend reversal, with a potential target at the 61.8% retracement level at 1.3554.