Why Small Caps Have Recently Traded Like A Bond Proxy And Other Market Insights

Financial markets are currently navigating a complex web of macroeconomic crosscurrents, characterized by shifting correlations between equities and fixed-income assets, exuberant retail investor positioning, and major corporate earnings reports. As autumn unfolds, distinct patterns are emerging across asset classes, highlighting structural vulnerabilities and unusual behaviors that continue to challenge traditional investment paradigms. Among the most notable developments is the behavior of small-cap equities, which have increasingly mirrored the performance of long-term government bonds, alongside surging retail participation and notable corporate milestones from newly public space exploration giants.

The Russell 2000 Index, which serves as the benchmark for small-cap equities, has experienced a challenging period, falling approximately 8.2% since late June. Unlike the S&P 500, which has repeatedly punched through historical milestones to set fresh record highs, the small-cap index has failed to log a new high in four months. However, a notable shift has occurred recently: small-cap stocks have begun to trade higher alongside falling bond yields. This increasing sensitivity is far from accidental; it underscores fundamental structural differences between smaller enterprises and their large-cap counterparts.
Small-cap companies typically face three distinct structural interest-rate vulnerabilities that large-cap firms are largely insulated from. These include a higher proportion of floating-rate debt, a more frequent need to refinance maturing obligations in higher-rate environments, and a greater reliance on regional banking institutions for credit lines. Consequently, small caps have underperformed the broader equity market during periods of sustained high interest rates. While they are theoretically positioned to outperform if yields continue a steady descent, market analysts caution that a rapid decline in yields driven by credit distress or a sudden economic growth scare could render the yield benefit negligible or even harmful.
Data quantifying this relationship highlights a stark structural departure from historical norms. The rolling 30-day correlation between the Russell 2000 Index and the 7- to 10-year Treasury benchmark has averaged 0.41 throughout the year, a dramatic increase compared to the modest 0.11 average recorded over the preceding four-year period. This correlation reached a dramatic peak of 0.87 in May. Historically, this relationship frequently oscillated around zero and spent prolonged stretches in negative territory—plummeting as low as -0.83 during the regional banking stress experienced in March 2023.
Retail Investor Sentiment And Market Positioning
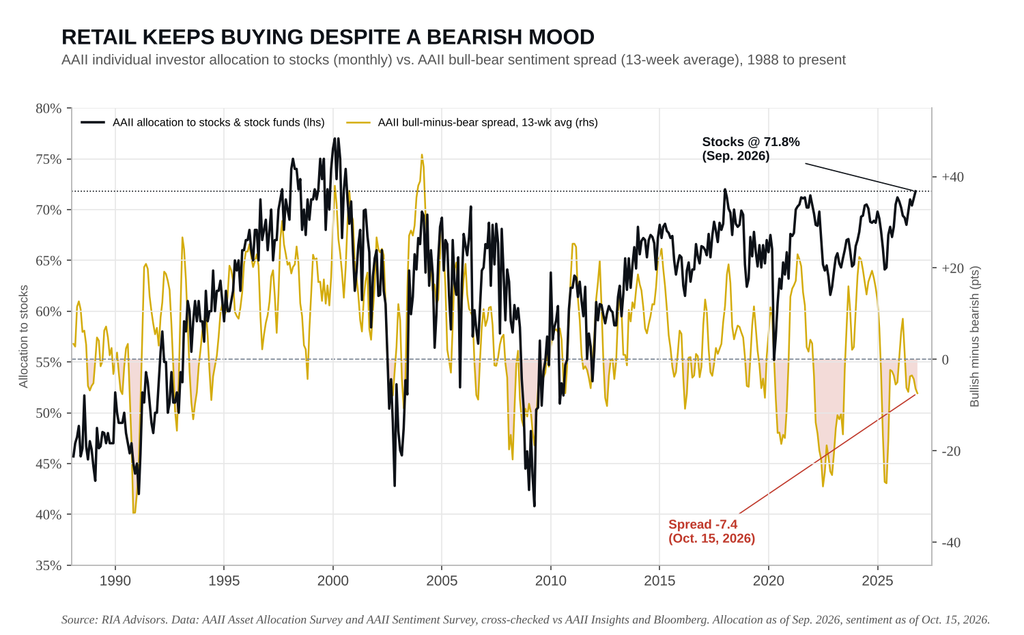
Beneath the surface of headline equity indices lies a striking paradox involving retail investor sentiment and portfolio allocation. According to recent asset allocation surveys from the American Association of Individual Investors (AAII), individual investors currently hold roughly 71.8% of their investment portfolios in equities. Outside of a brief reading of 72% registered at the close of 2017—immediately preceding the market volatility event known as "Volmageddon"—observers must look back to the peak of the dot-com bubble in 2000 to find a comparable level of equity concentration among retail participants.
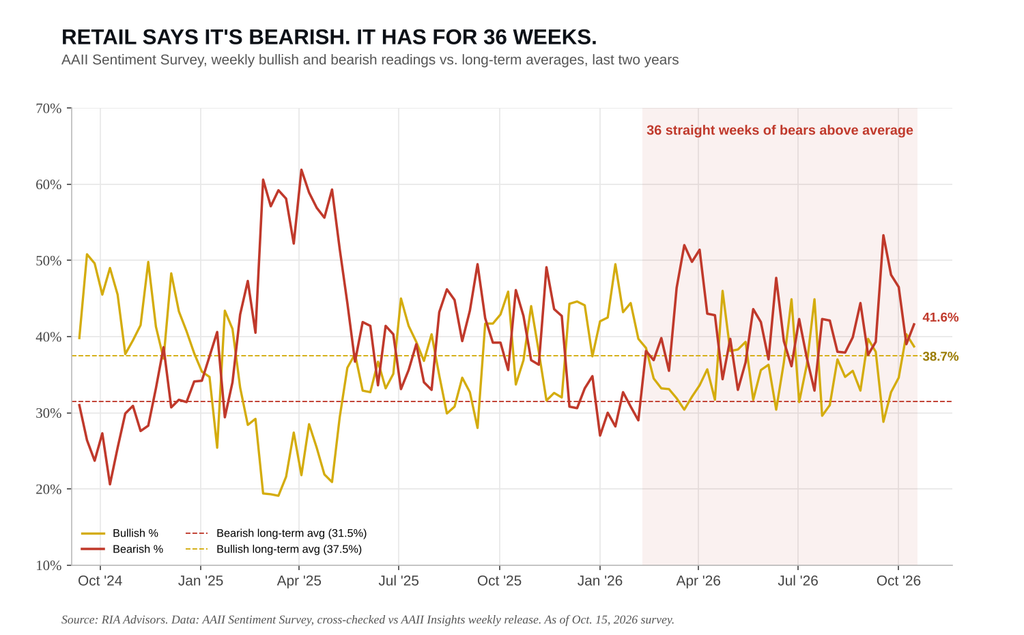
This aggressive equity positioning exists in stark contrast to prevailing market mood. The AAII survey indicates that bearish sentiment has lingered above its historical long-term average of 31.5% for 36 consecutive weeks, with recent bears rising to 41.6% compared to 38.7% bulls. Typically, a persistently high level of bearish sentiment serves as a classic contrarian buy signal. However, market strategists emphasize that sentiment only carries predictive weight when it successfully alters investor behavior. In the current environment, retail participants report elevated anxiety levels while simultaneously maintaining maximum equity exposure. When market participants express fear but refuse to reduce risk, that fear functions less like a protective cushion and more like a trigger waiting for a definitive catalyst.
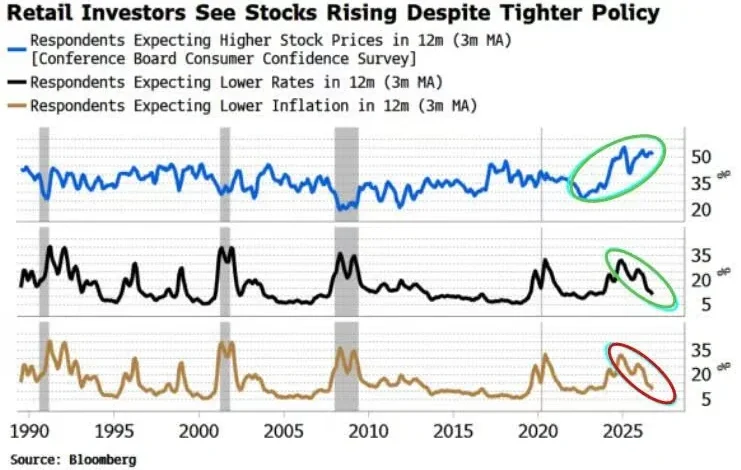
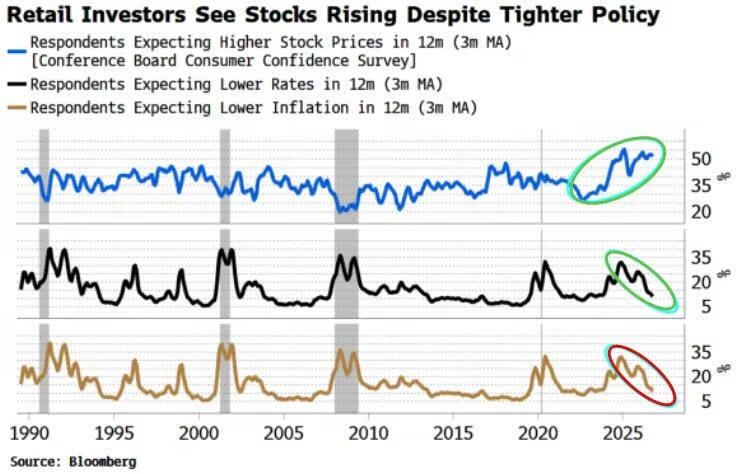
Data from the Conference Board reinforces this narrative of unwavering optimism regarding long-term equity appreciation. More than half of all surveyed respondents project that stock prices will trade higher over a 12-month horizon, marking a nearly 35-year high for that specific metric. Conversely, the proportion of respondents anticipating lower interest rates and reduced inflation has dropped sharply in recent months. This pervasive bullishness stands in sharp contrast to warnings issued by prominent macroeconomic figures and institutional investors, several of whom have publicly characterized current valuations—particularly within artificial intelligence sectors—as exhibiting bubble-like characteristics. When nearly all market participants are heavily positioned on the long side of the trade, the pool of marginal buyers becomes remarkably shallow upon the arrival of an exogenous shock.
SpaceX Reports Record First Public Quarterly Earnings
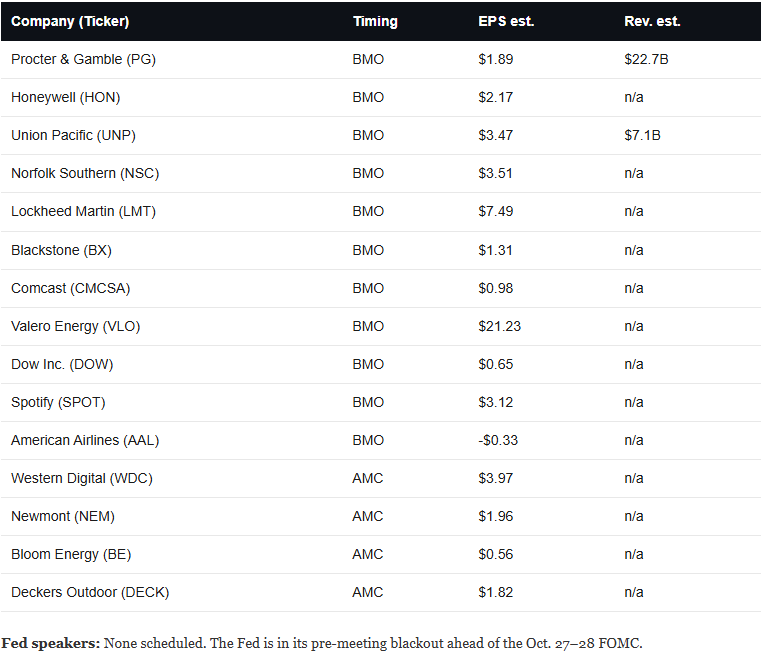
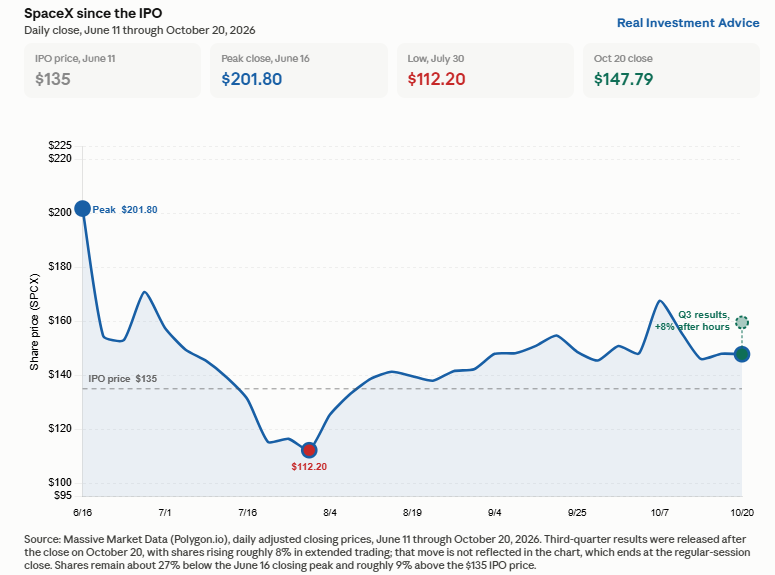
In corporate developments, SpaceX captured market attention by reporting its inaugural quarterly earnings report as a publicly traded corporation, driving its stock price up roughly 8% in post-market trading. The aerospace and defense company posted total quarterly revenue of $14.58 billion, representing a staggering 161% year-over-year increase compared to the $5.6 billion generated in the same period last year, and easily outpacing Wall Street consensus estimates of $12.87 billion. Net income reached $4.4 billion, a dramatic turnaround from the $1.1 billion net loss recorded in the prior-year period.
Despite the blowout top-line figures, corporate expenditures similarly outpaced analyst projections. Capital expenditures surged to $19.6 billion for the quarter, eclipsing revenue by approximately $5 billion. The vast majority of this capital outlay—specifically $16.4 billion—was channeled into the company’s rapidly expanding Super Intelligence division, bringing its nine-month capital expenditure total to $48.1 billion.
Financial analysts note that a corporation allocating 134% of its revenue toward capital expenditures while simultaneously generating record profits represents an unusual financial dynamic. Under standard accounting rules, capital expenditures are classified as asset conversions—transforming cash into property, plant, and equipment—rather than immediate operating expenses. Consequently, these costs flow through the income statement gradually via depreciation over the estimated useful life of the assets. For example, a data center depreciated over a multi-year schedule contributes only a fraction of its total cost to annual expenses.
While SpaceX experienced a temporary reduction in free cash flow of approximately $10 billion during the quarter, the company remains insulated from near-term financing pressures. Having initiated its public life with a cash and marketable securities reserve of approximately $100 billion generated from its initial public offering, the enterprise maintains sufficient liquidity to fund its ambitious growth initiatives without tapping external capital markets. Additionally, corporate leadership confirmed that special committees have been established at both Tesla and SpaceX to formally discuss a potential strategic merger.

The Bond Market And Anticipation Of Federal Reserve Policy Errors
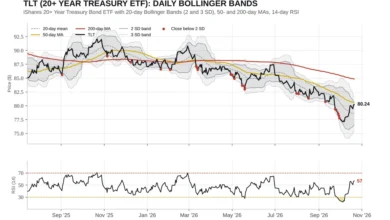
Fixed-income markets have simultaneously presented anomalies that have baffled seasoned macroeconomic observers. Following hotter-than-expected Consumer Price Index (CPI) data and a producer price index (PPI) surge that far exceeded consensus forecasts, coupled with a notable $10 per barrel increase in crude oil prices during the first half of October, conventional economic theory dictated that government bond yields should spike. Given that the 10-year US Treasury yield was already hovering near 5.25% at the start of the month, professional fixed-income traders anticipated yields pushing toward 5.50% or higher in the wake of persistent inflationary pressures.
Instead, the fixed-income market defied expectations. Following a brief initial spike immediately following the CPI release, the 10-year Treasury yield dropped significantly to 5.03%, with the 30-year yield mirroring the downward trajectory. Bonds rallied aggressively despite the release of hostile inflation metrics.
Commenting on the phenomenon, former PIMCO CEO Mohamed El-Erian posed a central question to market participants regarding why government bond yields continue to fall in the face of persistent inflationary data prints. While several explanations center around artificial intelligence-driven productivity gains and structural shifts in global supply chains, analysts suggest a more pressing catalyst: the bond market may be actively pricing in the rising probability that the Federal Reserve is being cornered into making a definitive policy error.
As financial markets navigate these competing crosscurrents—ranging from the interest rate sensitivities of small-cap equities and overextended retail positioning to monumental corporate earnings and bond market divergences—investors face an environment where traditional correlations are breaking down. Navigating this landscape requires careful risk management, disciplined asset allocation, and an acute awareness of the vulnerabilities inherent in a crowded market.