U.S. Housing Market Correction Deepens as 28 Major Cities Retreat from Historic Peaks Led by Austin and Oakland.

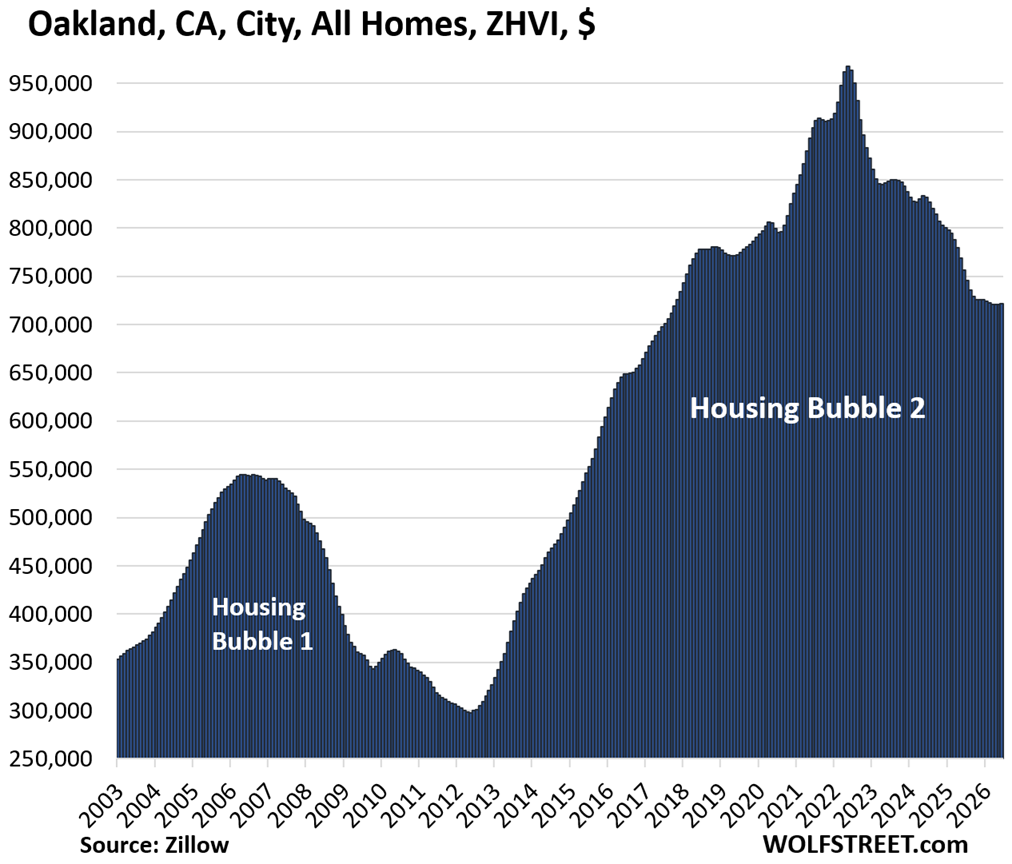
The landscape of the United States residential real estate market underwent a significant structural shift through the first half of 2026, as mid-tier home prices in the majority of the nation’s most expensive metropolitan areas continued their retreat from previous record highs. According to the latest seasonally adjusted data for June, home prices in 28 of the 33 major "expensive" cities tracked by industry analysts have fallen from their respective peaks established over the last four years. This correction is most pronounced in formerly "hyper-growth" markets, with Austin, Texas, recording a 27% decline from its peak, followed closely by Oakland, California, which has seen values tumble by 25%.
This widespread downward pressure on valuations marks a definitive end to the era of rapid, double-digit appreciation that characterized the early 2020s. While a small handful of markets, most notably Chicago and New York City, have managed to maintain or slightly increase their price levels, the broader trend suggests a cooling period as the market grapples with the long-term effects of higher interest rates, increased inventory, and a stabilization of pandemic-era migration patterns.
The Leaders of the Market Correction
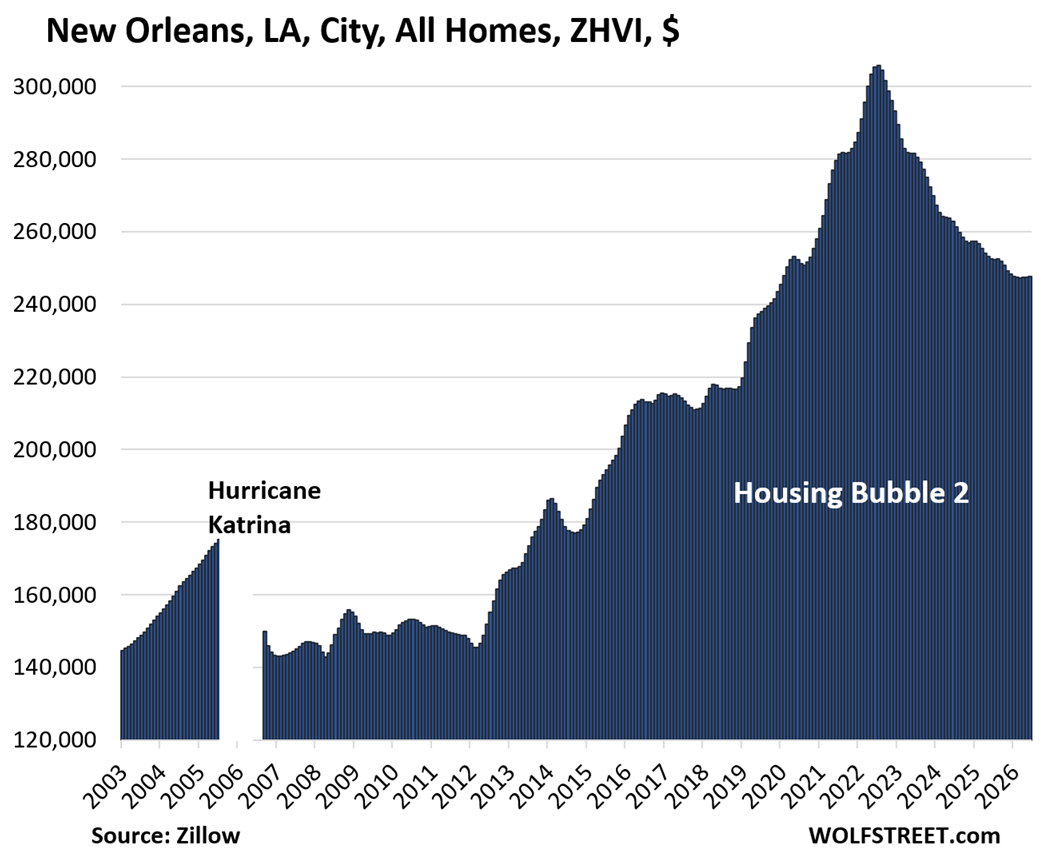
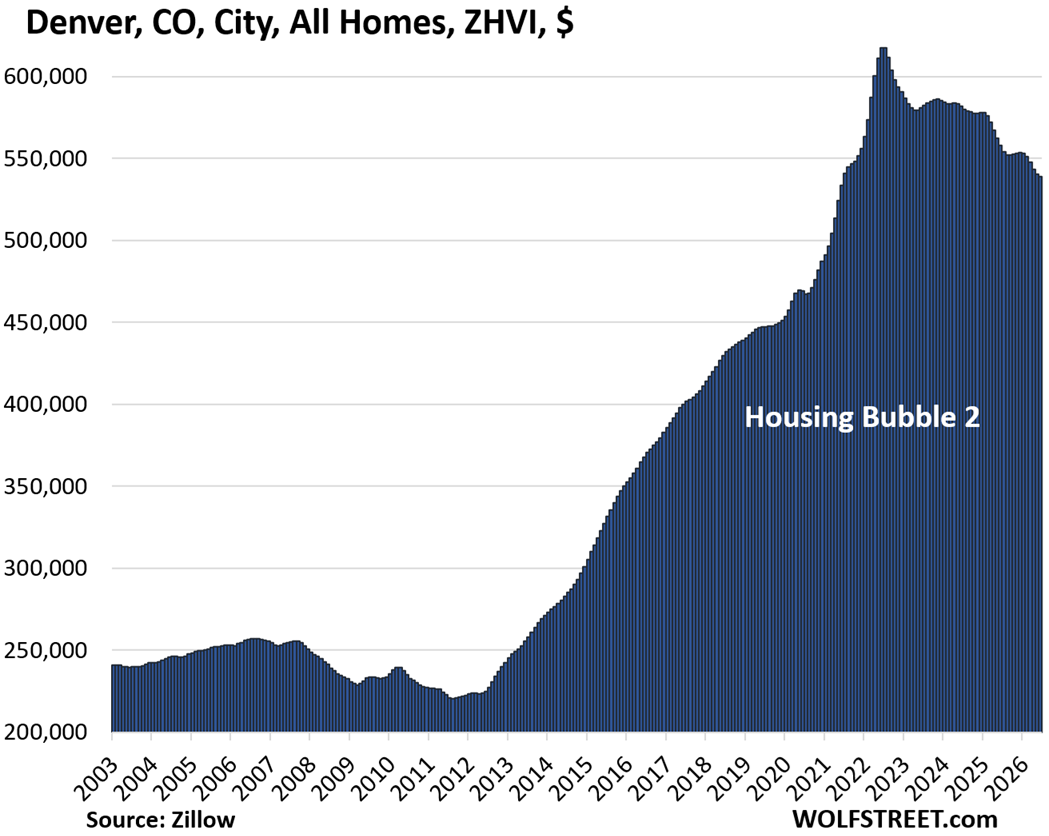
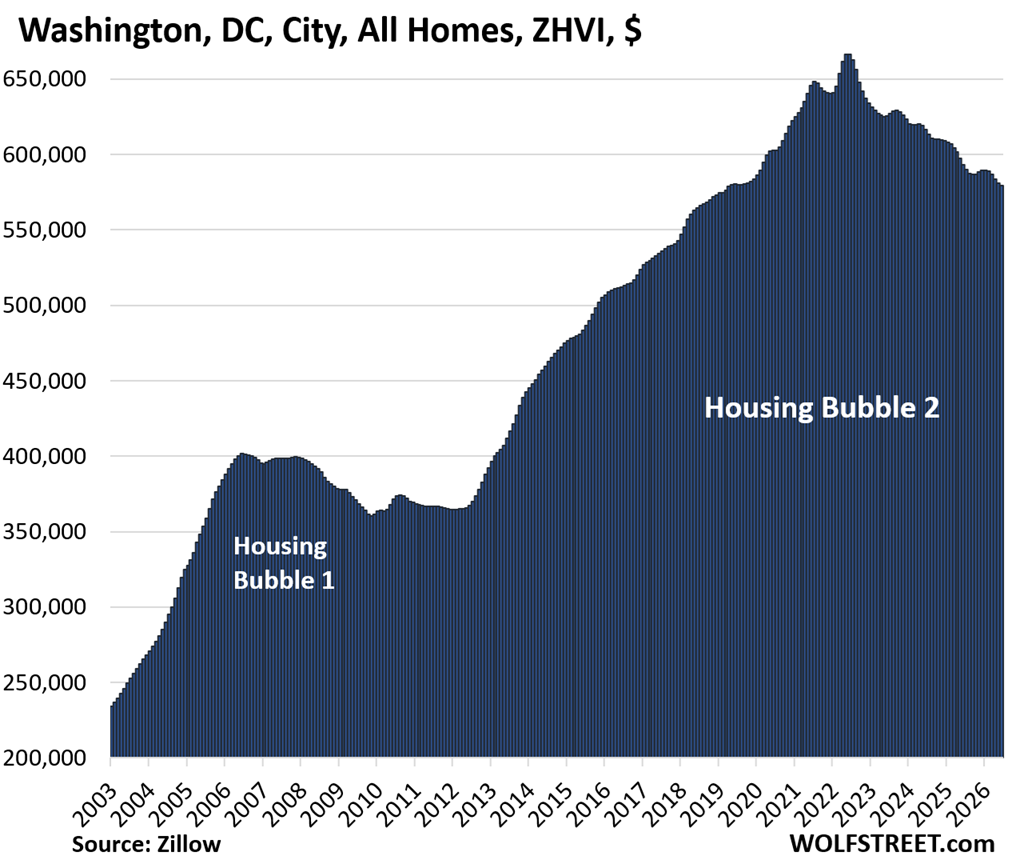
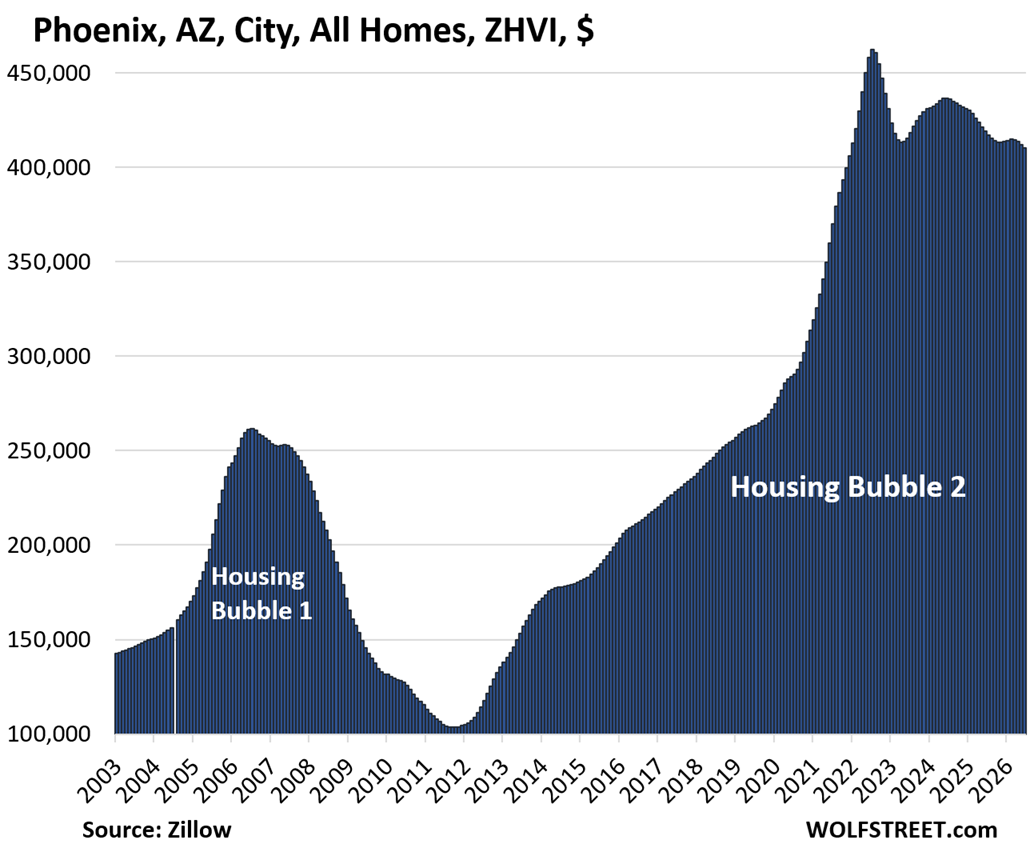
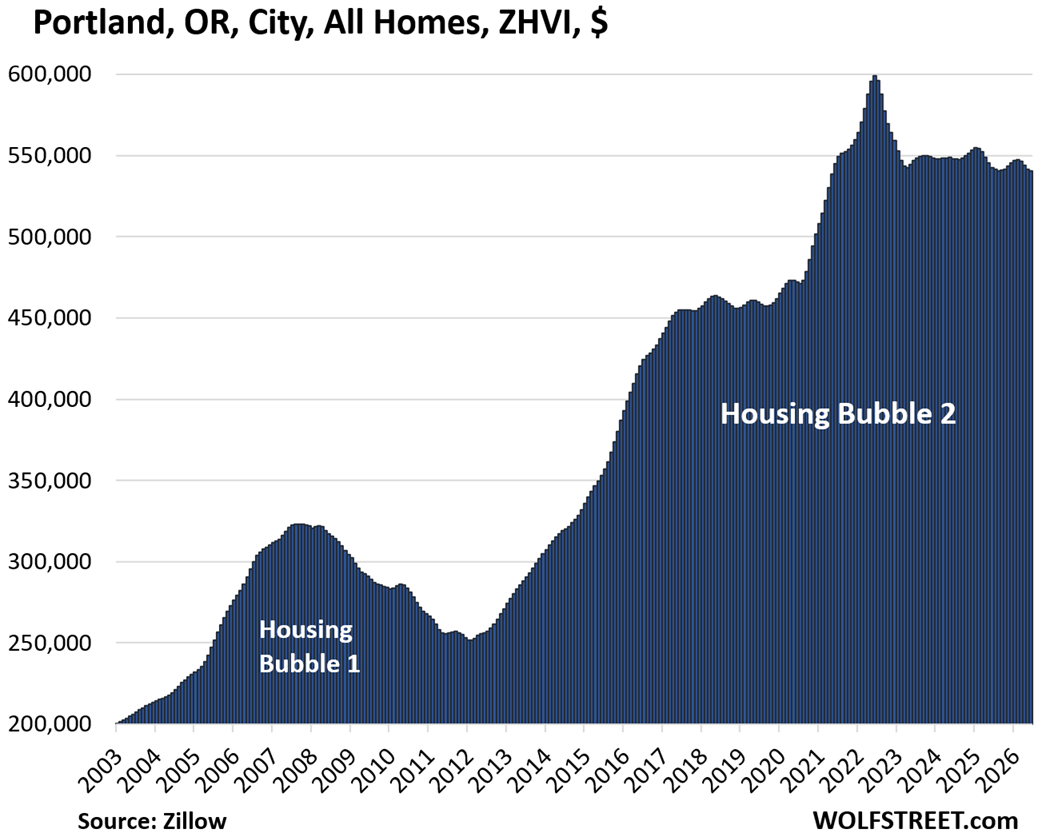
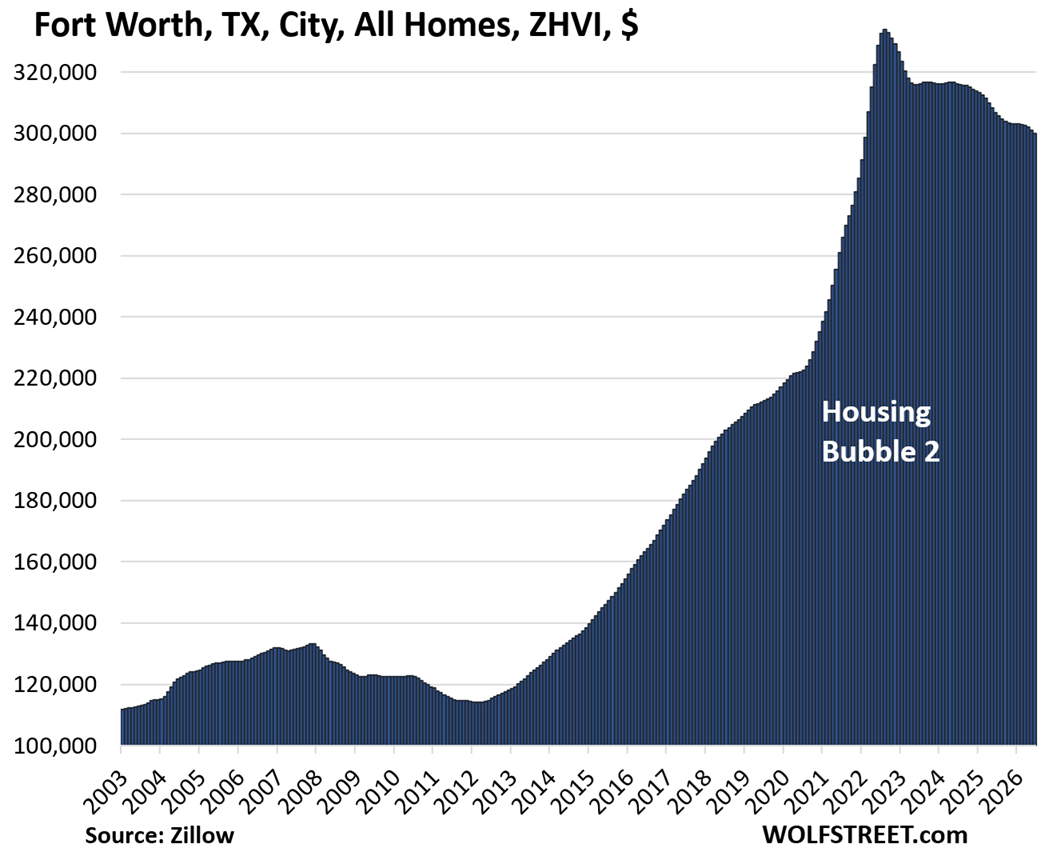
The correction has not been uniform across the country, but the magnitude of the drops in certain hubs is striking. Following Austin and Oakland in the list of steepest declines are New Orleans, which has fallen 19% from its prior peak, and a tie between Washington D.C. and Denver, both of which are down 13%. Other major metropolitan areas seeing double-digit retreats include Phoenix (-11%), Fort Worth (-10%), and Portland (-10%).
In Austin, the market’s decline to its lowest level since March 2021 represents a significant "reset" for a city that was the epicenter of the remote-work relocation boom. At the height of the frenzy between mid-2020 and mid-2022, Austin home prices spiked by an unprecedented 62%. The subsequent 27% drop illustrates the volatility inherent in markets where price growth far outpaces local income growth. Similarly, Oakland’s 25% decline has effectively erased years of gains, returning mid-tier home values to levels not seen since October 2017.
Chronology of the Peak and Pivot
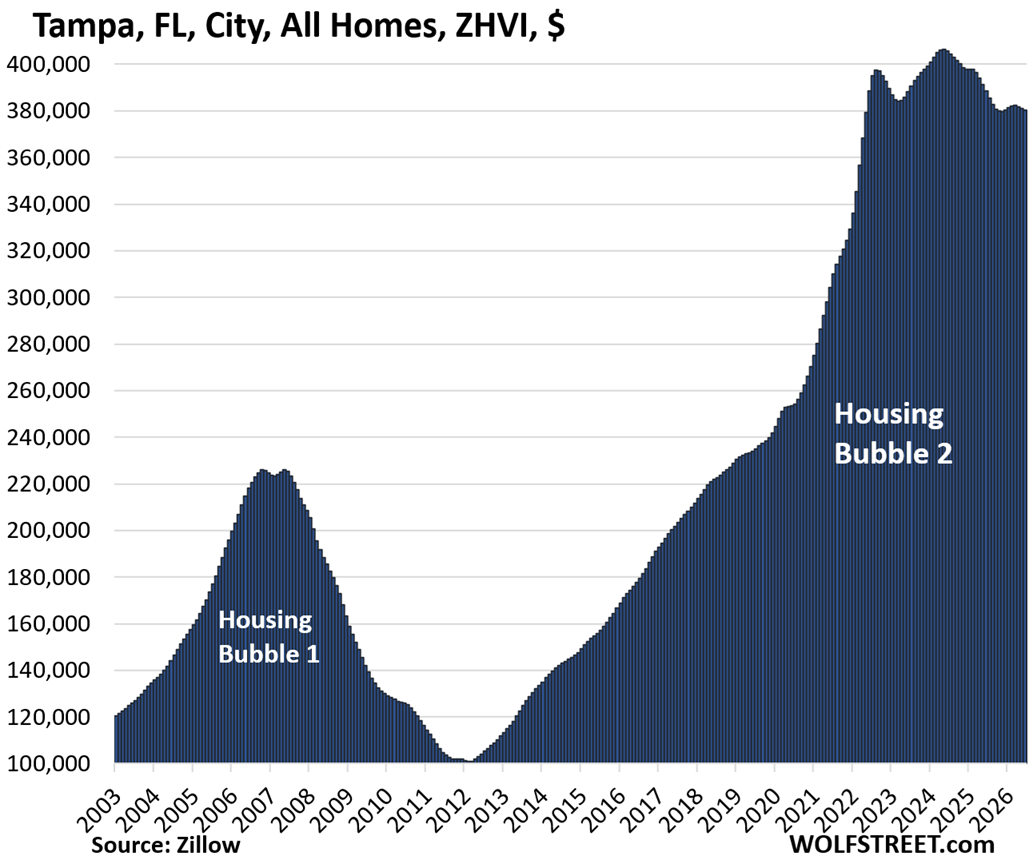
The timing of these market peaks provides a roadmap of the shifting economic tides over the last several years. For the majority of the 33 cities monitored—17 in total—the all-time price peaks were reached in mid-2022, just as the Federal Reserve began its aggressive campaign of interest rate hikes to combat surging inflation. Another nine cities reached their peaks in 2024, while a select few, such as Boston and San Jose, reached their highest points as recently as early 2025 before the current contraction took hold.
By June 2026, year-over-year price declines were evident in 25 of the 33 cities. Austin again led this metric with a 5.0% annual drop, followed by Oakland (-4.6%), Denver (-3.4%), Nashville (-3.3%), and Las Vegas (-3.1%). This downward momentum suggests that the "higher-for-longer" interest rate environment has successfully dampened the "Fear Of Missing Out" (FOMO) buying behavior that previously fueled the market.
The "AI Mania" Exception in San Francisco
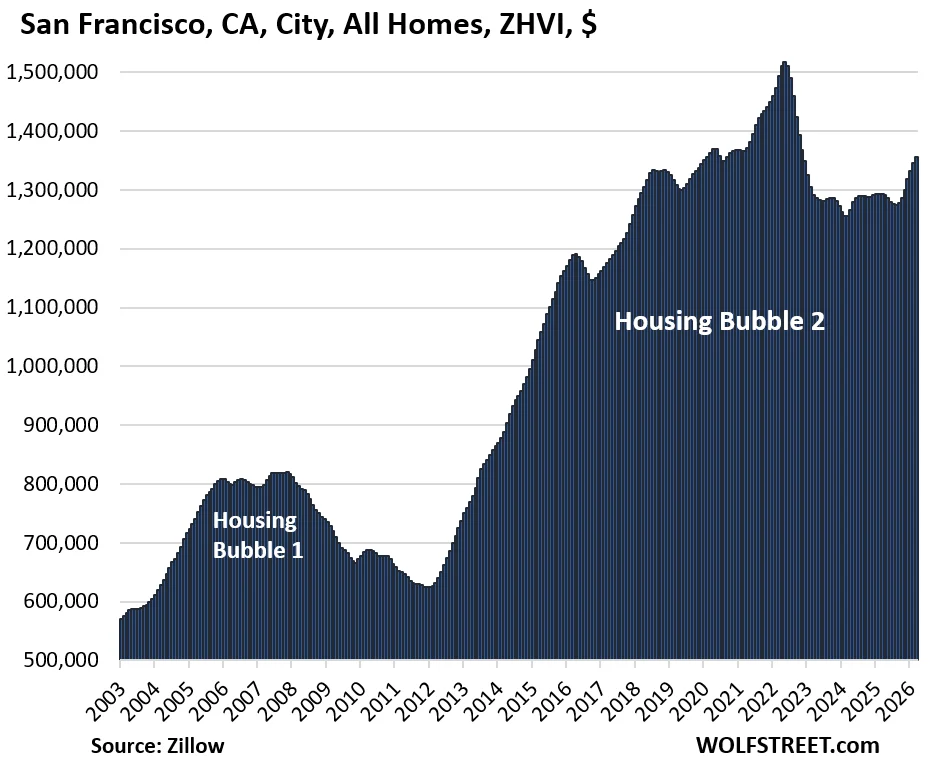
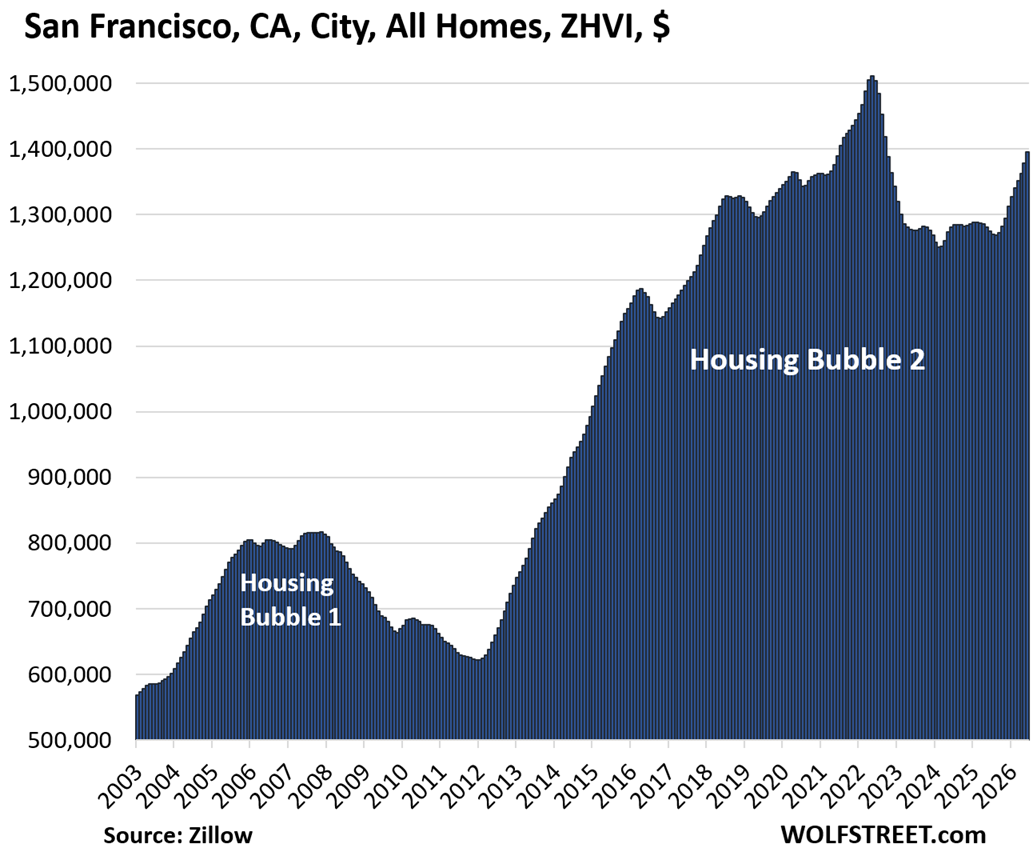
One of the most notable anomalies in the current data is the performance of the San Francisco market. Previously one of the leaders in price declines, San Francisco has seen a resurgence in mid-tier home prices, which rose 9.5% year-over-year in June. Analysts attribute this localized spike to the "AI mania" currently gripping the Bay Area. The surge in wealth generated by the artificial intelligence sector has led to a "mansion shortage" in the luxury tier, as high-earning tech professionals compete for limited high-end inventory.
This demand at the top of the market has begun to "trickle down" into the mid-tier segment, causing a spike in prices for standard single-family homes and condos. However, despite this recent momentum, San Francisco mid-tier prices remain 8% below their all-time high set in 2022. The sustainability of this recovery remains tethered to the continued expansion of the tech sector; should the AI investment cycle cool, the housing market in the city could quickly rejoin the national downward trend.
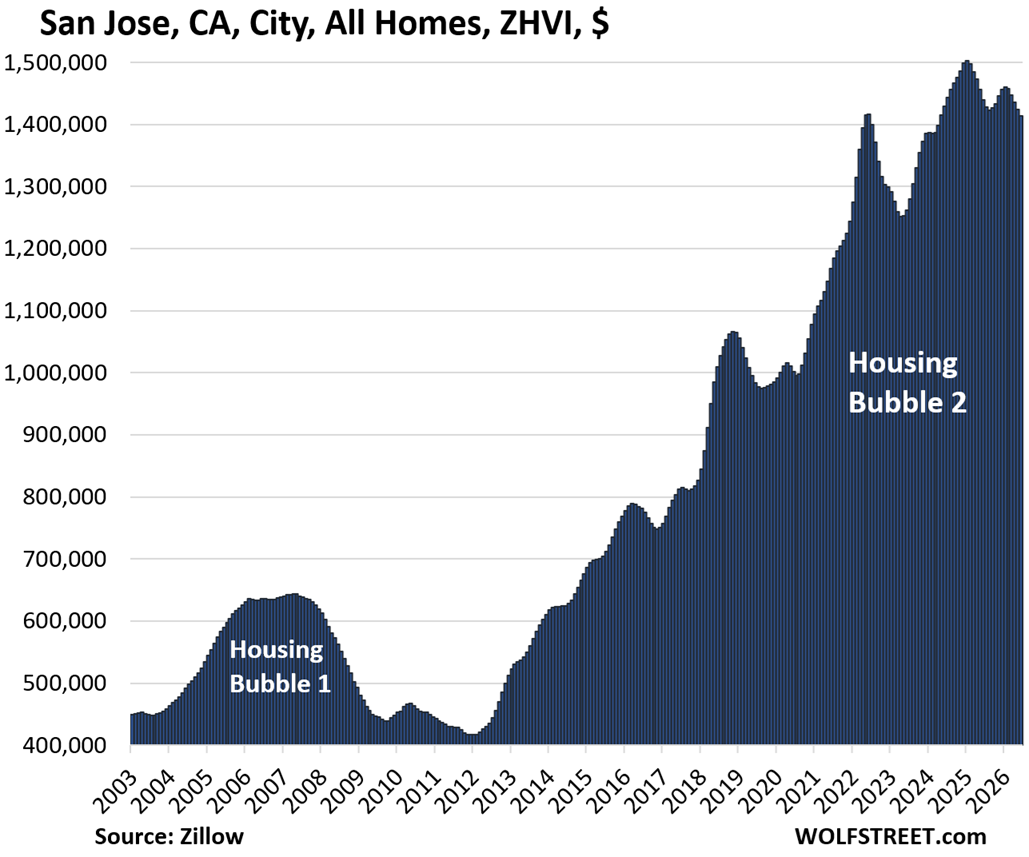
In contrast, neighboring San Jose—despite being the most expensive market on the list with a mid-tier value of approximately $1.41 million—continues to see prices soften. Values in San Jose fell 0.7% in June from May and are down 6% from their peak reached in January 2025.
The Role of Federal Reserve Policy and Monetary Inflation
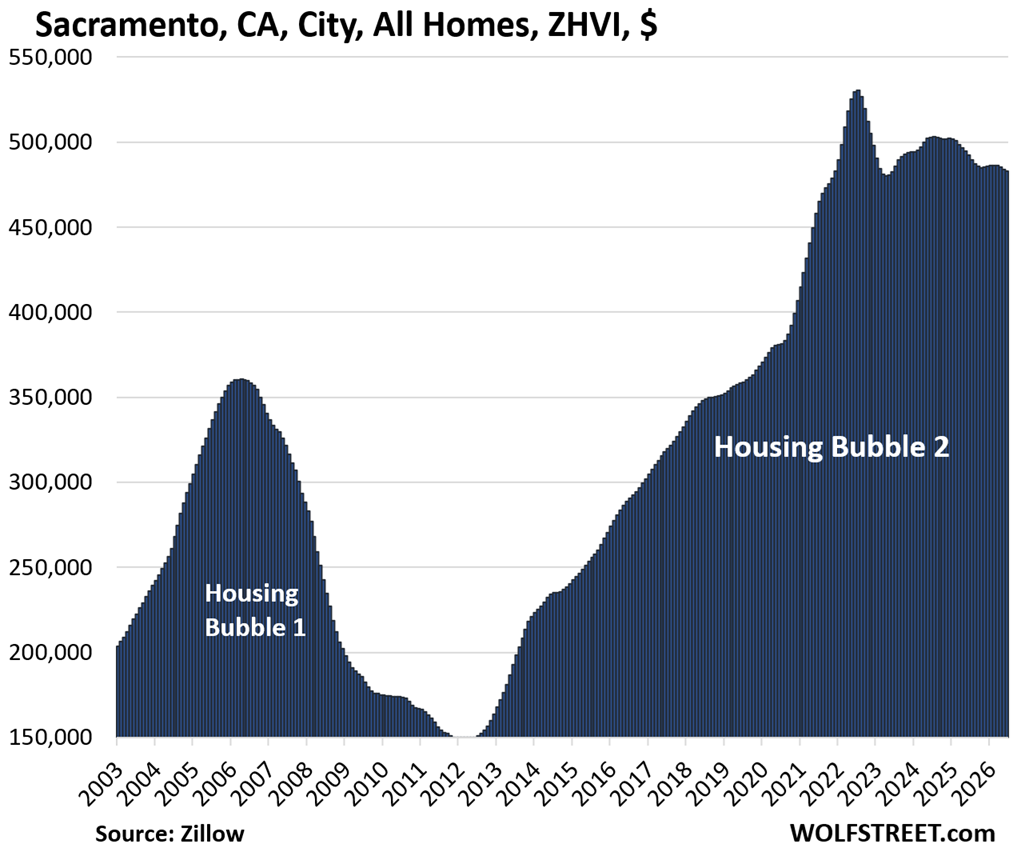
To understand the current correction, economists point to the unprecedented home-price inflation that occurred between 2020 and 2022. During this two-year window, cities like Phoenix saw 60% gains, while Raleigh and Sacramento saw increases of 49% and 39%, respectively.
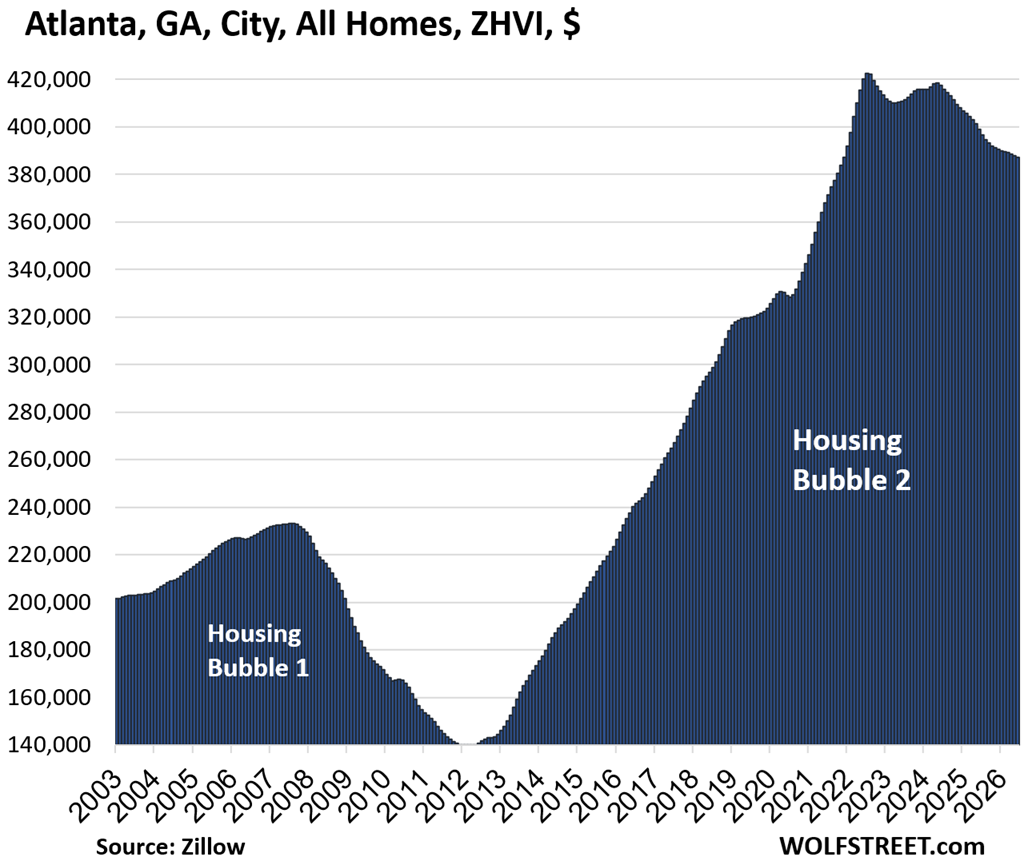
This massive inflationary event was largely driven by the Federal Reserve’s "reckless free-money policies," as described by market analysts. Through the purchase of trillions of dollars in Treasury securities and mortgage-backed securities (MBS), the Fed artificially suppressed mortgage rates to below 3%. This occurred even as consumer price inflation was climbing toward 9%, creating a massive disconnect between the cost of borrowing and the value of assets. The resulting "lock-in effect"—where homeowners refused to sell because they did not want to lose their low-rate mortgages—initially constrained supply, but eventually, the sheer weight of high prices and higher borrowing costs broke the market’s upward trajectory.
Inventory Surges and the Sales "Deep Freeze"
A critical factor contributing to the current price softening is the sudden shift in inventory levels. After years of scarcity, the supply of existing single-family homes has jumped to a 10-year high. Even more pronounced is the situation in the condominium and co-op market, where supply has reached a 14-year high.
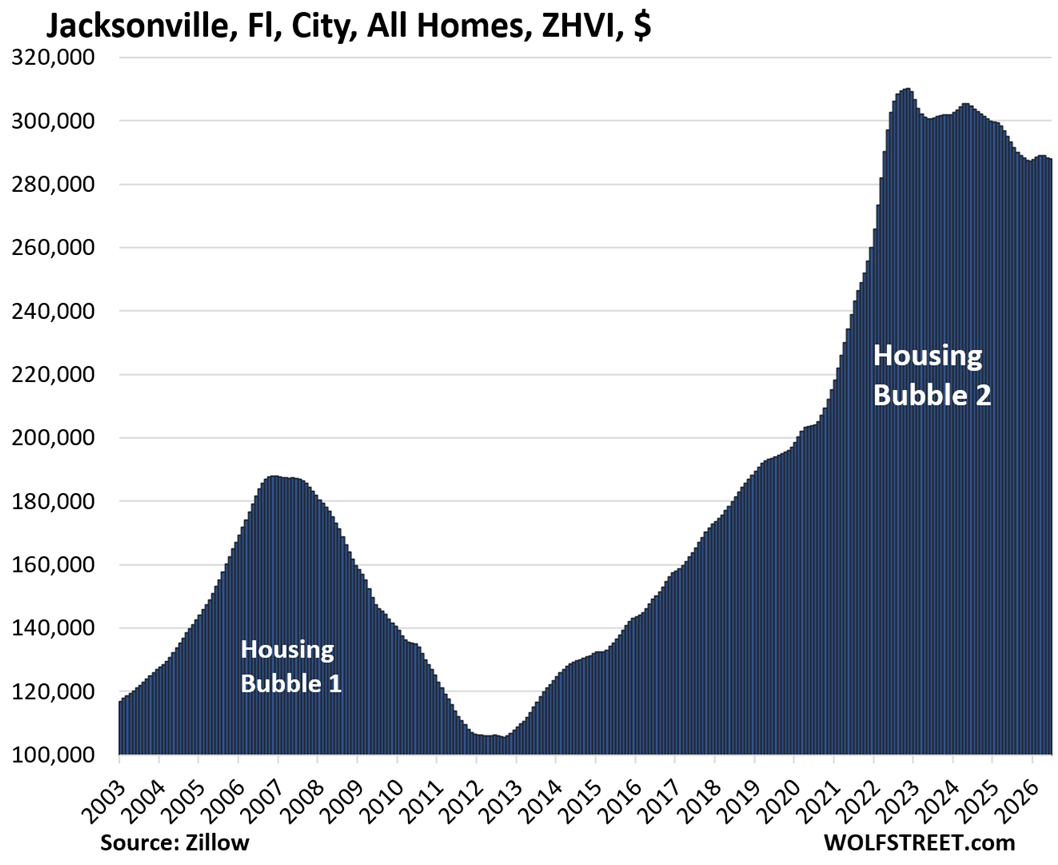
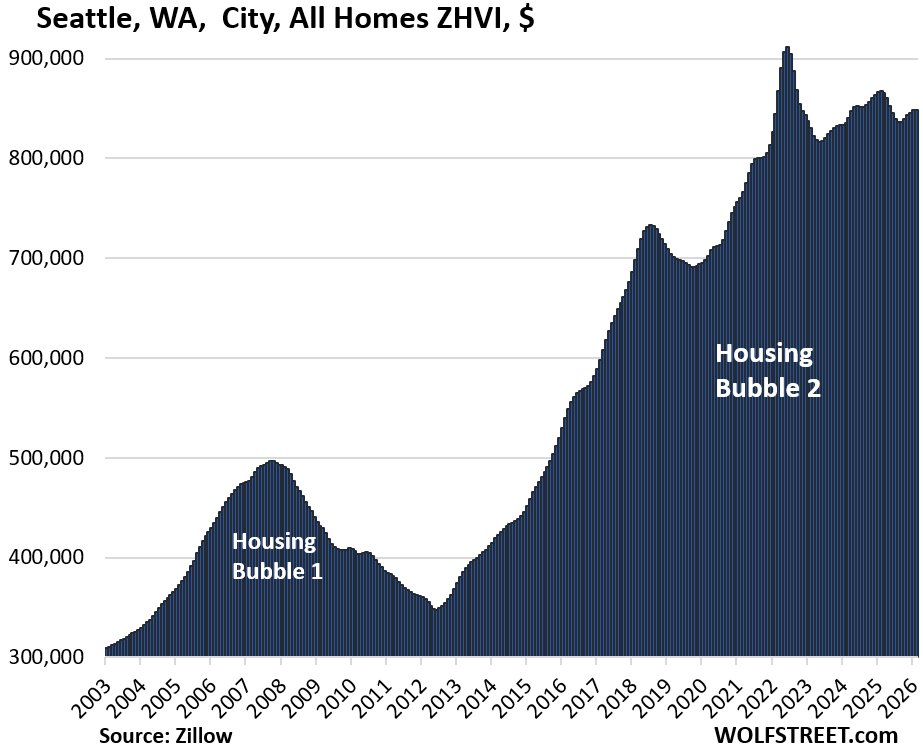
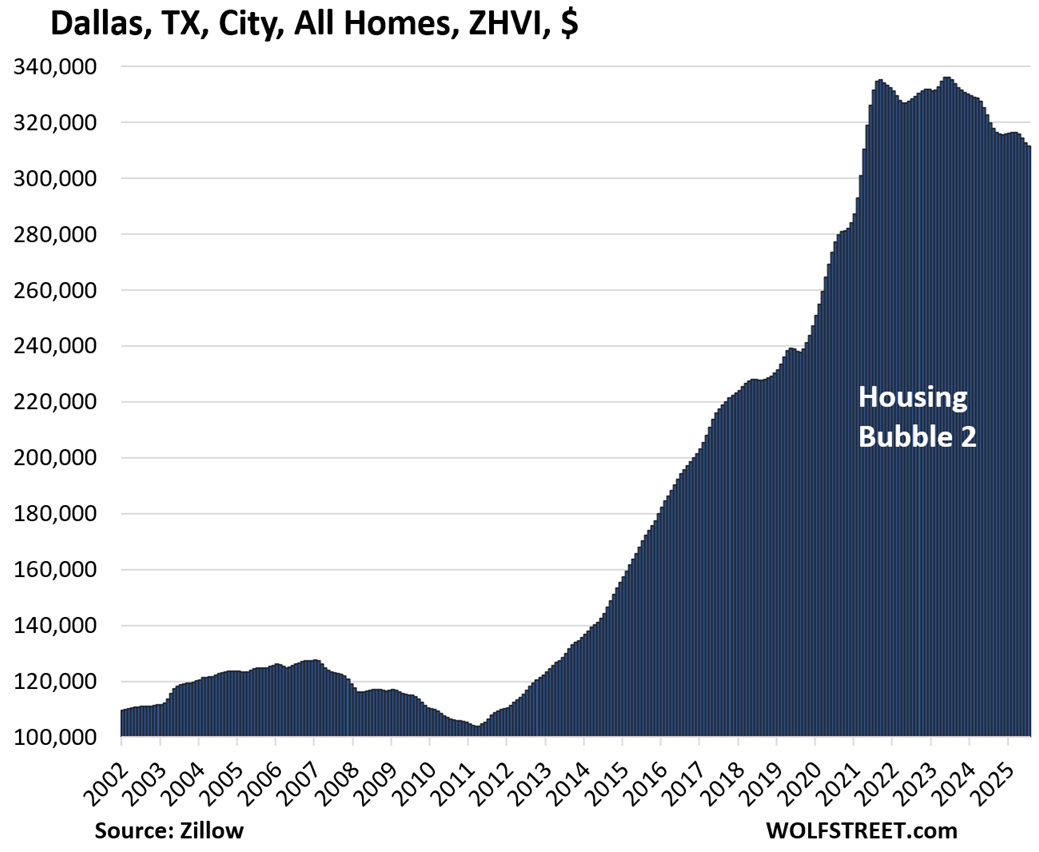
This increase in inventory is not necessarily due to a surge in new listings, but rather a significant slowdown in sales activity—a phenomenon being called the "Deep Freeze." With mortgage rates remaining elevated compared to the previous decade, the pool of qualified buyers has shrunk. Homes are sitting on the market longer, providing buyers with more leverage and forcing sellers to adjust their price expectations. In cities like Miami and Seattle, month-over-month price declines and flat growth indicate that the supply-demand balance has tipped firmly in favor of the buyer for the first time in years.
Regional Outliers: The Midwest and Northeast
While the Sunbelt and West Coast grapple with significant corrections, a few cities in the Midwest and Northeast have shown remarkable resilience. Chicago and New York City were the only two major "expensive" cities to flirt with new highs in June. Chicago saw a 0.4% monthly increase and a 3.9% year-over-year gain. New York City, which had been setting records for several months, saw a minor dip of 0.1% in June but remains 3.8% higher than the previous year.
Other cities like Philadelphia, Omaha, and Minneapolis had been on a similar upward trajectory but appear to have hit a ceiling in March 2025. Over the past three months, these markets have begun to see their first month-to-month price declines, suggesting that the correction is finally reaching the more stable regions of the country.
Methodology and Market Categorization
The data used in this analysis is based on the seasonally adjusted three-month-average Zillow Home Value Index (ZHVI). This index tracks the "mid-tier" of the market, specifically the middle third of home values in each metropolitan area. It includes single-family homes, condominiums, and co-ops, utilizing millions of data points from public records, tax data, and Multiple Listing Services (MLS).
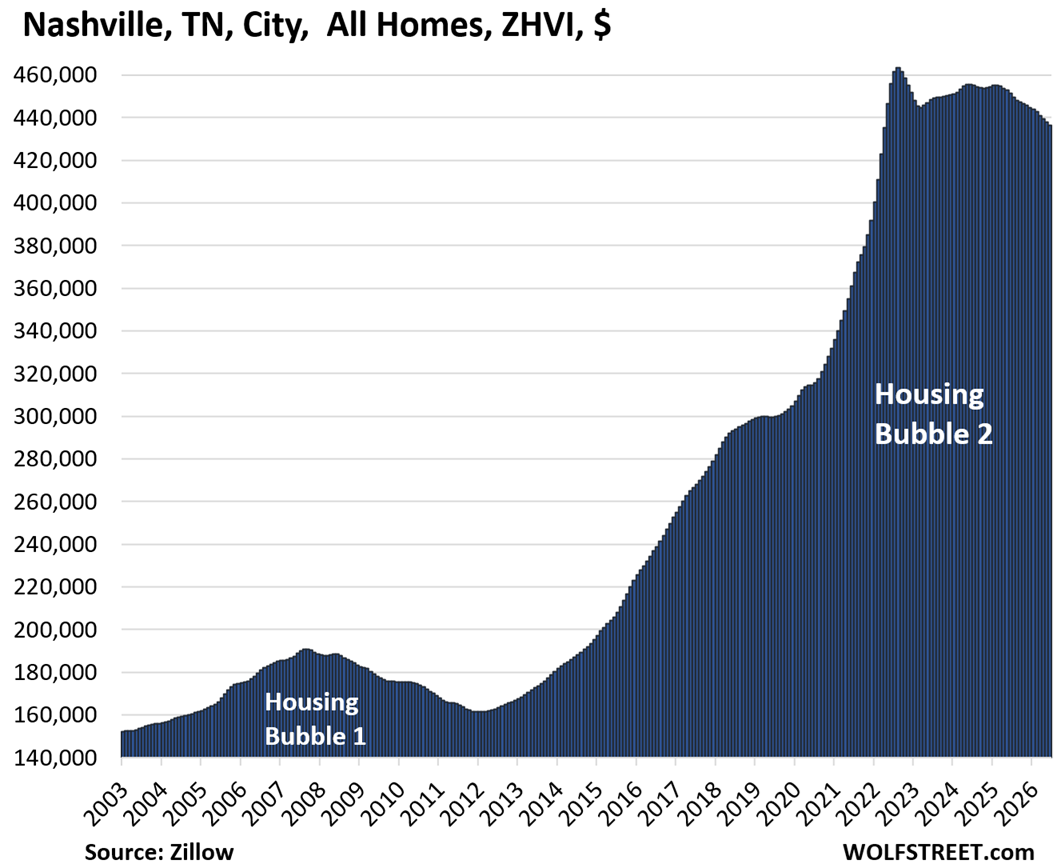
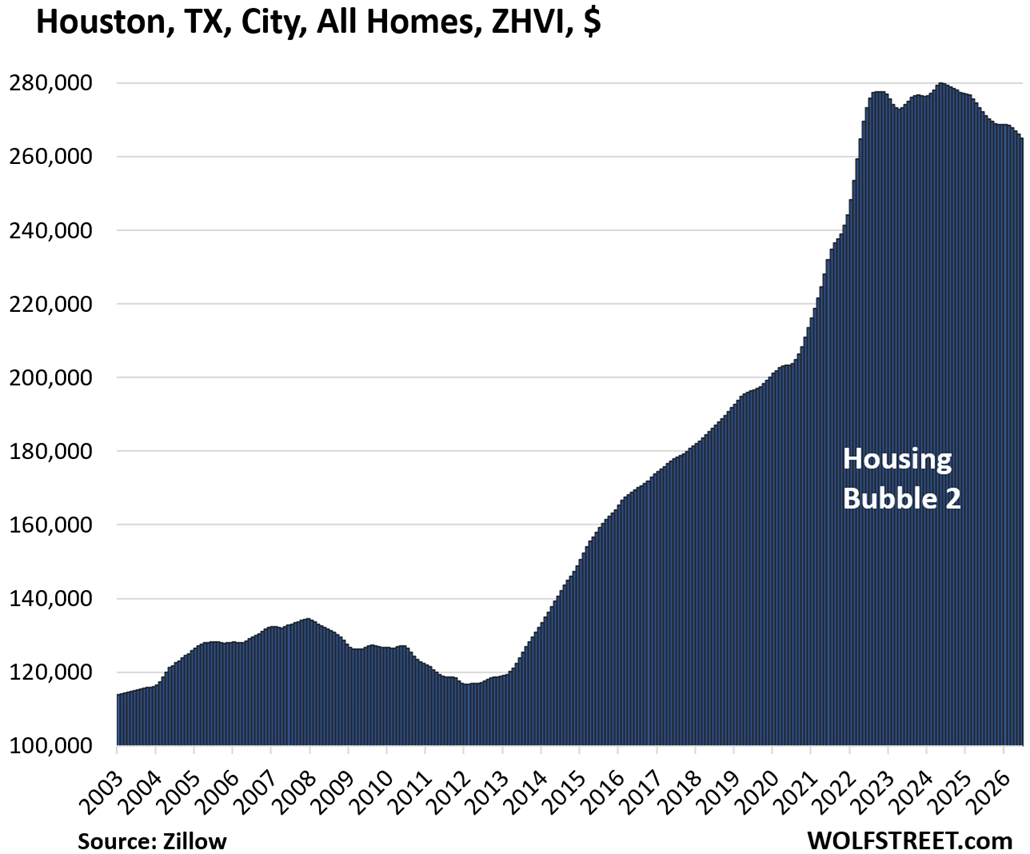
To be included in this specific "big and expensive" list, a city must be among the largest by population and have a mid-tier ZHVI that reached at least $300,000. Interestingly, several major U.S. cities do not meet the "expensive" criteria despite the recent inflationary surge. In cities like Houston, Memphis, Oklahoma City, and Pittsburgh, home prices remain significantly more affordable—often allowing a buyer to purchase five homes for the price of one mid-tier property in San Jose. Houston and Philadelphia are included in the 33-city tracking primarily due to their status as the fourth and sixth-largest cities in the United States, providing a necessary baseline for national health.
Broader Economic Implications and Outlook
The ongoing correction in home prices is a double-edged sword for the U.S. economy. For prospective first-time buyers, the decline in prices—particularly the 27% drop in Austin or the 13% drop in Denver—offers a glimmer of hope for improved affordability. However, this is largely offset by the fact that mortgage rates remain significantly higher than they were during the 2020-2022 boom.
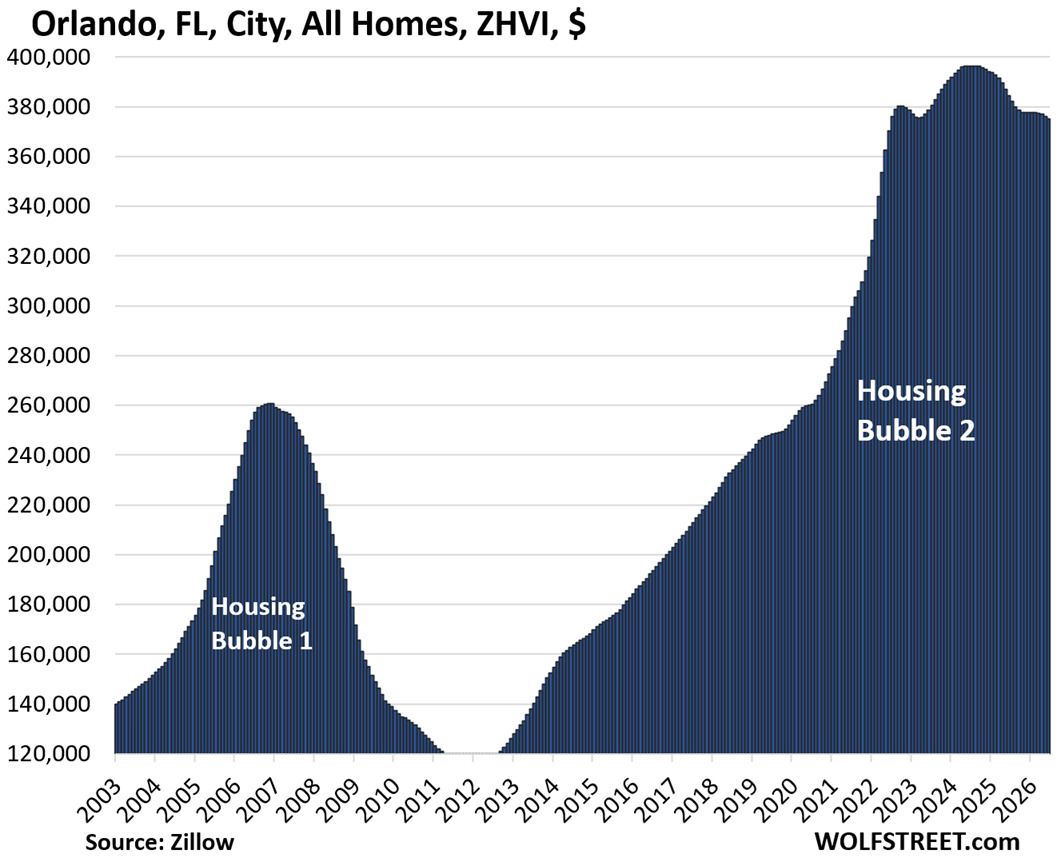
For current homeowners, the "wealth effect" of soaring equity is beginning to diminish. While most homeowners who purchased prior to 2020 still hold significant equity gains (as evidenced by the "Since 2000" growth figures, such as 346% in San Diego and 236% in San Francisco), those who bought at the 2022 or 2024 peaks may find themselves in a "negative equity" position if the correction continues.
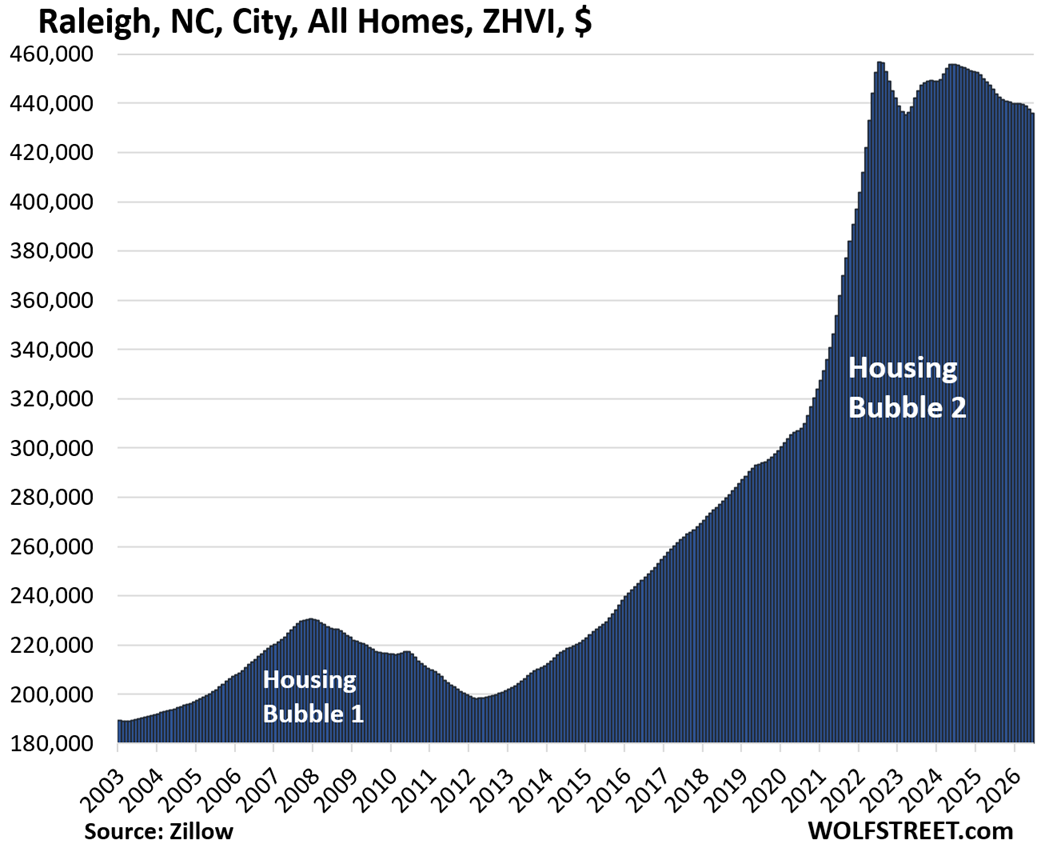
As the market enters the second half of 2026, the focus will remain on the Federal Reserve’s interest rate path and the labor market’s stability. If unemployment remains low, the housing market may continue a "slow bleed" or "sideways grind" as inventory slowly clears. However, if the "Deep Freeze" in sales continues to push inventory to new decade-long highs, the price declines seen in Austin and Oakland may become the blueprint for the rest of the country’s major metropolitan centers.