Can You Backtest ICT and Smart Money Concepts? Quantitative Research and Signal Testing

The algorithmic and retail trading communities have long debated the mathematical validity of popular technical trading strategies, most notably Inner Circle Trader (ICT) methods and Smart Money Concepts (SMC). For years, proponents and critics alike have argued over whether these chart-reading methodologies represent actual structural footprints of institutional trading activity or merely discretionary interpretations prone to cognitive bias. Recent quantitative developments, however, have shifted the conversation from philosophical debate to empirical validation. By utilizing specialized memory functions such as event-anchored price tracking, systematic researchers are now demonstrating that core SMC patterns—including Fair Value Gaps (FVGs), liquidity sweeps, and market structure breaks—can be rigorously defined, modeled, and tested against historical data.
Background Context and the Rise of Smart Money Methodologies
The terminology underpinning SMC and ICT originated largely from the pedagogical material of Michael Huddleston, known widely as Inner Circle Trader, whose online educational ecosystem has amassed over 1.8 million subscribers. Over the past half-decade, these concepts have deeply permeated retail futures, foreign exchange, and proprietary trading firm communities. Terms such as "order blocks," "fair value gaps," and "liquidity sweeps" have effectively replaced traditional technical analysis vocabulary for a vast generation of market participants.
Despite this widespread adoption, quantitative researchers and institutional developers have historically dismissed these theories due to their discretionary nature. Traditional backtesting platforms, which rely on rolling-window indicators like moving averages or standard deviation bands, struggled to capture the historical memory required by SMC logic. An order block or a fair value gap relies on an event that occurred an indeterminate number of bars in the past, a structural requirement that standard technical libraries could not easily evaluate. Consequently, the trading community remained split between devout practitioners who swore by the efficacy of institutional order flow models and quantitative analysts who viewed them as unfalsifiable narratives.
Quantifying the Unquantifiable: Geometric Relationships and Memory Functions
To bridge the gap between discretionary chart reading and systematic backtesting, software architects have introduced specialized programming primitives designed to handle price-level memory. In platforms such as Build Alpha, functions like EventPrice allow developers to overcome the limitations of rolling windows by operating on conditional states.
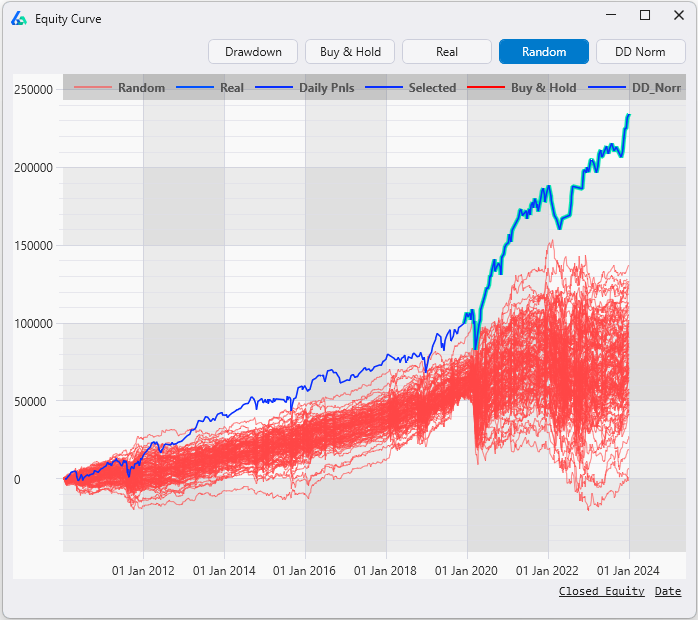
An EventPrice function evaluates a specific logical condition and a target value. When the condition is met, it records and stores the value; when false, it preserves the last recorded price level. This operational mechanics mirrors a sticky note on a terminal screen, maintaining a reference price until a new structural event overwrites it. With this functionality, complex SMC phenomena transform into testable geometric relationships.
For instance, a bullish Fair Value Gap is fundamentally a three-bar mathematical sequence where the low of the most recent bar exceeds the high of the candle printed two bars prior. This leaves an untraded price band that can be bounded, referenced, and monitored for subsequent tests or mitigations. Similarly, a liquidity sweep is defined as a sequence where price breaches a prior low before reclaiming it on the same bar, while a break of structure is quantified as a price close exceeding a confirmed swing high.
Eliminating Lookahead Bias and Volatility Distortion
A critical hurdle in developing automated SMC algorithms has been the presence of lookahead bias, particularly concerning swing points. In standard discretionary charting, a swing high is frequently identified by a pivot bar flanked by a specific number of bars on either side. However, these patterns cannot logically be confirmed in real-time until those subsequent bars have actually printed.
Historical backtests that utilize indicators failing to account for this lag inadvertently incorporate future information, generating artificially inflated equity curves that collapse in live execution. Rigorous quantitative implementations address this limitation by explicitly delaying pivot confirmation by the required number of bars, ensuring that algorithms evaluate only data that was realistically available at the moment of trade execution.
Furthermore, quantitative frameworks address the volatility problem by normalizing size thresholds. Hard-coding point or tick values—such as a ten-tick gap—fails to account for shifting macroeconomic environments, rendering a strategy sensitive to multi-year volatility regimes rather than the underlying pattern. By expressing size thresholds as multiples of the Average True Range (ATR), researchers ensure that pattern definitions remain stable across decades of data and diverse asset classes, from equity index futures to foreign exchange pairs.
Robustness Testing and the Need for Empirical Validation
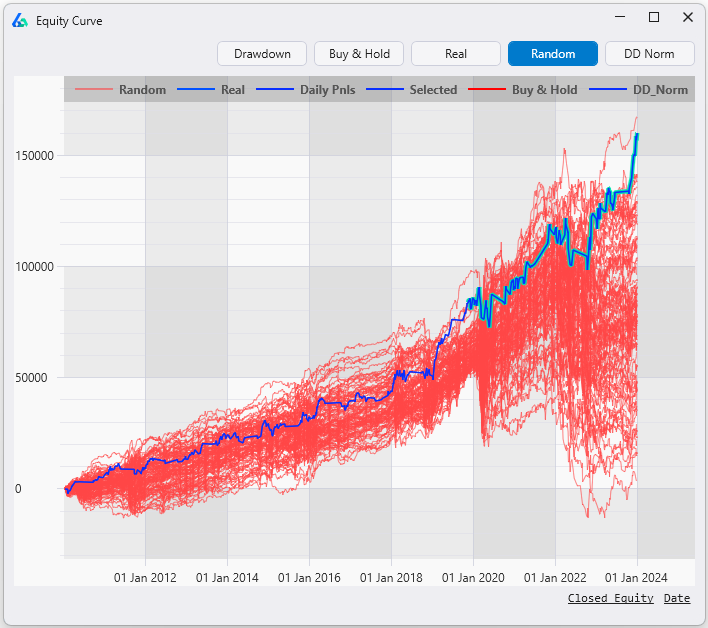
Even with precise rule definitions and unbiased code structures, quantitative strategists emphasize that a single profitable backtest carries minimal statistical weight. Because technical patterns often incorporate numerous tunable parameters—such as gap size minimums, time filters, and confirmation lookbacks—the risk of data snooping and curve-fitting remains exceptionally high.
To separate genuine market edges from statistical artifacts, professional trading operations subject SMC strategies to rigorous out-of-sample and permutation testing suites. Key methodologies include:
- Vs Random Benchmarking: Comparing strategy performance against randomized trade entries with identical holding periods and trade counts to ensure the pattern outperforms pure chance.
- Noise Testing: Introducing minor perturbations into historical price data to verify whether the strategy’s profitability survives slight market variations.
- Monte Carlo Permutation Tests: Estimating the probability of achieving comparable returns under the null hypothesis of zero edge, effectively generating a p-value for the trading rule.
- Walk-Forward Analysis: Optimizing parameters on historical data and validating performance on unseen, out-of-sample datasets.
Implications for the Broader Trading Ecosystem
The ability to programmatically test Smart Money Concepts marks a significant maturation point in retail and systematic trading education. By translating subjective chart narratives into explicit, rule-based algorithms, traders can bypass endless theoretical debates and evaluate strategies based on empirical performance metrics.
While initial backtests of standard SMC patterns frequently reveal that many discretionary setups fail comprehensive robustness suites, the underlying methodology demonstrates that any clearly described market hypothesis can be investigated. As artificial intelligence integration and advanced signal testing environments lower the technical barriers to quantitative research, market participants are increasingly empowered to transition from subjective speculation to data-driven validation. Ultimately, the question of whether ICT and SMC methodologies function successfully is no longer a matter of opinion, but an empirical variable specific to market, timeframe, and execution discipline.