New Single-Family Home Prices Drop Further amid Declining Sales and once again Growing Inventory Glut

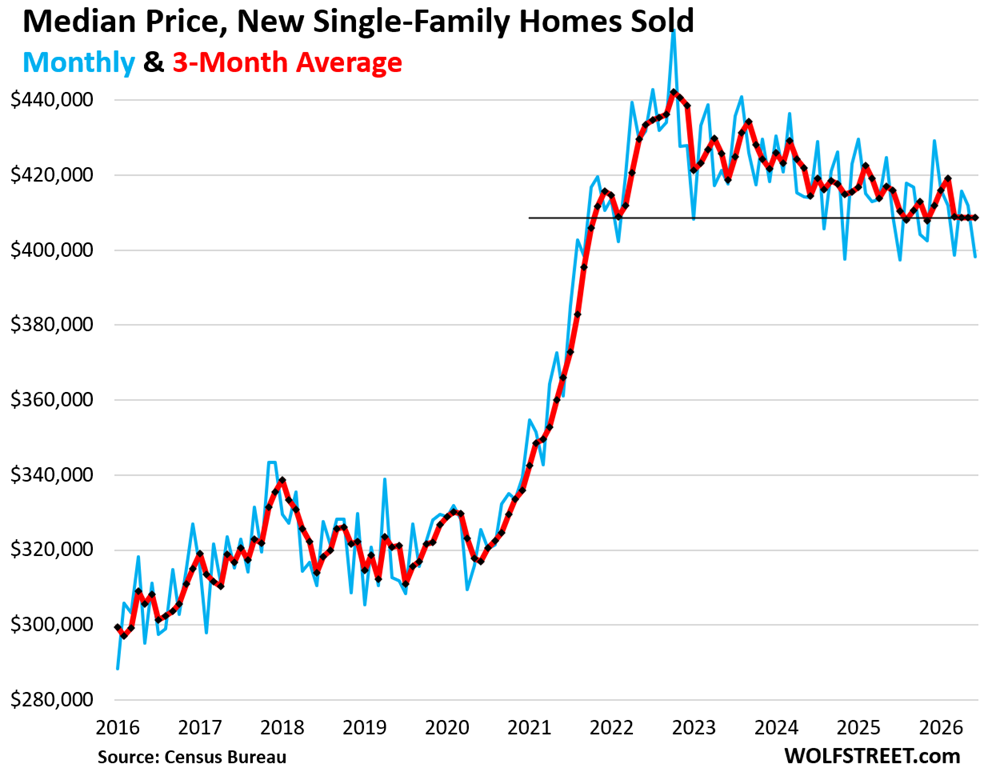
The softening of the market is even more evident when examining long-term trends. The current median price sits 3.8% lower than levels seen two years ago. To mitigate the volatility of month-to-month data, economists often point to the three-month average median price, which currently stands at $408,800. This figure represents a 1.7% year-over-year decrease and a 6.7% decline from two years ago, effectively returning prices to levels first observed in late 2021. However, these figures only tell a portion of the story, as they reflect contract prices rather than the final "all-in" cost to the builder.
The Hidden Impact of Incentives and Mortgage Buydowns
A critical nuance in the current housing market is the discrepancy between the Census Bureau’s reported median prices and the actual financial reality for homebuilders. While the reported median price reflects the sticker price on sales contracts, it does not account for the extensive incentives and mortgage-rate buydowns that have become standard industry practice. In an environment where traditional mortgage rates remain elevated, builders are increasingly absorbing the cost of "buying down" interest rates for their customers—often bringing a 7% market rate down to 5.5% or lower for the buyer.
These buydowns, along with other concessions such as covering closing costs or providing free upgrades, represent a substantial financial hit to the builders. While these costs are reflected as lower average selling prices in a builder’s internal financial statements and quarterly earnings reports, they remain invisible in the aggregate federal data. Consequently, the actual "price discovery" in the new home market suggests a deeper decline in value than the 13.5% peak-to-trough drop currently reported by the government.
Homebuilder Stocks and the Pursuit of Market Share
The financial pressure on the construction sector is becoming increasingly visible in the equity markets. Since mid-September 2024, the stock prices of the nation’s largest homebuilders have faced significant headwinds. D.R. Horton, the largest builder by volume, has seen its stock price decline by approximately 23%. Lennar, another industry giant, has seen an even more dramatic correction, with its share price plunging 51% from its recent highs.
Lennar’s stock performance is partly a reflection of its aggressive strategy to maintain volume at the expense of profit margins. By slashing prices and offering heavy incentives, Lennar has managed to capture a larger share of the dwindling buyer pool, but at a high cost to its gross margins and net profits. This "volume over margin" approach is a classic defensive maneuver in a slowing market.
Bucking the trend is the Pulte Group, whose stock has remained relatively resilient, dropping only 3% in the same period. Additionally, the industry saw a major consolidation event this year as Taylor Morrison was acquired by Berkshire Hathaway, indicating that while the market is tough, deep-pocketed institutional investors still see long-term value in the nation’s housing infrastructure.
Sales Trends and the Growing Inventory Pipeline
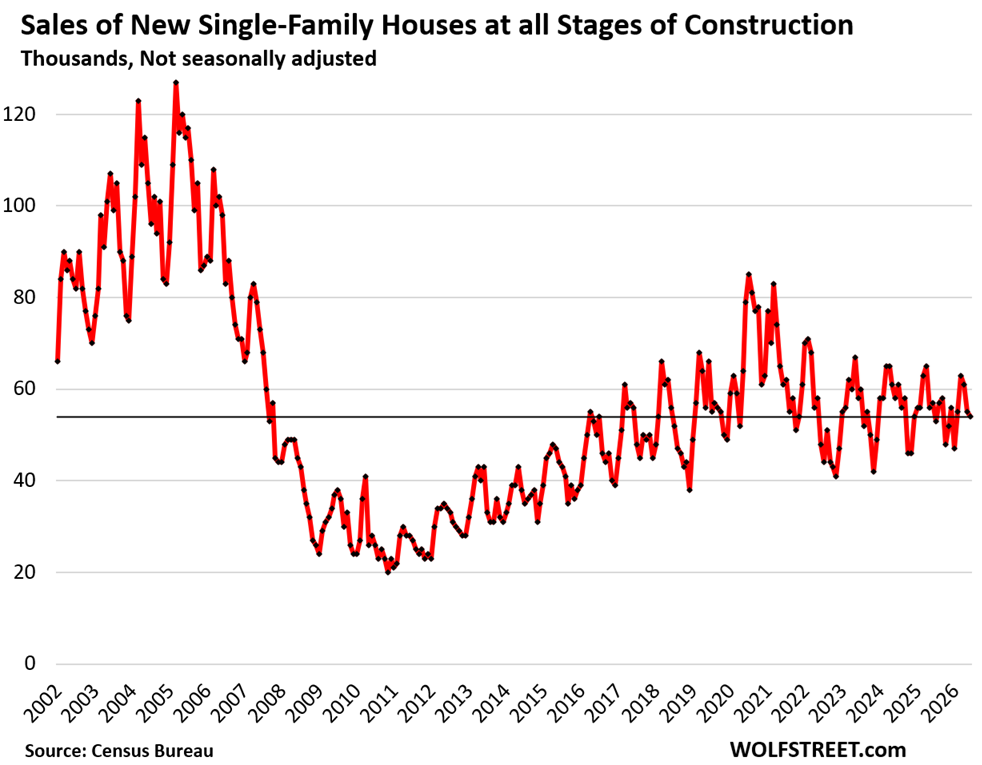
The demand for new single-family homes continues to struggle against the dual pressures of high interest rates and diminished affordability. National sales fell by 5.3% year-over-year in June, with only 54,000 homes sold. This marks the third consecutive month of year-over-year declines. When compared to the pre-pandemic benchmark of June 2019, sales are down a staggering 18%.
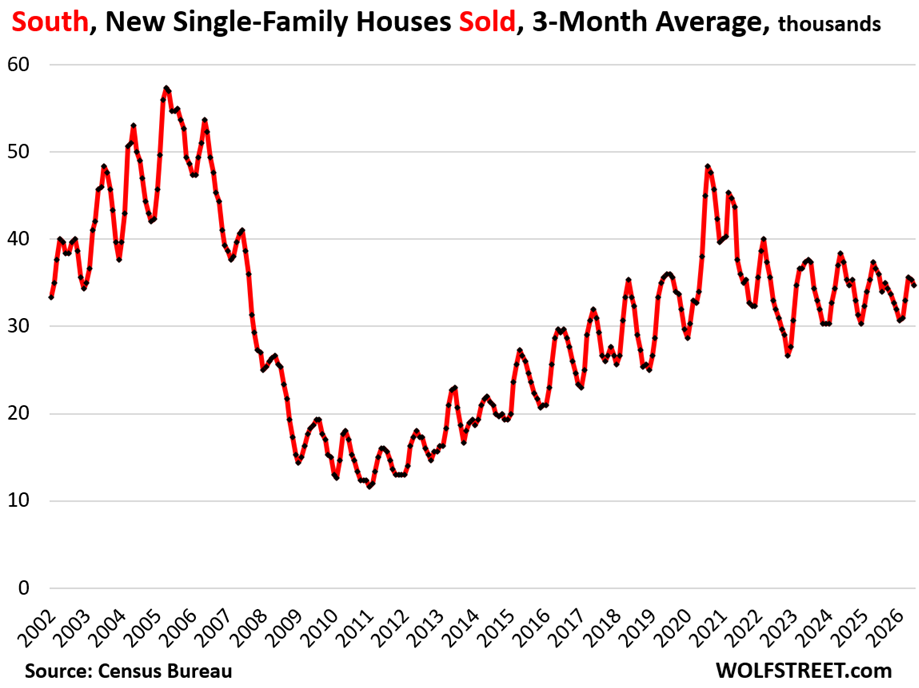
The geographical distribution of these sales remains heavily concentrated. The South continues to be the powerhouse of the industry, accounting for 67% of all new home sales, followed by the West at 21%. Together, these two regions represent nearly 90% of the entire U.S. new home market, leaving the Northeast and Midwest to share the remaining 12%.
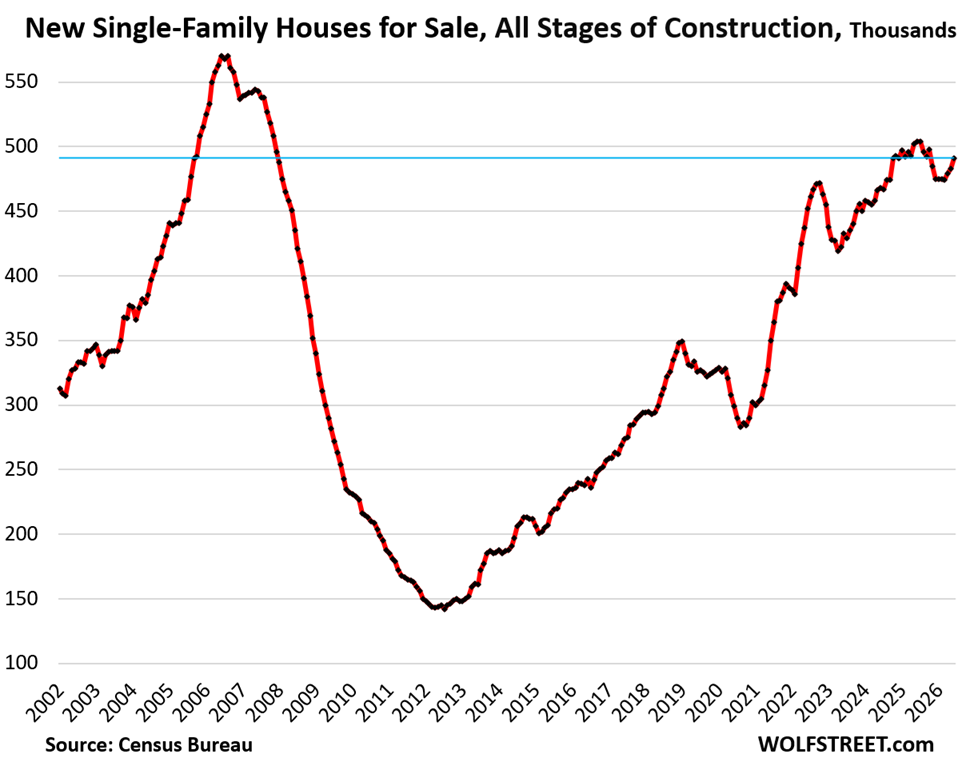
As sales have slowed, inventory has begun to accumulate rapidly. Total inventory for single-family homes at all stages of construction rose to 491,000 units in June. This represents 9.3 months of supply at the current sales pace—a level significantly higher than the 4-to-6-month supply typically considered a "balanced" market. This buildup in inventory is directly correlated with the recent surge in mortgage rates, which has sidelined potential buyers.
Regional Analysis: The Southern Glut and the Western Plunge
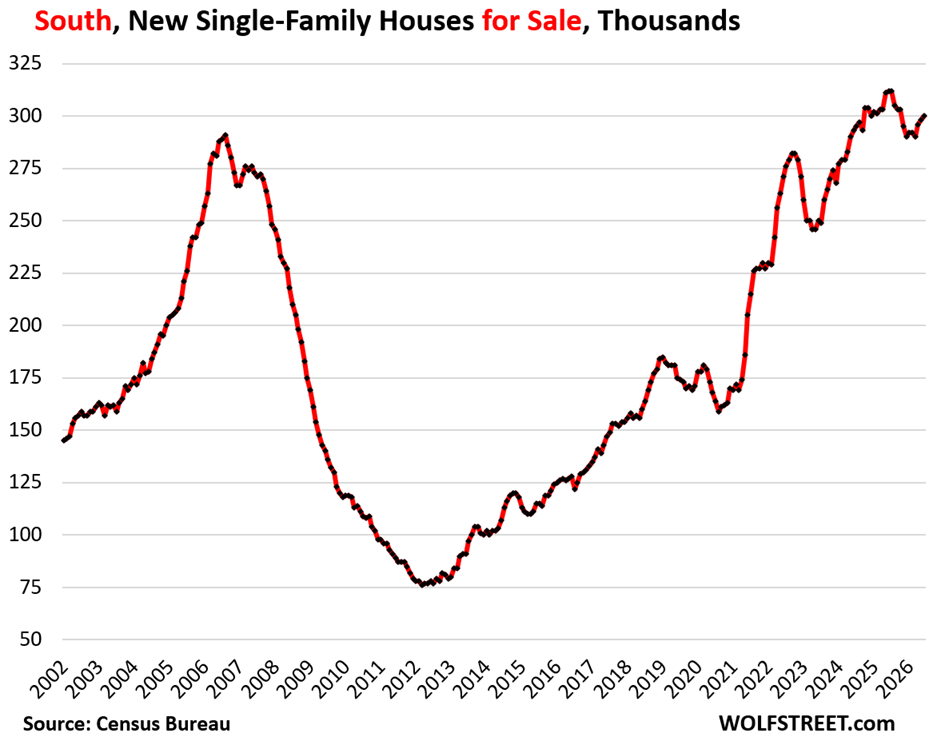
The most concerning data point for the industry is the massive inventory buildup in the South. While sales in the South were flat year-over-year at 36,000 units, the inventory of homes for sale at all stages of construction reached 300,000. This is 71% higher than the inventory levels seen in June 2019. With sales down 8% compared to that same 2019 period, the South is currently facing what economists describe as a classic "housing glut." Builders in states like Texas and Florida, who ramped up production during the pandemic migration boom, now find themselves with an oversupply of units that the current market cannot absorb at current price points.
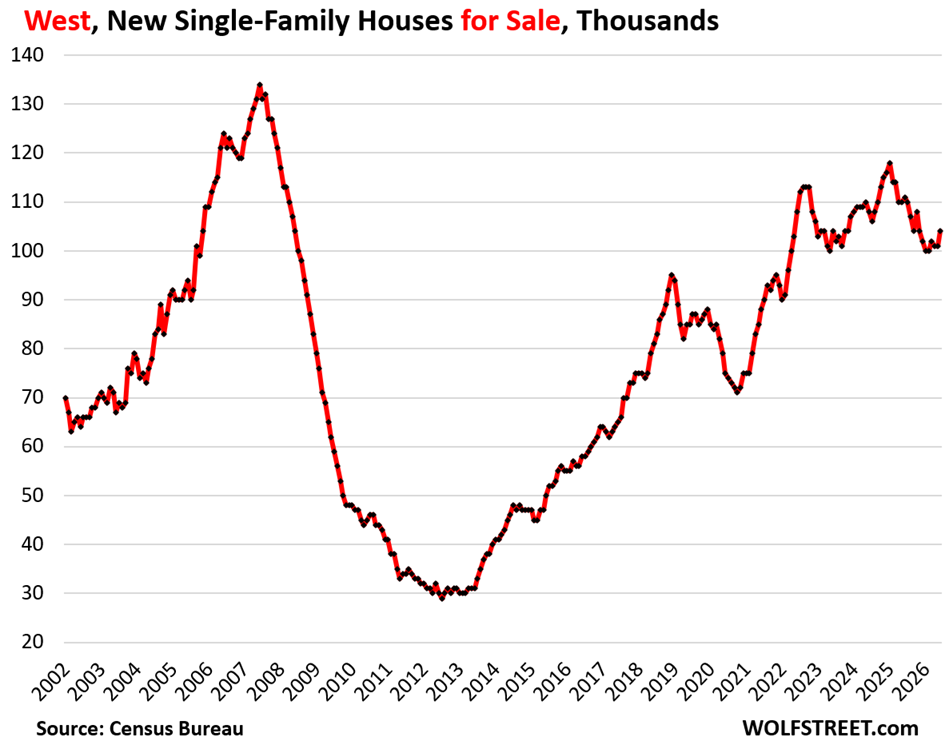
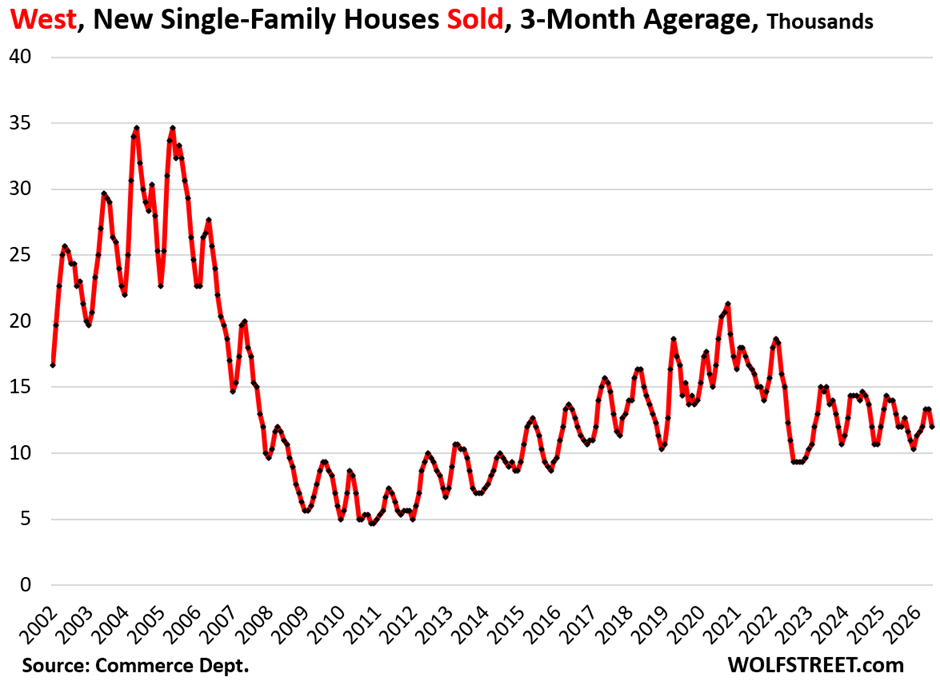
In the West, the situation is different but equally challenging. Inventory levels are up a modest 22% from 2019, but sales have absolutely cratered. Sales in the West plunged 25% year-over-year and are down 50% from 2019 levels. This suggests that in high-cost Western markets, the "affordability wall" has been hit harder than anywhere else in the country, leaving builders with 104,000 units and very few qualified buyers willing to pull the trigger.
The Midwest and Northeast tell a quieter story. The Midwest saw its inventory jump to a 16-year high of 55,000 units, an increase of 49% from 2019. Meanwhile, the Northeast remains a constrained market for single-family homes, as the region’s density favors multifamily developments. Inventory in the Northeast rose to 32,000 units, a 14% increase from 2019.
The Nature of the Inventory: Under Construction vs. Completed
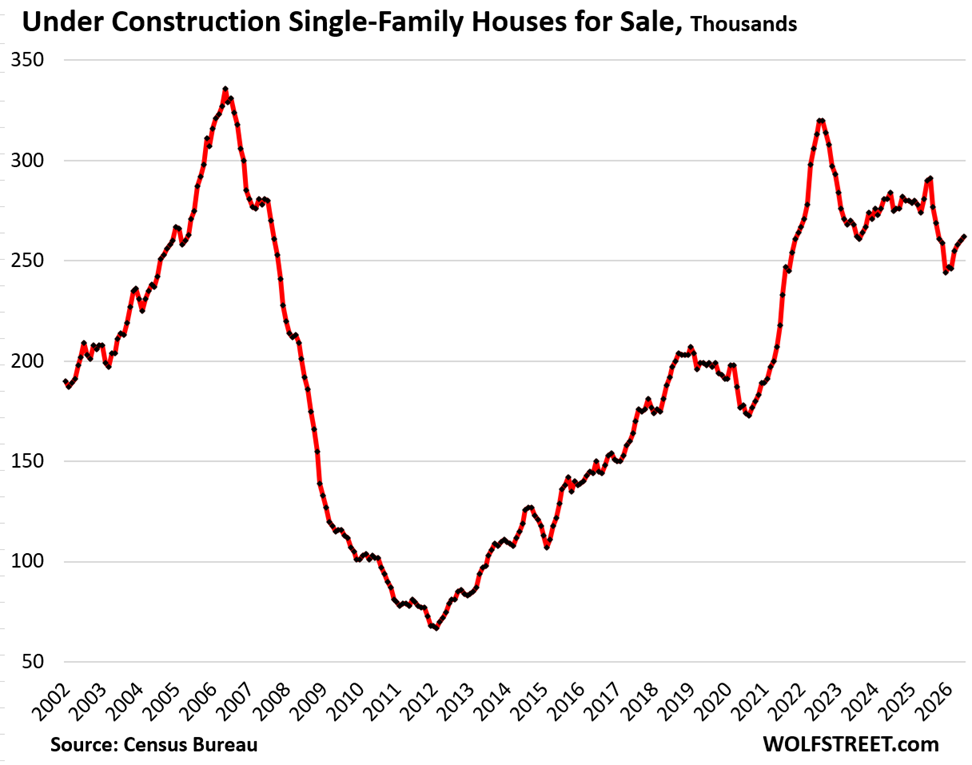
To understand the motivation of builders, one must look at the composition of the inventory. Of the 491,000 homes on the market, 262,000 are currently under construction. This represents the pipeline of future supply. While this figure is down 10% from a year ago, it has seen three consecutive months of increases. Builders are highly motivated to sell these units before they are completed to avoid the carrying costs of finished stock.
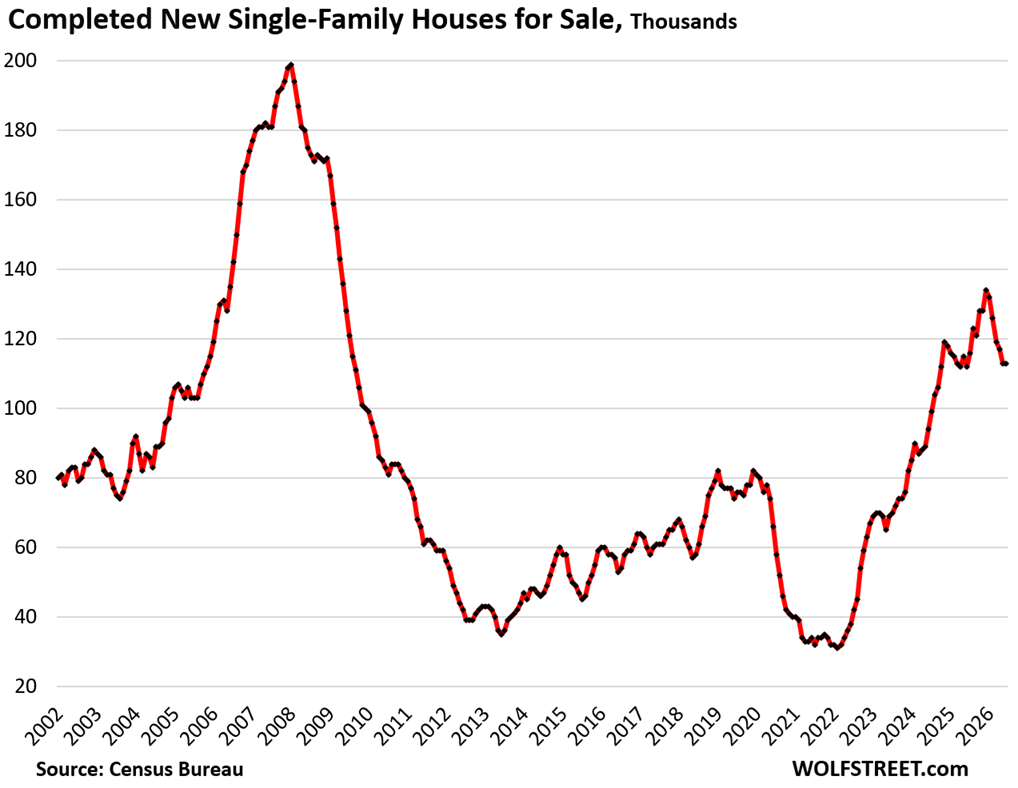
More critical for the builders’ balance sheets are the "completed" homes—often referred to as "spec homes." There are currently 113,000 completed new homes sitting empty and for sale across the U.S. This is a 49% increase from 2019 levels. These homes represent "dead capital" for builders; they are paying taxes, insurance, and maintenance on these properties every day they sit unsold. This is the primary driver behind the aggressive "deals" being offered. A builder would rather sacrifice 5% or 10% of their margin via a rate buydown than have a completed house sit on the books for six months.
Broader Economic Implications and the Path Forward
The current state of the new home market serves as a leading indicator for the broader U.S. economy. The Federal Reserve’s "higher for longer" interest rate policy is clearly achieving its goal of cooling the housing sector, but the unintended consequence is a massive supply-demand imbalance that varies wildly by region.
The fact that homebuilders are continuing to build despite the glut—adding much-needed supply to the U.S. housing stock—is a positive sign for long-term inventory health. However, in the short term, the market is in a state of paralysis. Buyers are waiting for lower rates, while builders are trapped between high construction costs and the need to move inventory.
If the current trend of rising inventory and falling sales continues, the industry may see further consolidation. Smaller, private builders who lack the deep pockets of a Lennar or a D.R. Horton may find it impossible to compete with the massive mortgage buydowns offered by the public giants. Furthermore, the 9.3-month supply of inventory suggests that downward pressure on home prices will persist through the remainder of the year.
For the American consumer, the message is clear: the "seller’s market" for new homes has evaporated, particularly in the South and West. With builders highly motivated to clear their books before the end of the fiscal year, the coming months may represent the best opportunity for buyers in nearly half a decade—provided they can navigate the complexities of today’s financing environment. The housing market is no longer a monolith of rising prices; it has become a fragmented landscape where the deal of a lifetime may be just one builder incentive away.