The Death of the Golden Era: Why the Next Decade of Stock Market Returns Will Look Nothing Like the Last Sixteen Years

In 2016, a major warning echoed across global financial markets when McKinsey & Company published a report declaring that the “golden era” for investors had officially drawn to a close. The consultancy argued that the unique combination of falling interest rates, expanding profit margins, and rising valuation multiples that had fueled above-average returns in the wake of the 2008 financial crisis could not be replicated. The report cautioned that younger savers would either need to work seven additional years or nearly double their savings rates to achieve their financial goals.
Nearly a decade later, market historians and financial analysts have begun looking backward to grade that 2016 forecast. Led by analysts such as Ben Carlson, reviews of the prediction have revealed a stark reality: the call was fundamentally incorrect. Since the spring of 2016, U.S. equities have generated annualized returns of roughly 15%, more than tripling in value. European shares compounded at a robust rate of approximately 10%. Savers who followed the advice to double their contributions found themselves in an enviable position, while forecasters were left confronting the reality that sometimes the most valuable phrase in finance is simply admitting, "I don’t know."

Even market commentators who published similar cautions found themselves caught off guard as the broader indexes marched steadily upward. Anyone claiming to have foreseen the exact trajectory of the post-2016 bull market is likely ignoring the hard mechanics of how those returns were actually generated. To understand whether the underlying warnings of 2016 hold any truth for the decade ahead, financial analysts must look past the headline numbers and break down the anatomy of the recent market cycle using historical datasets, such as Robert Shiller’s long-term market valuation series dating back to 1871.
Deconstructing the Anatomy of Above-Average Returns
When analyzing real total returns over long horizons, financial economists typically divide performance into three distinct components: underlying earnings growth, dividend payouts, and valuation multiple expansion—commonly measured through the cyclically adjusted price-to-earnings (CAPE) ratio.
An examination of the data from the past sixteen years reveals a surprising underlying normalcy once valuation shifts are stripped away. Real earnings grew at an annualized rate of 4.91%, roughly triple the long-run historical average of 1.91%. Meanwhile, dividend yields contributed 1.96 percentage points, falling well below the historical norm of 4.25% due to persistently thin dividend yields in modern equity markets.
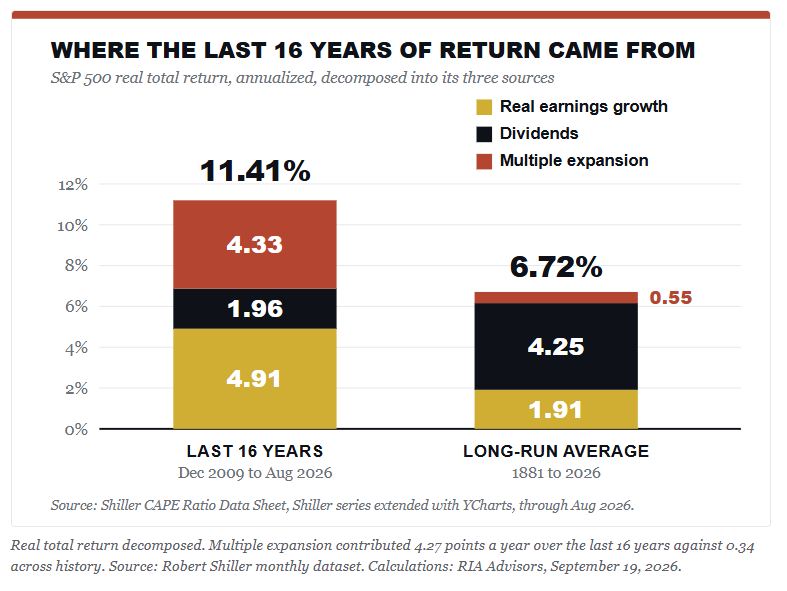
The primary driver of outperformance, however, came from the third component: the valuation multiple. The Shiller CAPE ratio climbed from 20.32 at the end of 2009 to a staggering 41.04 by October of 2026. This single factor—the willingness of investors to pay more for the exact same stream of corporate earnings, entirely independent of profit growth or dividend distributions—added 4.33 percentage points annually to investor returns.
When that multiple expansion is removed from the equation, the market’s real return over the past sixteen years drops to approximately 7%, aligning almost perfectly with the long-run historical average. Every point of excess return was driven by market participants agreeing to pay increasingly higher prices for every dollar of smoothed corporate profit.
This oversight explains why forecasts like McKinsey’s missed the mark. Analysts correctly identified the exhausted macro tailwinds but incorrectly assumed that the market’s re-rating process had reached its terminal limit. Instead, multiple expansion continued for another decade, rendering conservative forecasts obsolete.

Why Historical Precedent Suggests Outperformance Cannot Repeat
Projecting these conditions forward exposes a mathematical wall. For the stock market to replicate its recent performance through multiple expansion from its current starting point, the CAPE ratio would need to climb to more than 83 over the next sixteen years. No major equity market in recorded financial history has sustained a valuation multiple approaching half that level.
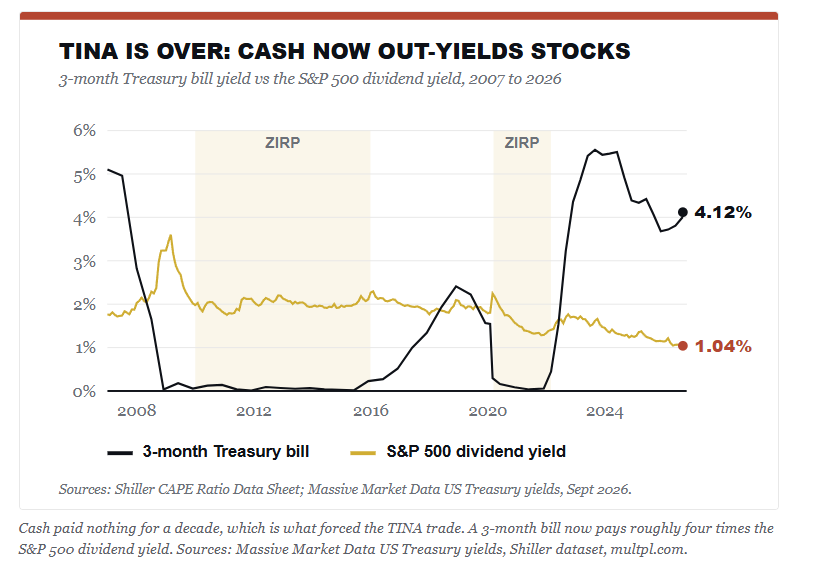
The extraordinary valuation expansion observed over the past decade and a half was largely facilitated by unprecedented monetary policy. For roughly half of the sixteen-year period following the 2008 crisis, the federal funds rate was pinned near zero—specifically from January 2010 through December 2015, and again from March 2020 through 2022. During the 2010–2021 window, the 10-year Treasury yield averaged just 2.20%, compared to a historical average of 4.71% dating back to 1871. Simultaneously, central bank balance sheets expanded dramatically, flooding the global financial system with liquidity that depressed discount rates and inflated asset prices.
This dynamic creates a structural dilemma for modern portfolios. A return to zero-interest-rate policies (ZIRP) and quantitative easing (QE) would likely require an economic crisis severe enough to justify such extreme intervention, meaning significant portfolio damage would occur beforehand.
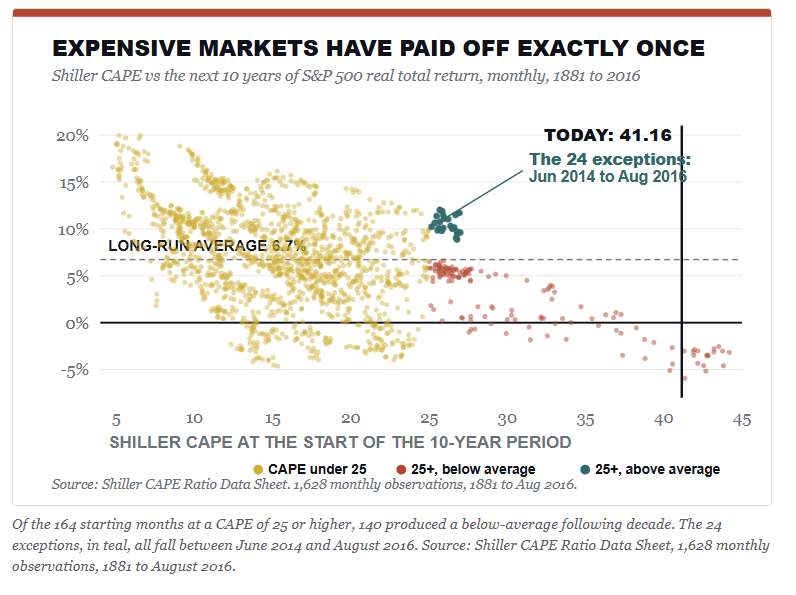
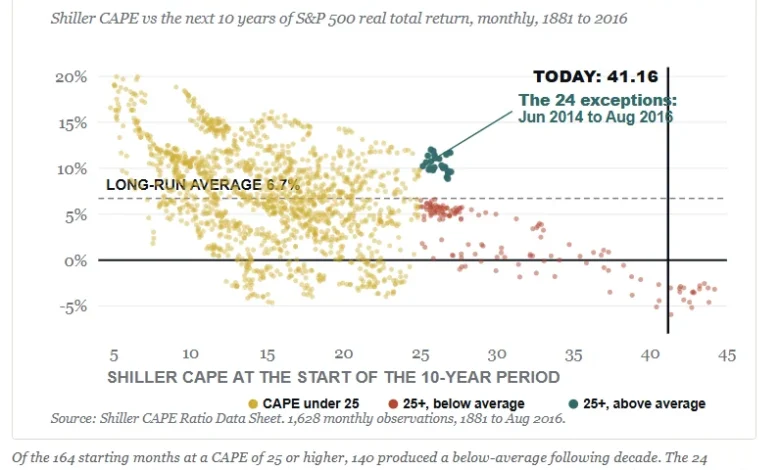
Historical analysis of Shiller’s dataset from 1881 onward—encompassing 1,628 overlapping ten-year windows—illustrates the clear relationship between starting valuations and future returns. Of the 164 historical months that began with a CAPE ratio of 25 or higher, approximately 85% resulted in subsequent ten-year real returns below the long-run average of 6.72%. When the CAPE ratio exceeded 30, subsequent ten-year annualized real returns averaged a loss of 1.02%.
While historical anomalies exist—such as a brief window between 2014 and 2016 where expensive markets managed to post strong subsequent gains—those periods relied on unique combinations of falling interest rates, aggressive emergency liquidity measures, and emerging technological revolutions that pushed multiples even higher from already elevated bases. Replicating that feat from a CAPE ratio exceeding 41 requires an assumption that historical valuation gravity no longer applies.
The Shift in Macroeconomic Flows and the Return of Yield
Beyond valuation math, the broader macro environment has shifted through capital flows. For much of the decade following the financial crisis, the "TINA" acronym—representing the sentiment that "There Is No Alternative" to equities—dominated institutional and retail strategies. With the 3-month Treasury bill averaging just 0.56% between 2010 and 2020, cash offered virtually zero return, forcing capital into risk assets by default.
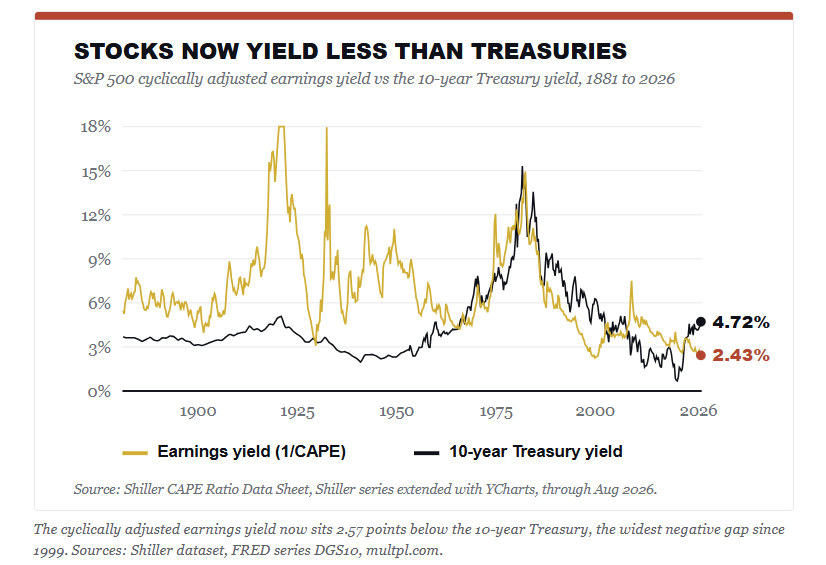
That landscape has transformed. With short-term Treasury bills yielding significantly higher than the dividend yield of the S&P 500, cash and fixed-income instruments once again provide a competitive yield without equity drawdown risk. For the first time in fifteen years, safe assets offer a viable alternative for conservative investors and retirees, introducing a structural headwind for equity market inflows.
Portfolio Implications and Realistic Expectations for Investors
Financial planners emphasize that valuation metrics like the CAPE ratio remain poor timing tools for predicting short-term market movements over the next several quarters. However, they serve as reliable indicators of long-term return potential.
Evaluating forward scenarios from a starting CAPE of 41 requires examining various paths for multiple reversion and real earnings growth. Even under optimistic assumptions—such as sustained real earnings growth of 4% to 6% annually—if valuation multiples remain flat or drift downward toward historical averages, annualized real returns over the coming decade are projected to range between negative territory and roughly 5%. Only under the most aggressive, historically unprecedented assumptions does the market approach the double-digit nominal returns seen in the previous era.
For individual investors and retirement planners, these projections point toward the necessity of expectation management rather than blanket divestment. Exiting the equity market entirely risks missing potential upside during late-cycle expansions, but relying on outdated return assumptions in retirement calculators can jeopardize long-term financial security. Adjusting savings rates, reassessing portfolio diversification, and accounting for a lower-return macro environment remain the most prudent responses to a market priced for perfection.
Related posts: