Bitcoin Reaches Critical Juncture at $77,000 as Spot ETF Inflows and Shifting Holder Dynamics Fuel Recovery

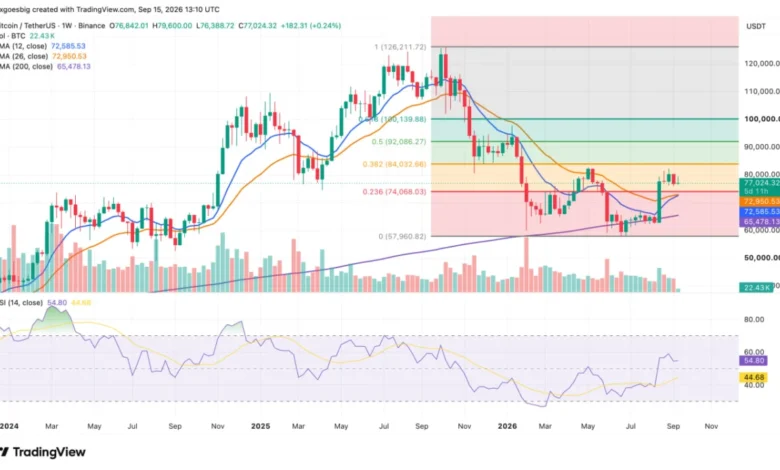
Bitcoin is currently changing hands near the $77,000 threshold, marking a notable rebound from the severe $58,000 to $60,000 correction zone that brought an end to its protracted downward slide from an all-time high of $126,200. On the weekly timeframe, this upward movement is being interpreted by market analysts primarily as a structural recovery within an established trading range rather than a definitive, confirmed trend reversal. While immediate downside pressure has conspicuously evaporated, the broader macroeconomic and technical architecture of the market reveals a digital asset standing at a critical crossroads.
The structural blueprint of the preceding downtrend—characterized by a sequence of descending lower highs oscillating within the $80,000 to $84,000 resistance band—remains fundamentally intact. Until Bitcoin successfully prints a higher high that decisively breaches and closes above this formidable zone, the weekly trend technically remains downward. Nevertheless, the underlying market dynamics have undergone a measurable shift. The persistent loss of aggressive downside momentum is evident: price action has ceased making lower lows, successfully reclaimed both major weekly exponential moving averages (EMAs), and decisively repositioned itself back above the critical 200-week simple moving average (SMA), which steadfastly served as the ultimate floor throughout the tumultuous market phases of the year.
This configuration points directly to a downtrend that is systematically exhausting its force, rather than one that has already executed a textbook structural reversal. Navigating this delicate recovery requires an examination of the precise technical indicators, institutional flows, and macroeconomic catalysts currently steering the world’s largest cryptocurrency.
Anatomy of the Recovery: Technical Indicators and Missing Confirmation Signals
A granular inspection of the weekly technical indicators illuminates the dichotomy between price recovery and trend confirmation. The 12-week EMA currently stands at $72,587, closely shadowed by the 26-week EMA at $72,951. This leaves the faster moving average approximately $364 below its slower counterpart. In historical technical analysis, the crossover event—where the faster EMA crosses decisively above the slower EMA—serves as the definitive mechanical marker signaling a weekly trend transition from bearish to bullish.
Although this gap has compressed dramatically following a sharp upward trajectory in the 12-week EMA, the crossover has yet to officially materialize. Price action, however, has outpaced the moving averages. Bitcoin is currently trading comfortably above both lines, marking a stark reversal from the first half of the year when prolonged periods were spent trapped in a defensive posture beneath these descending hurdles.
Market technicians universally emphasize a critical distinction: reclaiming historical moving averages represents a recovery phase, whereas a moving average crossover constitutes formal confirmation. At present, Bitcoin exhibits the former without the absolute validation of the latter. Complementing this price behavior, the weekly Relative Strength Index (RSI) has climbed to a healthy 54.81. This represents a substantial recovery from deeply oversold readings dipping below 30 during the height of the recent capitulation phase, cleanly clearing the neutral 50 midpoint while leaving ample runway before reaching the overbought threshold of 70.
The $84,000 Rejection Zone and Fibonacci Significance
The focal point for market participants tracking a legitimate trend change centers squarely on the 0.382 Fibonacci retracement level, pegged at $84,033. This specific numerical threshold holds immense technical gravity, aligning almost symmetrically with the historical supply zone that repeatedly rebuffed bullish rallies during the initial stages of the broader market correction. It represents a dual convergence of mathematical retracement and persistent market memory regarding past heavy selling pressure.
A decisive weekly candlestick close above the $84,000 threshold on expanding trading volume would achieve multiple structural objectives simultaneously. It would print the elusive higher high, secure a definitive breach of the 0.382 Fibonacci barrier, and likely coincide with the completion of the 12/26 EMA bullish crossover alongside an RSI firmly entrenched above 50. Analysts caution against relying on isolated metrics; any single indicator operating in a vacuum offers weak predictive value. However, when multiple technical confirmations converge within the parameters of a single weekly close, they forge a robust foundation for trend continuation.
Should the market successfully clear and hold above the $84,000 ceiling, subsequent historical overhead resistance references loom at $92,086 and $100,140, respectively.
The rationale behind prioritizing a weekly close over an intraday price touch lies in the nature of moving averages, which smooth out price action over three- to six-month periods. Consequently, a weekly close filter guards portfolios against deceptive false breakouts and intraday volatility spikes. A temporary, speculative daily spike through $84,000 that falters and retreats before Sunday’s market close leaves the prevailing structural downtrend intact. Furthermore, current trading volume remains relatively subdued, lacking the exceptional surge typically associated with explosive, institutional-grade breakouts. Breakouts unsupported by robust participation are historically prone to swift retracements.

| Signal | Technical Reading | Prevailing Bias |
|---|---|---|
| Price Structure | Approximately $77,000 | Neutral |
| 0.236 Fibonacci Retracement | $74,000 (Successfully Reclaimed) | Bullish |
| 0.382 Fibonacci Retracement | $84,000 (Unreclaimed Resistance) | Bearish |
| 12/26 Weekly EMA Spread | 12 EMA trailing 26 EMA by ~$364 | Neutral |
| Price vs. Moving Averages | Trading above both 12 and 26 EMAs | Bullish |
| 200-Week Simple Moving Average | $65,478 (Price holding securely above) | Bullish |
| Weekly Relative Strength Index (RSI) | 54.81 | Bullish |
| Market Volume | Below historical moving averages | Neutral |
Institutional Accumulation and On-Chain Holder Behavior
While technical charts debate the validity of the trend reversal, institutional participation and on-chain metrics provide compelling evidence of sustained underlying demand. Data compiled by Farside Investors highlights that U.S. spot Bitcoin exchange-traded funds (ETFs) registered a notable $160 million in net inflows. BlackRock’s iShares Bitcoin Trust (IBIT) accounted for the lion’s share of this daily metric, single-handedly driving $134 million in demand and underscoring the uneven distribution of capital among competing fund products.
This latest single-day print cements a broader institutional trend defined by six consecutive weeks of positive net inflows. The rolling four-week average has steadily climbed to approximately $1.5 billion, marking the highest sustained institutional accumulation phase observed. Steady, predictable spot market buying of this caliber systematically absorbs available circulating supply, offering a fundamental explanation for how Bitcoin successfully reclaimed its intermediate moving averages despite broader macroeconomic headwinds.
Nevertheless, the velocity of these inflows is visibly cooling. Weekly net inflows have tapered from a staggering peak of $3.3 billion down to $1.3 billion, indicating that institutional demand has transitioned from hyper-accelerated accumulation to a more deliberate, persistent posture.
Simultaneously, on-chain analytics illuminate a profound evolution in investor psychology and coin distribution. Darkfost, a prominent contributor at analytics platform CryptoQuant, recently spotlighted a critical short-term holder (STH) behavioral metric. According to the data, short-term holder supply residing in an unrealized profit state currently hovers near $168 billion, dwarfing the roughly $103 billion of STH supply sitting at an unrealized loss.
The underlying economic mechanism is direct and impactful: when short-term market participants are predominantly underwater, any relief rally is immediately met with aggressive selling as investors seek to break even, effectively capping the upside momentum of rallies. Conversely, once a critical mass of short-term holders transitions into profitable territory and makes the conscious behavioral choice to hold their positions rather than liquidate, overhead supply drastically thins out. Historically, this specific psychological flip from widespread loss to localized profit accumulation has served as a foundational precursor marking the definitive conclusion of past cyclical bear markets. While this metric evaluates human behavioral sentiment rather than providing an immediate mechanical entry signal, it adds essential context to the macroeconomic and technical landscape.
Macroeconomic Pressures and the Path Forward
Despite the constructive developments unfolding across technical charts and on-chain metrics, the primary near-term risk factor facing Bitcoin remains aggressively macroeconomic. Global financial markets are currently holding their breath ahead of an impending Federal Reserve rate decision. The U.S. central bank faces intense, multifaceted pressure regarding the precise trajectory of monetary policy and interest rate adjustments. A hawkish policy outcome or unexpected resistance to rate cuts could trigger widespread deleveraging across risk-on assets precisely at the juncture where Bitcoin is attempting to validate its structural recovery.
Because the Federal Reserve’s policy announcement and the impending weekly candle close fall within the exact same operational window, an unusual degree of market sensitivity rests upon the upcoming sessions.
The operational parameters for traders remain strictly defined. On the downside, $74,000 serves as the primary line in the sand; a failure to hold this reclaimed 0.236 Fibonacci level would plunge prices directly back among the converging EMAs, invalidating the recent recovery and re-opening the door to lower consolidation bands. Conversely, the $80,000 to $84,000 corridor remains the ultimate battleground.
The confirmation sequence required to establish long-term bullish dominance is methodical: price must successfully defend the $74,000 floor, the 12-week EMA must decisively cross above the 26-week EMA, the weekly RSI must maintain its footing above the 50 centerline, and the market must print a confirmed weekly close through $84,000 supported by expanding volume.
A notable stabilizing factor underpinning the current advance is its composition. Unlike previous market cycles heavily reliant on excessive leveraged futures contracts, the present upward movement is overwhelmingly driven by spot market demand channeled through regulated ETFs and healthy on-chain accumulation. Historically, spot-led market expansions have demonstrated significantly greater durability and resilience once macro headwinds clear and confirming volume finally materializes.