Dissecting the Discrepancies in United States Employment Data and the Case for Long-Term Household Survey Averages
The Bureau of Labor Statistics (BLS) released its March 2026 employment report on the first Friday of the month, revealing a headline figure of 178,000 nonfarm payroll additions. This figure significantly outpaced Wall Street’s consensus estimate of 60,000, triggering an immediate rally in equity futures and a recalibration of interest rate expectations among market participants. However, a granular analysis of the underlying data suggests that the perceived strength of the labor market may be an artifact of statistical noise rather than organic economic expansion. Beneath the headline "beat," the report reveals a landscape defined by mechanical rebounds, significant downward revisions to prior months, and structural flaws in the methodology used to calculate the nation’s employment health.
The discrepancy between the perceived and actual state of the labor market has become a focal point for economists and policymakers. While the headline number suggests a resilient economy, the internal composition of the March report indicates that the majority of gains were concentrated in sectors recovering from temporary disruptions. As the BLS continues to grapple with declining response rates and outdated modeling, the credibility of the monthly "first print" has come under intense scrutiny.

The Anatomy of the March 2026 "Beat"
The primary driver of the March payroll surprise was the healthcare sector, which contributed 76,000 jobs—the largest single-sector gain in the report. Within this category, the offices of physicians added 35,000 workers. However, the BLS explicitly noted that this surge was largely due to the return of striking Kaiser Permanente nurses and physicians in California and Hawaii. In statistical terms, this does not represent the creation of new employment but rather the reversal of a prior month’s contraction caused by labor disputes.
Similarly, the construction sector added 26,000 jobs, a figure largely attributed to a weather-related rebound following uncharacteristically severe storms in January and February that had stalled projects across the Northeast and Midwest. Transportation and warehousing added another 21,000 positions. When these three mechanical factors—strike resolutions and weather corrections—are stripped away, the underlying trend of the U.S. labor market appears far more stagnant than the 178,000 figure suggests.
The report also highlighted ongoing weakness in other critical areas. Federal government employment fell by 18,000 in March, continuing a sharp contractionary trend. Since October 2024, the federal workforce has shrunk by approximately 355,000 jobs, an 11.8% decline that reflects aggressive fiscal tightening and departmental restructuring. Financial activities also showed strain, shedding 15,000 jobs and marking a total decline of 77,000 since the sector’s peak in May 2025.
A Chronology of Revisions and Methodological Erosion
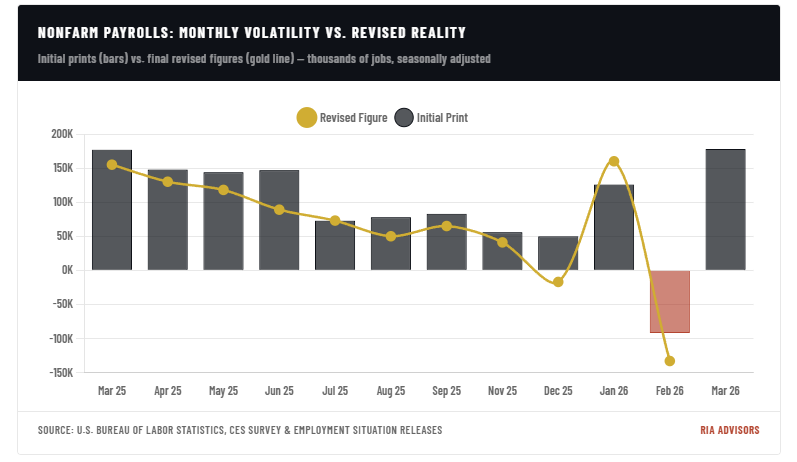
The volatility of the March report is part of a broader pattern of "initial strength followed by quiet retraction." The BLS revised February’s figures from an initially reported decline of 92,000 to a more severe contraction of 133,000. While January’s figure was nudged upward to 160,000, the net job creation across the first two months of 2026 was a negative 7,000. This trend of significant revisions suggests that the initial data released to the public is increasingly unreliable as a real-time indicator.
Economists point to three structural flaws within the BLS methodology that have exacerbated this unreliability over the last three years:
1. The Sampling Crisis
The establishment survey, which forms the basis for the nonfarm payroll number, currently samples approximately 119,000 businesses and government agencies. While this covers roughly 622,000 worksites, it represents only 26% of total nonfarm payroll jobs. The remaining 74% of the labor market is estimated through statistical modeling.

Compounding this issue is the collapse in "first-closing" response rates. Before the 2020 pandemic, response rates typically hovered around 70%. Today, that figure has fallen to approximately 60%. Michael Horrigan, a former BLS veteran and current president of the Upjohn Institute for Employment Research, has noted that this decline means the initial monthly print—the one that moves global markets—is based on a shrinking fraction of the total workforce. The "actual" data only arrives during the second and third closes, months after the market has already reacted to the estimate.
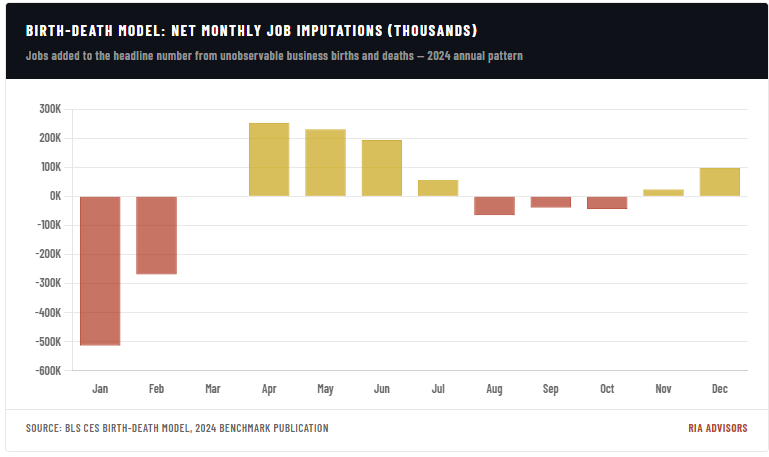
2. The Birth-Death Model Lag
To account for new businesses being formed and old ones closing, the BLS employs the "Birth-Death model." This model uses historical data from the Quarterly Census of Employment and Wages (QCEW) to estimate current business churn. However, the QCEW data lags the current period by six to nine months.
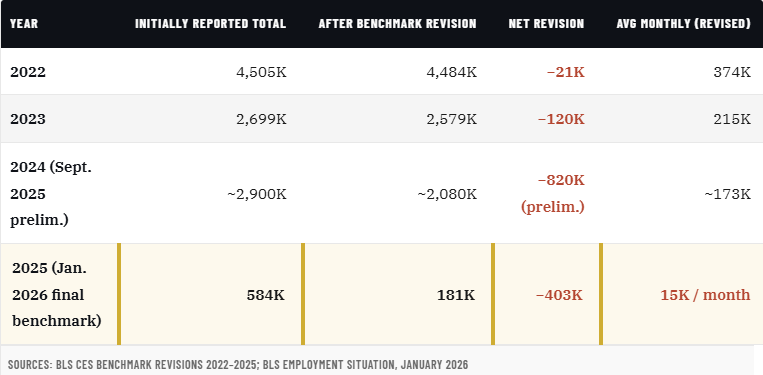
In a stable economy, this lag is negligible. In the volatile environment of 2024-2026, characterized by shifting trade policies and federal workforce reductions, the model has consistently failed. Federal Reserve Chair Jerome Powell addressed this issue in late 2025, acknowledging an "almost predictable overcount" of jobs due to model errors. The 2025 benchmark revision confirmed this, revealing that the BLS had overstated employment by 911,000 jobs over a twelve-month period. When finalized, the average monthly gain for 2025 was revealed to be just 15,000, a fraction of the 48,000 initially reported.
3. Obsolete Seasonal Adjustments
The X-13 ARIMA-SEATS algorithm used by the BLS to strip out seasonal variations—such as holiday hiring or summer construction—relies on historical baselines. The unprecedented disruptions of the last five years, including pandemic lockdowns, stimulus-driven hiring surges, and a federal government shutdown in October 2025, have effectively "broken" these baselines. The seasonal expectations baked into the model no longer reflect recurring real-world patterns, leading to artificial jumps in adjusted employment that are almost always reversed in subsequent months.
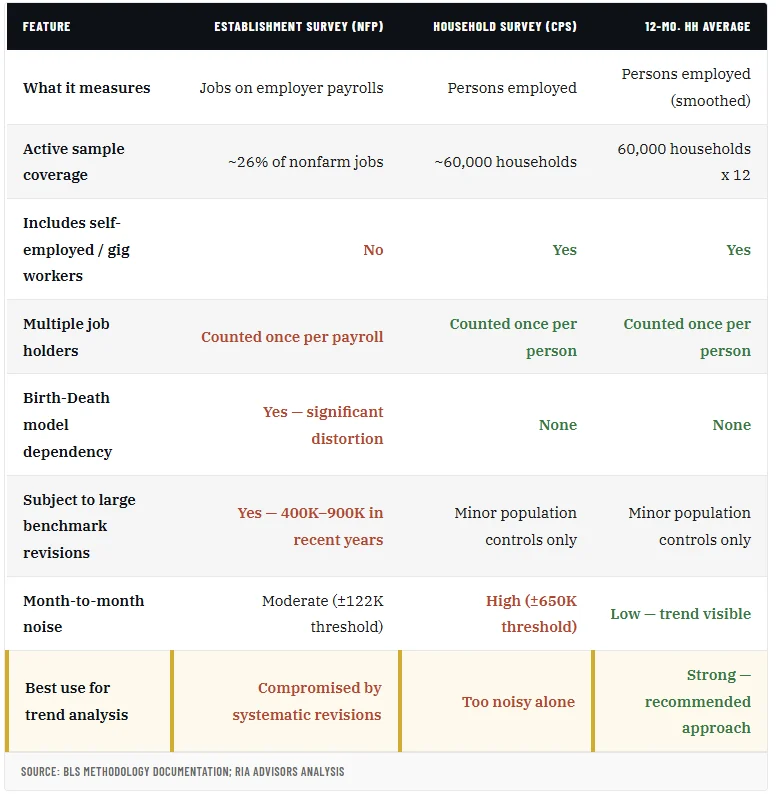
The Household Survey: A More Honest Metric?
Given the systemic issues with the establishment survey, a growing cohort of economists is advocating for a shift in focus toward the Current Population Survey, or the "household survey." Unlike the establishment survey, which counts jobs, the household survey counts people. This distinction is vital in an economy where gig work and multiple job-holding are on the rise.
In the establishment survey, a person working two part-time jobs is counted as two payroll additions. In the household survey, they are counted as one employed person. This makes the household survey a more accurate measure of actual economic participation. However, the household survey is notoriously volatile on a month-to-month basis, with a sampling error of approximately 650,000.
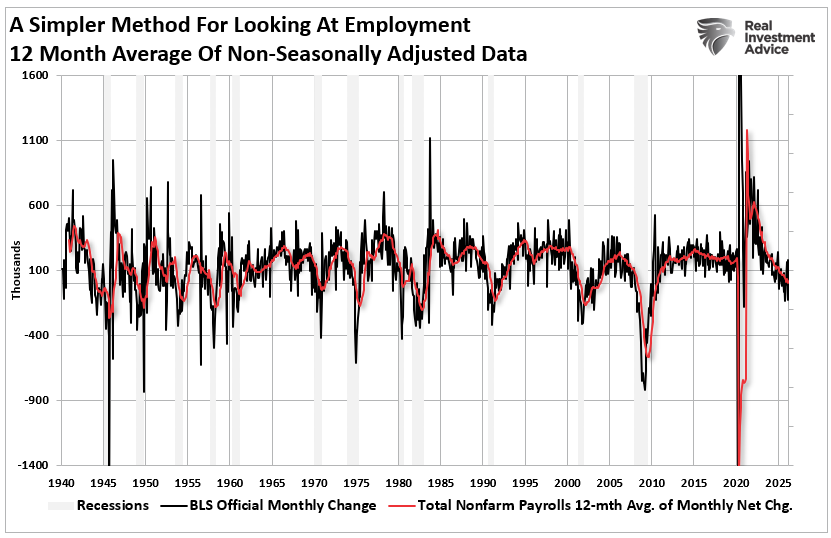
To solve this volatility, analysts suggest utilizing a 12-month rolling average of household survey data. This approach smooths out sampling noise, bypasses the Birth-Death model entirely, and eliminates the distortions of seasonal adjustments.
Data Comparison: Payrolls vs. Household Trends
When viewed through the lens of a 12-month rolling average, the U.S. labor market appears to be in a state of consistent deceleration. While the nonfarm payroll headlines have frequently signaled gains of 150,000 or more, the household survey average has settled into a range of 40,000 to 60,000 new employed persons per month. This is well below the level required to absorb normal labor force growth, suggesting that the "strength" reported by the BLS is largely a statistical illusion created by part-time work and modeling errors.
Historical data supports the household survey’s role as a leading indicator. Researchers at Econbrowser have noted that at major economic turning points, the household survey tends to capture the shift first, while the payroll survey only catches up months later during the benchmark revision process.
Broader Economic Impact and Policy Implications
The implications of these statistical discrepancies are profound for both investors and the Federal Reserve. If the labor market is significantly weaker than the headline numbers suggest, the Fed’s "higher for longer" interest rate stance may be based on faulty premises. Overstating employment strength can lead to overly restrictive monetary policy, increasing the risk of a hard landing.
Furthermore, the quality of employment is deteriorating. The household survey indicates that full-time employment has been particularly weak, with the majority of "gains" coming from part-time and gig-based positions. This has direct consequences for consumer spending capacity, as part-time workers generally lack the benefits and income stability associated with full-time roles.
The structural drag of federal employment also cannot be ignored. The elimination of 355,000 federal positions since late 2024 represents a significant withdrawal of liquidity from the labor market. As these displaced workers enter the private sector, they are doing so at a time when corporate hiring intentions are cooling due to tariff uncertainties and tightening financial conditions.

Conclusion
The March 2026 jobs report serves as a stark reminder of the limitations of modern economic data. While the 178,000 headline figure provided a temporary boost to market sentiment, the underlying reality is one of a decelerating labor market propped up by strike reversals and weather rebounds.
The persistent pattern of massive downward revisions—exemplified by the 2025 revision that cut reported job growth by nearly 70%—suggests that the current BLS methodology is ill-equipped for a post-pandemic economy. For investors and policymakers, the "noise" of the monthly payroll print has become a liability. Moving forward, the 12-month rolling average of the household survey offers a more sober, honest, and reliable representation of the nation’s employment health. In an era where precision is often confused with accuracy, the simpler, person-based count of the household survey may be the only way to discern the true trend from the statistical fog.


