Pairs Trading and Statistical Arbitrage: A Quantitative Analysis of NSE Large-Cap Equities


The landscape of algorithmic trading has undergone a significant transformation over the past decade, with quantitative strategies moving from the exclusive domain of hedge funds to the forefront of academic and retail research. A recent project conducted by Shant Tandon, an analyst with a background in financial markets and consulting, provides a granular look at the practical application of market-neutral pairs trading within the National Stock Exchange (NSE) of India. Spanning a decade of market data from January 1, 2015, to June 30, 2025, the study evaluates the efficacy of mean-reversion strategies when applied to large-cap equities in the Banking, IT, Pharma, Cement, and Auto sectors.
The Mechanism of Statistical Arbitrage
Pairs trading is a classic statistical arbitrage technique predicated on the concept of cointegration. Unlike simple correlation, which merely measures how two assets move in tandem, cointegration identifies a long-term equilibrium relationship between two price series. When the spread between these assets deviates from its historical mean, the strategy assumes that the relationship will eventually revert to equilibrium, allowing the trader to profit from the temporary divergence.
Tandon’s methodology emphasizes a rigorous, walk-forward approach designed to mitigate the risks inherent in algorithmic modeling. By utilizing a 252-trading-day rolling training window, the strategy seeks to capture evolving market dynamics while ensuring that the parameters—specifically the hedge ratio (beta)—are updated frequently to reflect current volatility. The selection process employs the Augmented Dickey-Fuller (ADF) test to ensure residual stationarity, further refined by the Benjamini-Hochberg False Discovery Rate (FDR) at a 5% threshold. This control is critical; without it, the sheer volume of possible pairs in a 25-stock universe could lead to "data mining bias," where the strategy appears successful simply due to the random selection of statistically significant but economically meaningless patterns.
Chronology of the Study and Execution
The research period, commencing on January 1, 2015, covers several distinct economic regimes in India, including the post-demonetization era, the global pandemic market crash of 2020, and the subsequent recovery. By segmenting the analysis into a training phase and a testing phase, the study avoids the "look-ahead bias" that often plagues backtesting.
In the implementation phase, the strategy focused on three specific pairs that demonstrated robust cointegration: HDFCBANK.NS vs. KOTAKBANK.NS, HEROMOTOCO.NS vs. ULTRACEMCO.NS, and HCLTECH.NS vs. ICICIBANK.NS. The trading signals were derived from the z-score of the spread, with entry thresholds set at an absolute value of 1.5. A critical component of this execution was the inclusion of 5 basis points of transaction costs per leg, a necessary inclusion for any serious analysis to account for slippage and brokerage fees that can quickly erode the thin margins characteristic of arbitrage trading.

Quantitative Performance Metrics
The backtest results provide a sobering look at the challenges of institutional-grade algorithmic execution. With a total capital base of ₹15,00,000, the strategy generated 271 trades over the test period. While the win ratio stood at a respectable 63.47%, the overall financial outcome was modest. The total profit and loss (PnL) reached ₹1,65,544.97, representing an 11.04% return on capital over the decade-long period.
The performance metrics reveal a nuanced reality:
- Annualized Return: 0.30%
- Annualized Volatility: 13.34%
- Sharpe Ratio: 0.089
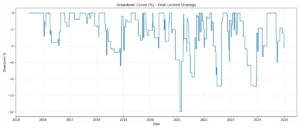
- Maximum Drawdown: -34.31%
These figures highlight a common hurdle in quantitative finance—the "Sharpe Ratio trap." While the strategy correctly identified mean-reverting behavior, the volatility of the underlying assets and the depth of the maximum drawdown suggest that the strategy was highly sensitive to specific market shocks. The low Sharpe ratio indicates that the risk-adjusted returns were insufficient to justify the capital allocation under current parameters, underscoring the necessity for more sophisticated risk management.
The Role of Rigor in Algorithmic Development
The study serves as an essential case study for aspiring quantitative traders regarding the difference between theoretical models and live-market execution. Tandon’s focus on excluding look-ahead bias and incorporating transaction costs aligns with the professional standards required by entities like the Executive Programme in Algorithmic Trading (EPAT).
Industry experts frequently observe that "clean" backtests are often the first step in a long process of optimization. The findings suggest that while the mathematical foundation of the strategy is sound, the "execution layer"—the rules governing position sizing, stop-loss triggers, and market regime filtering—is where the primary value is created.
Future Trajectories and Strategic Enhancements
To move from a prototype to a viable trading system, the research highlights several areas for potential improvement. First, the transition from an ADF(0) test to an information-criterion-based approach (such as AIC or BIC) for lag selection is recommended to reduce the incidence of spurious cointegration.

Second, the issue of concentration risk is evident. A three-pair portfolio, while easier to manage, is highly susceptible to sectoral shifts. Expanding the universe to include mid-cap stocks and diversifying across sectors would likely provide a more stable return profile. Furthermore, the implementation of dynamic position sizing, such as the Kelly Criterion or inverse-volatility weighting, would allow the model to allocate more capital to high-conviction signals while curbing exposure during periods of extreme market turbulence.
Perhaps the most significant area for improvement lies in the incorporation of stop-loss mechanisms. A maximum drawdown of -34.31% is generally unacceptable in a market-neutral strategy, which is theoretically designed to be uncorrelated with broader market movements. Introducing a hard stop-loss—such as liquidating a pair if the z-score exceeds 3.0 or if the unrealized loss hits a specific percentage—could fundamentally change the risk-return profile.
Implications for the Indian Financial Market
The analysis of NSE stocks via pairs trading offers a broader reflection on the maturity of the Indian equity markets. As retail and institutional participation continues to grow, the availability of high-frequency, clean data has allowed for the development of more complex, automated strategies. However, the study serves as a reminder that the Indian market is not immune to global trends of increased algorithmic efficiency.
As market participants look toward the future, the integration of Machine Learning (ML) and Artificial Intelligence (AI) into these traditional statistical models is becoming the industry standard. Tools that can dynamically adjust to "regime shifts"—periods where historical correlations break down—are replacing static models.
For those looking to replicate or build upon Tandon’s work, the path forward involves transitioning from simple linear models to adaptive ones. Resources provided by educational bodies like QuantInsti emphasize that the journey from a student project to a quantitative edge involves an iterative cycle of hypothesis, backtesting, rigorous risk assessment, and continuous deployment.
Ultimately, this research provides a template for transparency in algorithmic trading. By openly documenting the failures, the challenges, and the limitations alongside the successes, the study contributes to a more informed trading community. The objective for any quantitative researcher, as demonstrated by this project, is not to find a "holy grail" strategy, but to build a robust, repeatable process that can withstand the complexities of an ever-changing market environment. As the Indian financial sector continues to evolve, the focus on statistical rigor and risk-managed execution will remain the hallmark of successful quantitative development.