The Foundational Architecture of Systematic Trading: Why Data Infrastructure Dictates Quantitative Success

Algorithmic trading systems are frequently glamorized through the lens of sophisticated machine learning models, complex signal generation, and high-frequency execution logic. However, beneath the surface of these high-level abstractions lies a far more granular and critical reality: the integrity of the data infrastructure. For quantitative researchers and systematic traders, data is not merely a preliminary input; it is the definitive gating function for the entire lifecycle of a strategy. When the data layer is characterized by inconsistencies, latency, or lack of structure, every subsequent model inherits that instability, often leading to phantom signals and catastrophic backtest failures.
The modern quantitative research pipeline relies on a seamless integration of diverse datasets—ranging from tick-level historical prices and granular financial statements to event-driven macro indicators. As the scope of research expands across global markets and multi-year time horizons, the manual management of these datasets becomes an unsustainable bottleneck. The shift toward robust financial data APIs—such as those offered by Financial Modeling Prep (FMP)—represents a paradigm shift in how quants ingest, clean, and analyze information.
The Evolution of Data Ingestion in Quantitative Finance
Historically, financial data collection was a manual, error-prone process. Researchers would spend significant portions of their workdays scouring public filings, copying data from static spreadsheets, or scraping fragmented web sources. This "manual-first" approach introduced inherent risks: human error in data entry, inconsistent formatting across different sources, and the inability to refresh datasets in real-time.
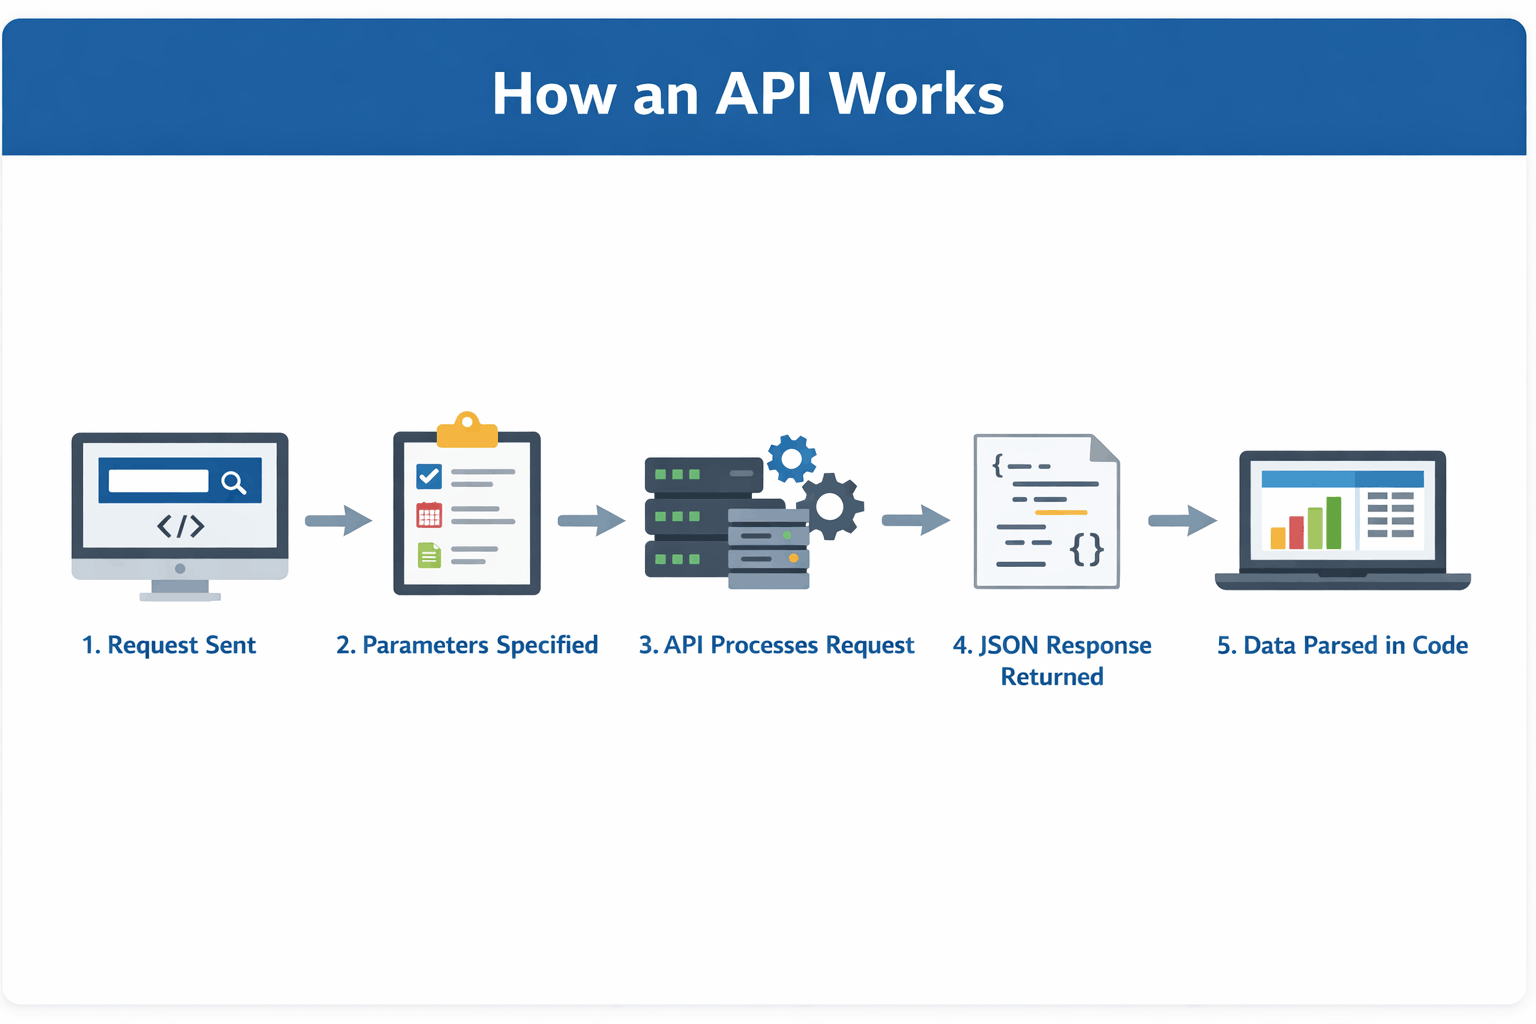
In the contemporary landscape, these manual workflows have been largely superseded by programmatic access via Application Programming Interfaces (APIs). An API serves as the standardized bridge between the vast repositories of a data provider and the local environment of the researcher. By automating the ingestion layer, developers can ensure that their Python-based pipelines are fed with structured, normalized data. This shift is not merely about convenience; it is about reproducibility—a cornerstone of the scientific method as applied to financial markets.
The Anatomy of a Modern Research Pipeline
A professional quantitative workflow is typically structured into three distinct stages: ingestion, feature engineering, and hypothesis testing. Each stage is dependent on the technical reliability of the data source.
1. Data Ingestion: The Gateway
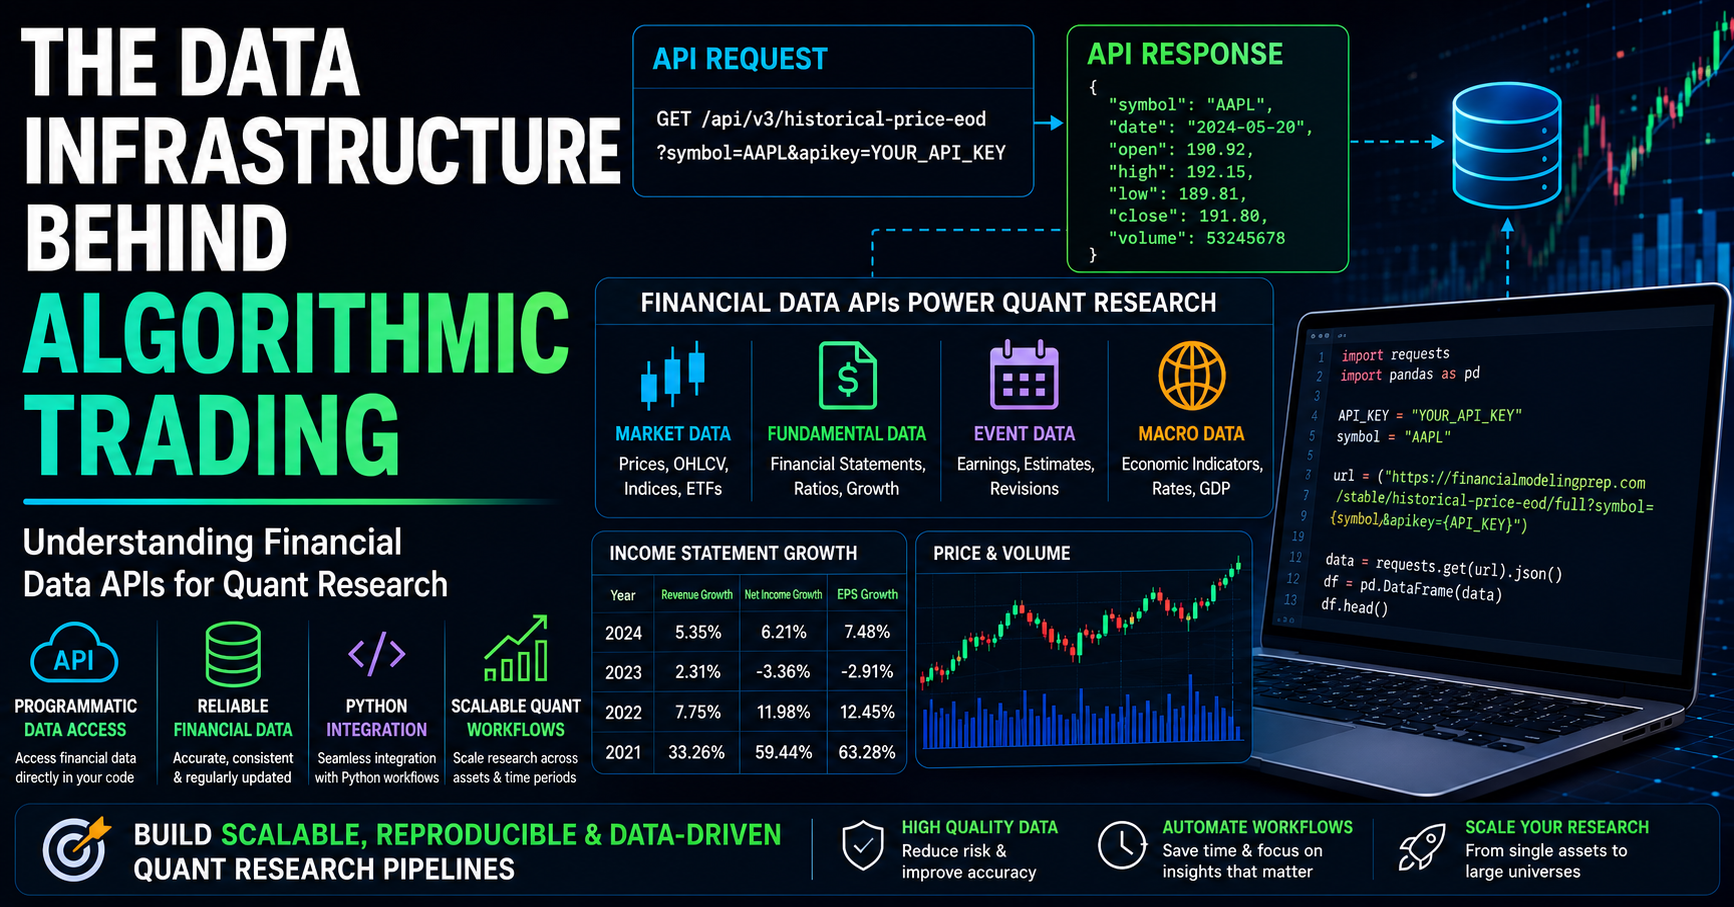
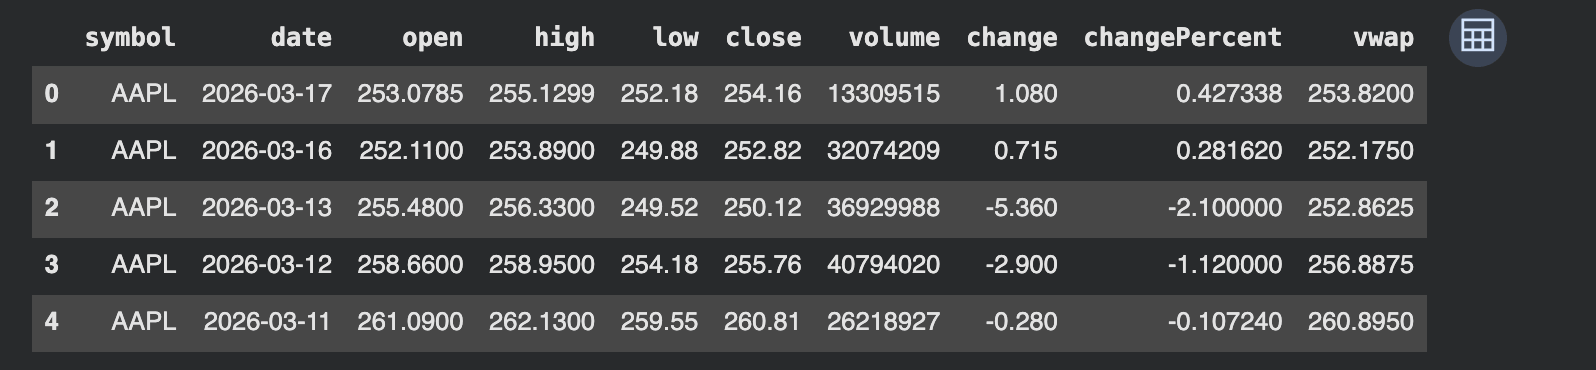
In the ingestion phase, the API acts as the primary conduit. By programmatically requesting historical price data or fundamental growth metrics, researchers avoid the "garbage in, garbage out" trap. For example, using a standard request pattern to pull end-of-day data for a ticker like AAPL allows the developer to immediately load the response into a Pandas DataFrame. This removes the need for custom parsing scripts and ensures that the schema—the arrangement of columns such as Open, High, Low, Close, and Volume—remains consistent regardless of the asset or time frame being analyzed.
2. Feature Engineering: Transforming Raw Data
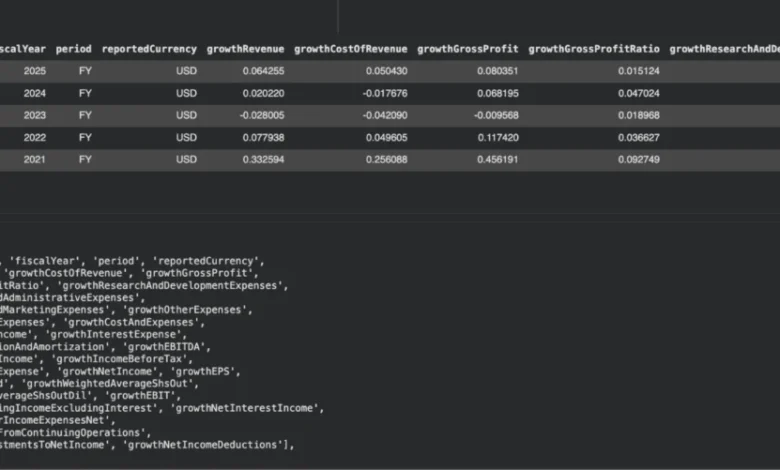
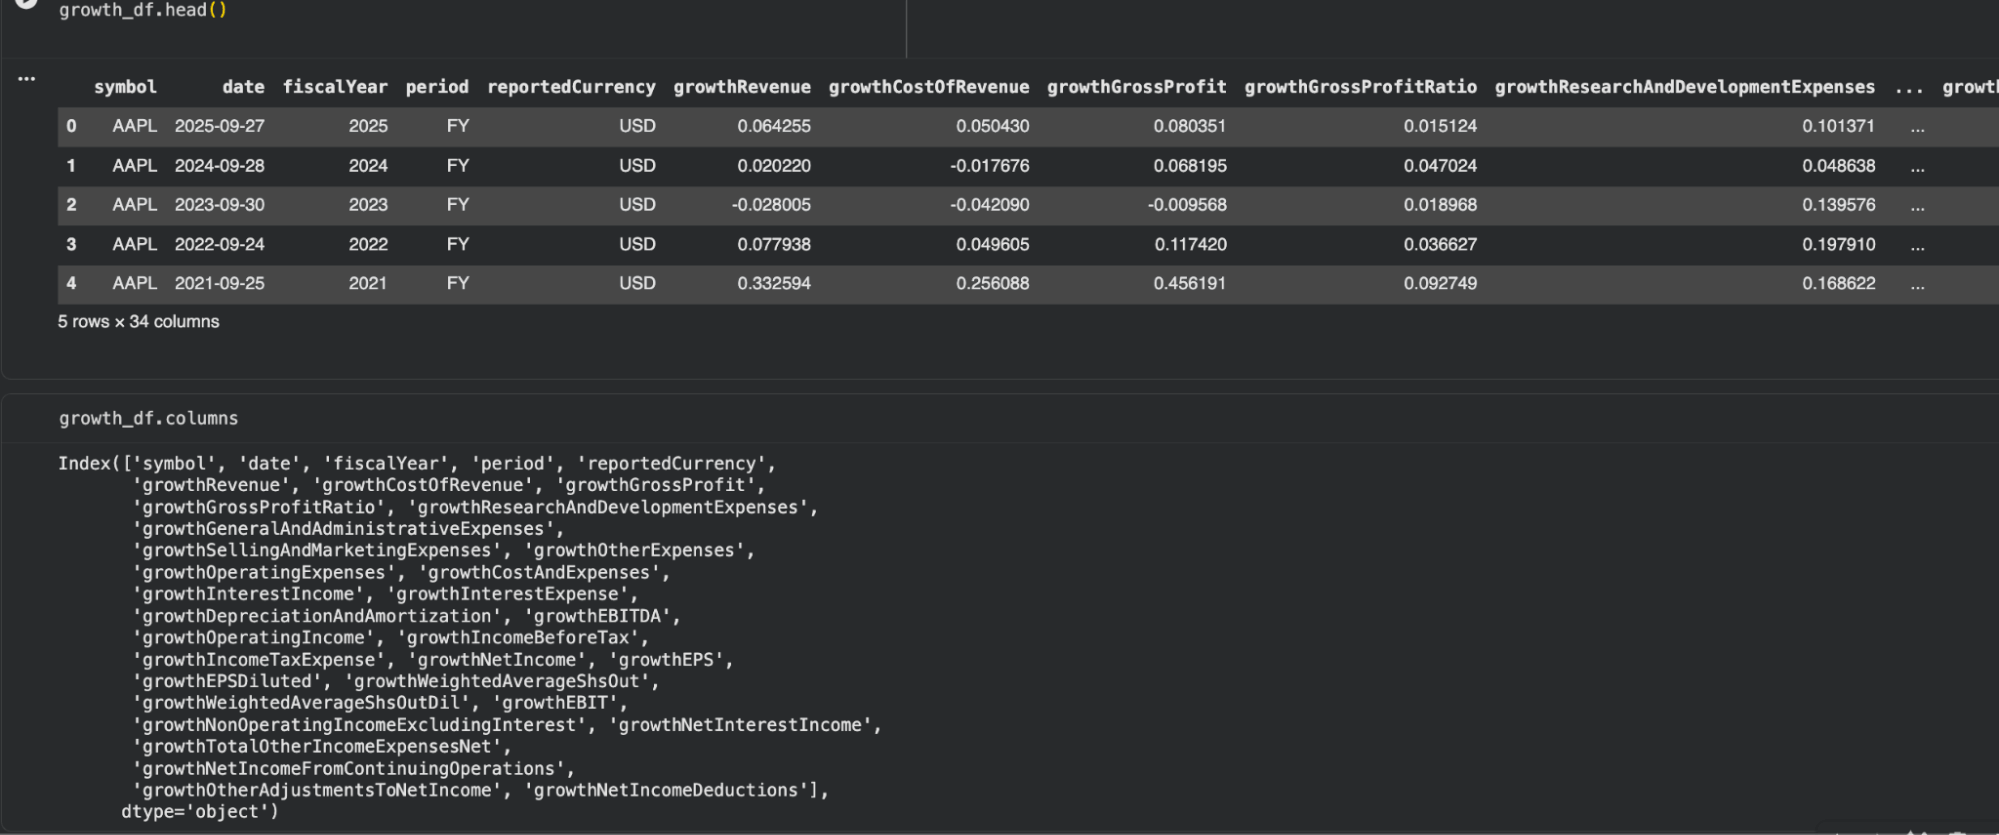
Once the data is ingested, the transformation process begins. This is where raw price points are converted into actionable signals. Simple technical indicators like moving averages or rolling volatility calculations serve as the bedrock of many strategies. However, the complexity increases when integrating fundamental data. For instance, aligning annual income statement growth data with daily price series requires careful temporal mapping. Failure to properly handle these frequency mismatches is a common source of look-ahead bias, where information from the future is inadvertently leaked into a past observation, leading to an overly optimistic backtest.
3. Hypothesis Testing: The Validation Phase
With a clean, aligned dataset, researchers can test specific hypotheses. A common scenario involves examining whether periods of low volatility coincide with improvements in fundamental metrics like revenue growth. By segmenting the data into quantiles and performing cross-sectional analysis, researchers can distinguish between noise and genuine market signals.
Chronology of Data Infrastructure Maturity
- The Early Era (1980s–1990s): Data was accessed via proprietary terminals or manual input from physical records. Access was expensive and restricted to institutional giants.
- The Spreadsheet Revolution (2000s): The democratization of data through web portals allowed individual researchers to download CSVs. However, this introduced "spreadsheet hell" and significant version control issues.
- The API Era (2010s–Present): The rise of cloud-native data providers has enabled programmatic access. Developers can now scale from a single security to a universe of thousands of stocks with a few lines of code, standardizing the research lifecycle.
The Economic and Technical Implications of Data Quality
The importance of data quality cannot be overstated. In quantitative finance, the difference between a profitable strategy and a failing one is often found in the margins of data accuracy. Issues such as survivorship bias—where the dataset only includes companies currently in existence and excludes those that went bankrupt—can create a massive upward bias in performance metrics. Similarly, the improper handling of corporate actions, such as stock splits or dividend adjustments, can render price data meaningless.
Reliable financial data APIs mitigate these risks by providing standardized data cleaning at the source. When a provider adheres to global market data standards, such as those overseen by organizations like the Financial Information Services Division (FISD), the researcher can trust that the inputs have been reconciled against primary sources. This allows the quant to spend more time on strategy development and less time on data cleaning and debugging.
Scalability: The Final Hurdle
For an institutional desk or a hedge fund, the ability to scale is the final hurdle. A pipeline that works perfectly for one asset must be robust enough to handle the entire S&P 500 or a global universe of thousands of equities. Programmatic workflows enable this by allowing for "batch" processing. By wrapping API calls in loops or using asynchronous programming, researchers can pull and process massive volumes of data in parallel.
As observed in industry-standard practice, the transition from an isolated notebook analysis to a scalable research system is the mark of professional maturity. The ability to automatically refresh data, re-engineer features, and re-test hypotheses against the latest market conditions ensures that the strategy remains adaptive to changing market regimes.
Broader Impact and Future Outlook
The shift toward robust, API-first data architecture has leveled the playing field between institutional desks and individual quantitative researchers. As machine learning and AI-driven strategies become more prevalent, the demand for "high-fidelity" data will only increase. Future-proofing a research pipeline now requires not just an understanding of mathematics and statistics, but a deep proficiency in software engineering and data infrastructure management.
In conclusion, the foundational layer of any successful systematic trading operation is the quality and accessibility of its data. Financial data APIs have effectively democratized the "input layer," allowing researchers to bypass the manual drudgery of the past and focus on the rigorous scientific process of hypothesis generation and validation. Whether the goal is to identify cross-sectional signals or to build complex multi-factor models, the path to success remains clear: prioritize the integrity of the data, standardize the infrastructure, and build for scale from day one. By treating data as a product rather than a commodity, researchers can transform their workflows into reliable, repeatable, and sophisticated engines of discovery in the global financial markets.