What the Infamous “Housing Shortage” Looks Like: Inventories of New Single-Family Homes Balloon, Sales Crawl, Prices Sag

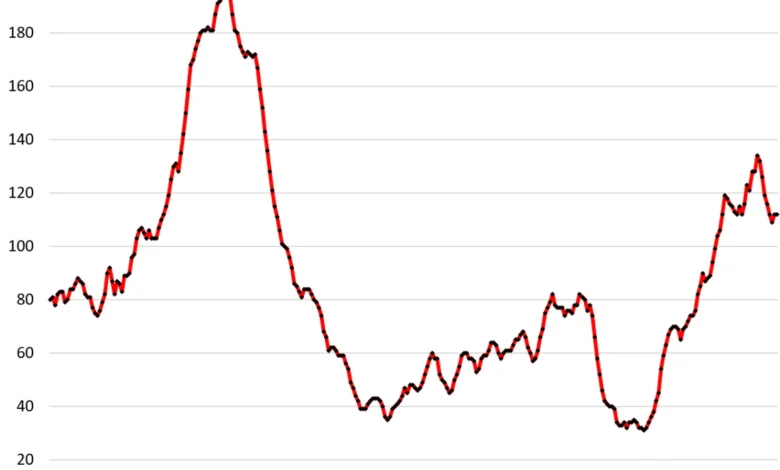
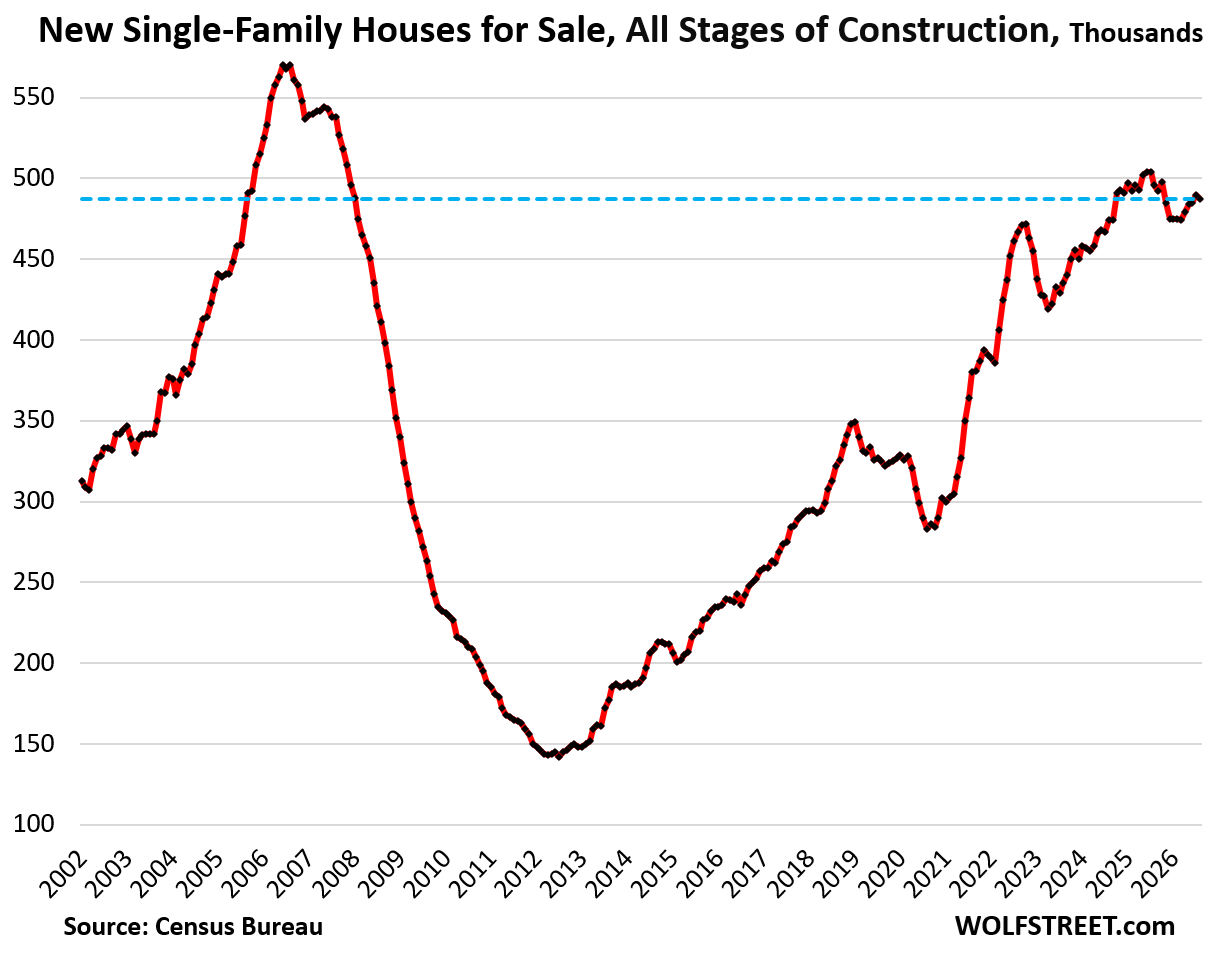
The inventory of single-family homes at various stages of development has climbed to 487,000 units. When viewed through a historical lens, this figure is stark: it represents a 50% increase from August 2019 levels and a 72% jump compared to August 2020. This accumulation of new housing inventory has now reached levels not seen since the height of the 2005–2007 housing bubble. Yet, unlike the speculative frenzy of that era, current sales volumes remain markedly lower, creating a decoupling between production and consumption.
The Dynamics of Modern Inventory
The current market reality is defined by an overabundance of supply relative to the prevailing rate of demand. Analysts note that homebuilders are currently sitting on approximately 8.5 months of supply. This metric is a critical indicator of market health; a balanced market is traditionally defined as having a five-to-six-month supply. Anything exceeding this threshold suggests that builders are facing significant pressure to move inventory, forcing them to pivot from a "take it or leave it" pricing strategy to one defined by concessions, incentives, and outright price reductions.
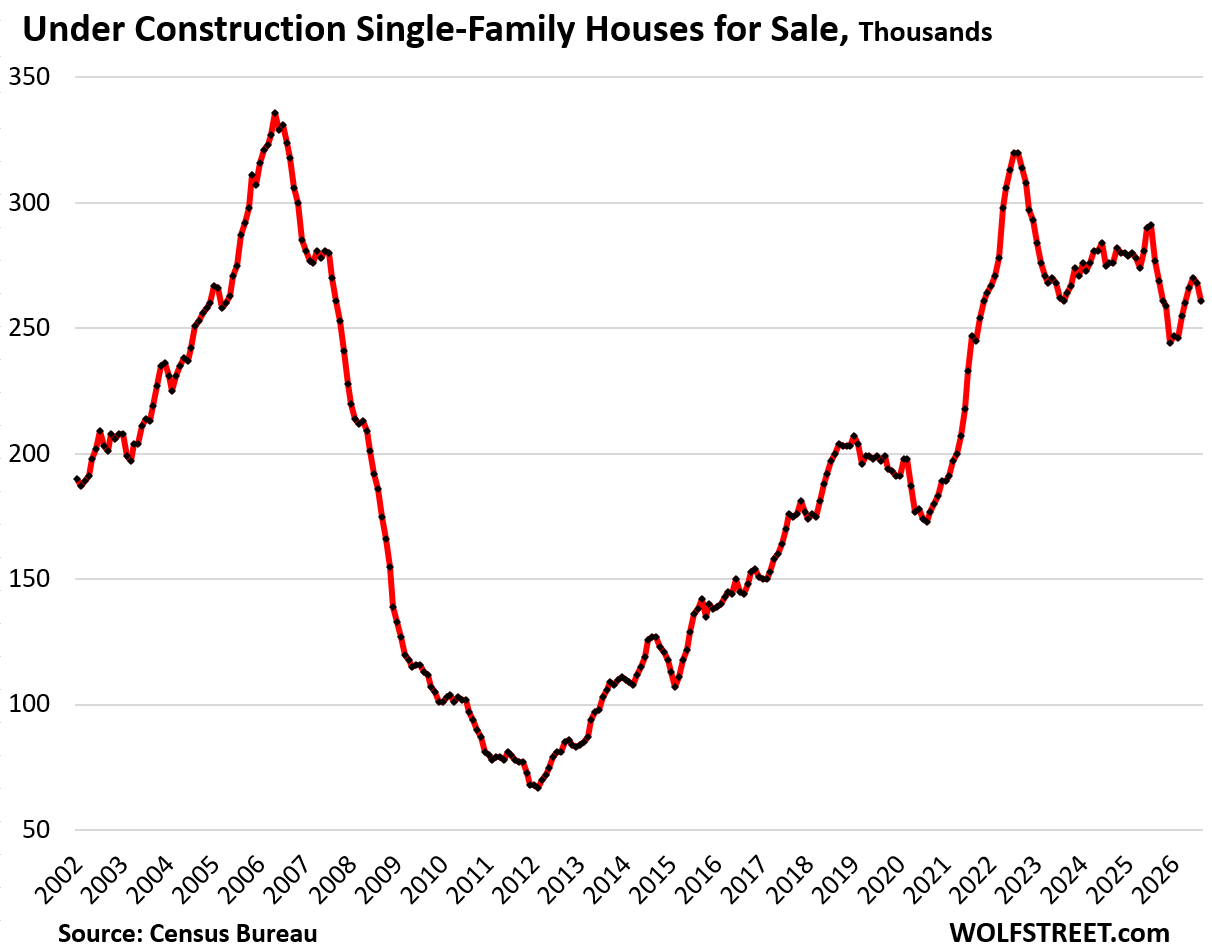
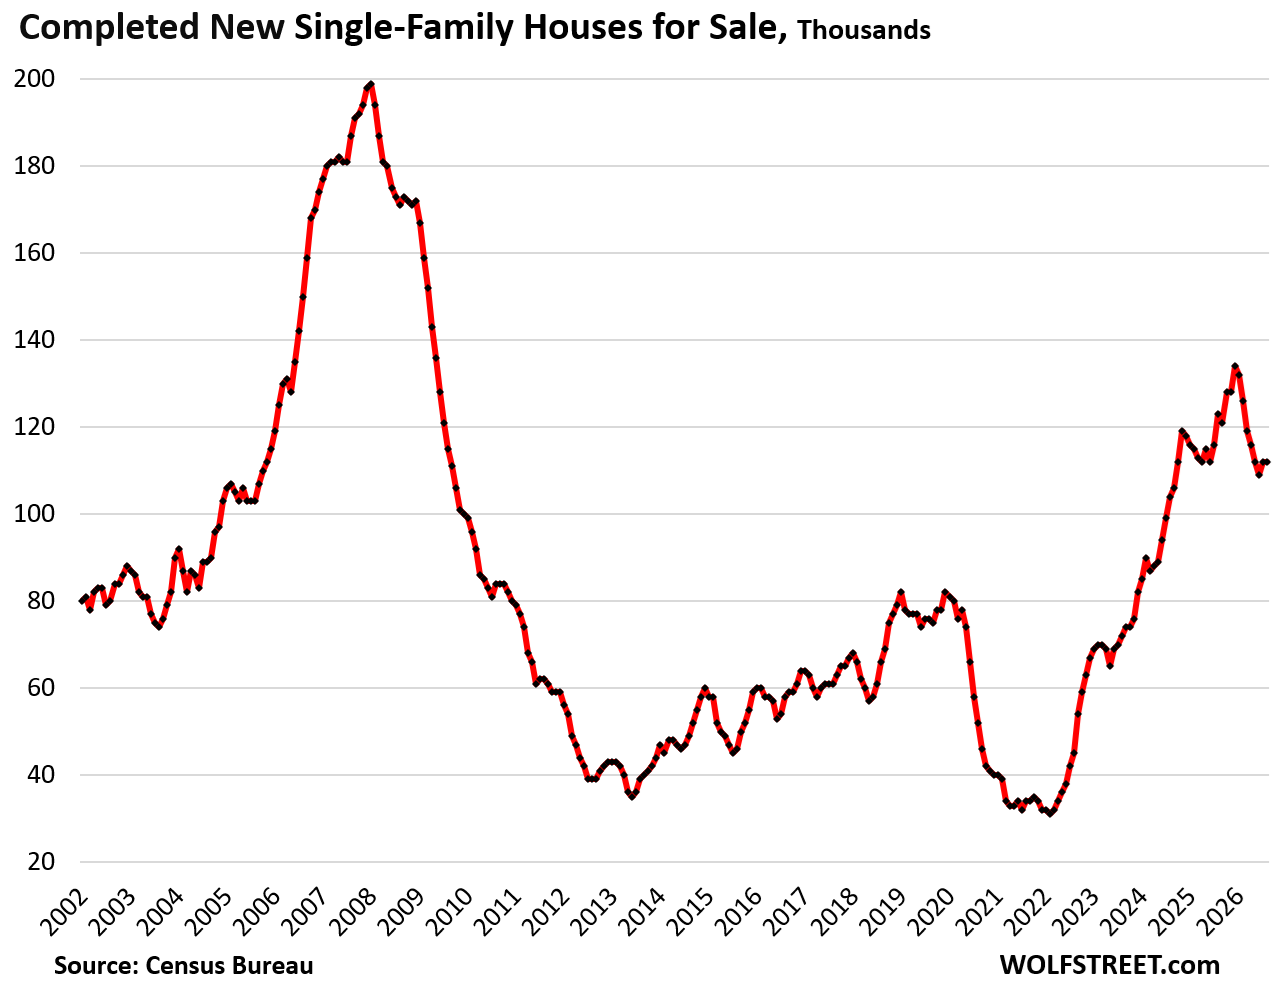
The composition of this inventory is also revealing. Under-construction homes—units that are currently in the pipeline but not yet sold—have seen a year-over-year decline of 5.8%, settling at 261,000 units. This reduction is not necessarily a sign of a cooling construction sector, but rather a reflection of units transitioning into the "completed" category. Completed homes for sale remain steady at 112,000 units, a figure that remains historically elevated compared to the lean years of 2021 and 2022.
Historical Context and the End of FOMO
To understand the current environment, one must look back to the post-pandemic period of 2021 and 2022. During that interval, ultra-low mortgage rates—often dipping below 3%—fueled a "Fear Of Missing Out" (FOMO) phenomenon. Buyers, fueled by cheap credit, aggressively bid up home prices, allowing builders to maintain record-high margins.
However, the rapid tightening of monetary policy by the Federal Reserve, which began in 2022 to combat inflation, fundamentally altered the borrowing landscape. As mortgage rates climbed, the pool of qualified buyers shrank, leaving builders with massive amounts of capital tied up in "spec homes"—properties built without a pre-sold contract. Today, the market is no longer a seller’s paradise. Builders are now forced to absorb the costs of mortgage-rate buydowns and other financial incentives, which effectively lowers the net revenue per home sold.
Corporate Adjustments: The Lennar Case Study
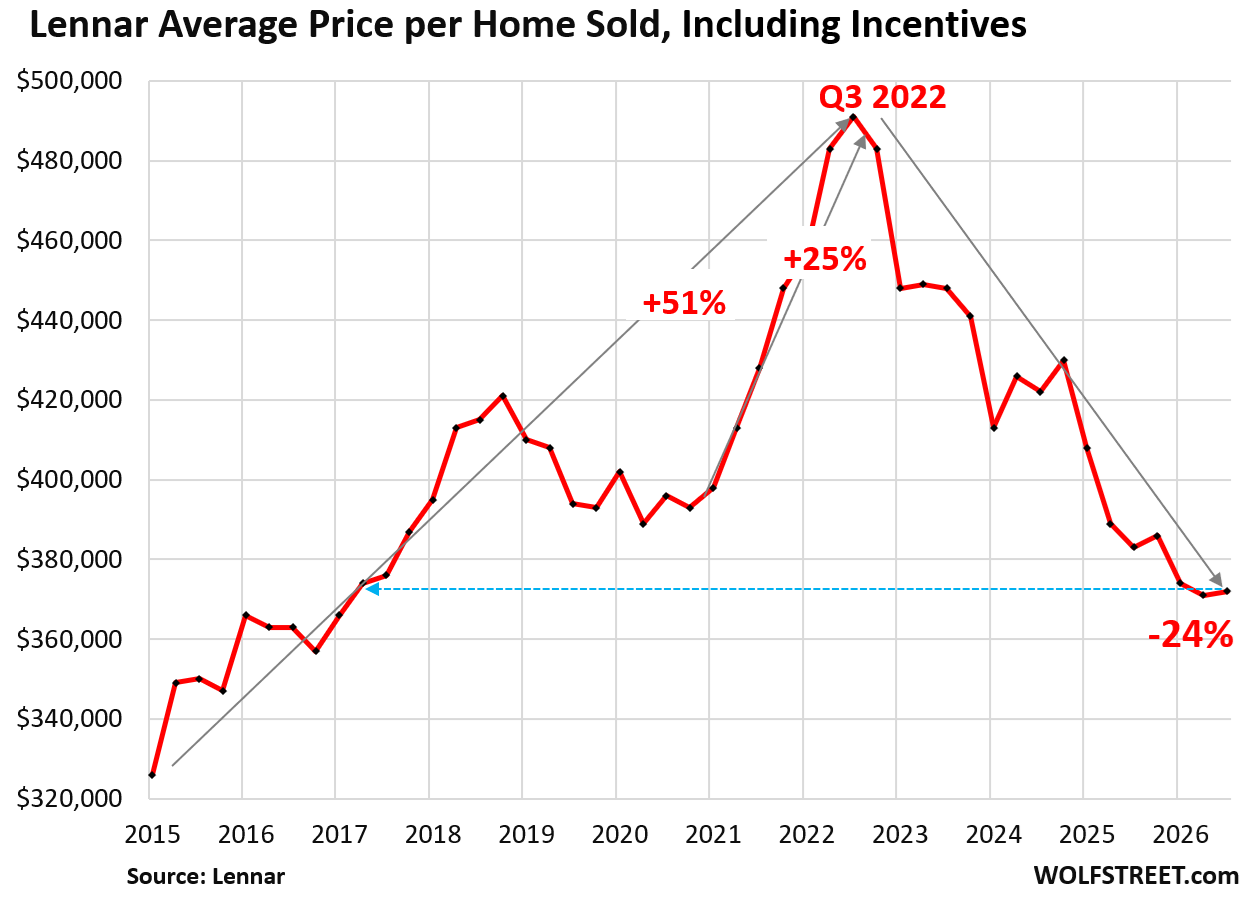
Major homebuilders have been forced to acknowledge this new equilibrium. Lennar, one of the nation’s largest developers, has been particularly aggressive in adjusting its business model to match the reality of a demand-constrained market. The company’s financial disclosures provide a granular look at the correction: as of the third quarter of 2026, the average selling price for a Lennar home has plummeted by 24% from its peak in late 2022, reaching $372,000.
The compression of gross margins is equally telling. Lennar reported a gross margin of 15.8% for Q3 2026, a significant decline from the 29.2% margin recorded during the peak period of Q3 2022. This shift demonstrates the high cost of maintaining sales momentum in a high-interest-rate environment. Investors have responded to these narrowing margins and shifting sales strategies by pushing builder stocks down, with some major developers seeing their share prices retract significantly from their 2024 highs.
Pricing Trends and the "Hidden" Discounts
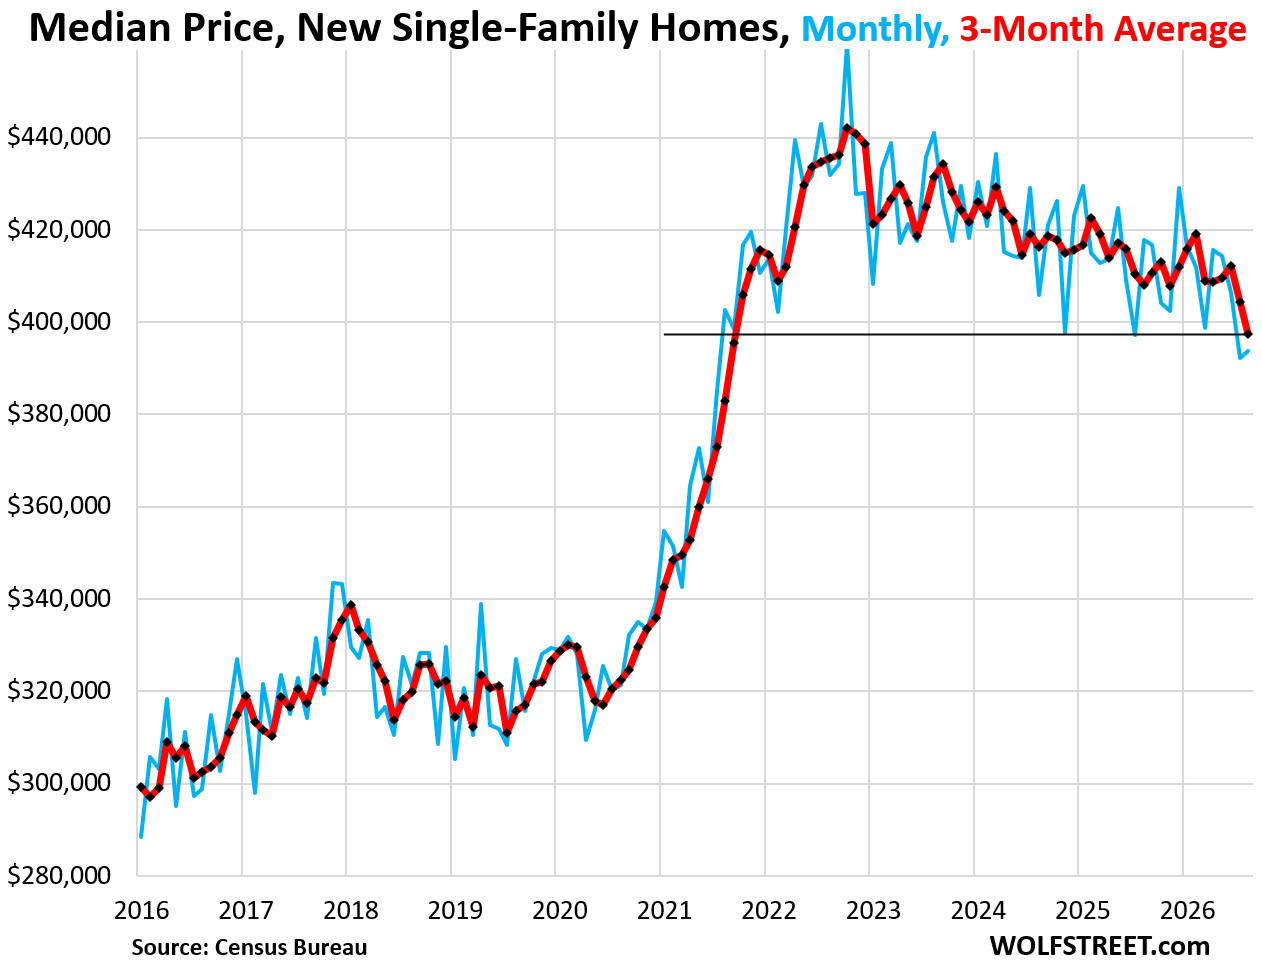
Official government data on the national median price of new single-family homes often fails to capture the full scope of these market adjustments. While the median price reached $393,700 in August—a 14% decline from the October 2022 peak—this figure represents the base contract price. It does not account for the extensive "hidden" discounts builders are offering, such as interest rate buydowns that can save a buyer thousands of dollars over the life of a loan.
When observing the three-month moving average of new home prices, a clearer picture emerges: prices are at their lowest point since September 2021. This downward trend confirms that the era of aggressive price appreciation has ended, replaced by a period of price discovery and competitive incentives designed to lure buyers back to the table.

Regional Variations in Supply and Demand
The supply-demand imbalance is not uniform across the United States. Regional data from the Census Bureau reveals distinct pressures:
- The South: This region remains the most active, yet it faces the most significant inventory glut. With 291,000 units currently available, inventory levels have returned to their 2006 peak. However, sales in the South are down 35% from those same levels, signaling a major disconnect between developer output and regional absorption rates.
- The West: Inventory in the West has climbed to 105,000 units, a 21% increase since 2019. Despite this rise in supply, sales have plunged by 40% over the same timeframe. The West is currently seeing the most dramatic manifestation of the supply-demand mismatch.
- The Midwest: Inventory has reached 58,000 units, the highest level since 2008. This 57% increase from 2019 levels highlights a trend of inventory accumulation that has outpaced regional population growth or buyer interest.
- The Northeast: While inventory is up 18% from 2019 levels, the market remains smaller for single-family homes due to a higher concentration of multi-family developments. Nevertheless, the trend mirrors the national pattern of rising supply against stagnant demand.
Broader Implications for the Economy
The current state of the housing market carries profound implications for the broader U.S. economy. For years, the construction sector was a key engine of economic growth. As builders pull back to manage their inventory, the contribution of residential investment to GDP is likely to face headwinds.
Furthermore, the "housing shortage" myth, which was used to justify the rapid escalation of real estate prices during the post-COVID recovery, is being dismantled by the data. The reality is that the market is currently oversupplied, not undersupplied, when viewed against current purchasing power.
For prospective buyers, this represents a shifting landscape. The transition from a seller’s market to a buyer’s market is rarely smooth, but the current data suggests that the power balance is tilting toward those with the capital to purchase. For the homebuilding industry, the next few quarters will be a test of efficiency and financial discipline. As builders attempt to shed existing inventory, the market can expect continued price volatility and a sustained reliance on incentives to clear the pipeline.
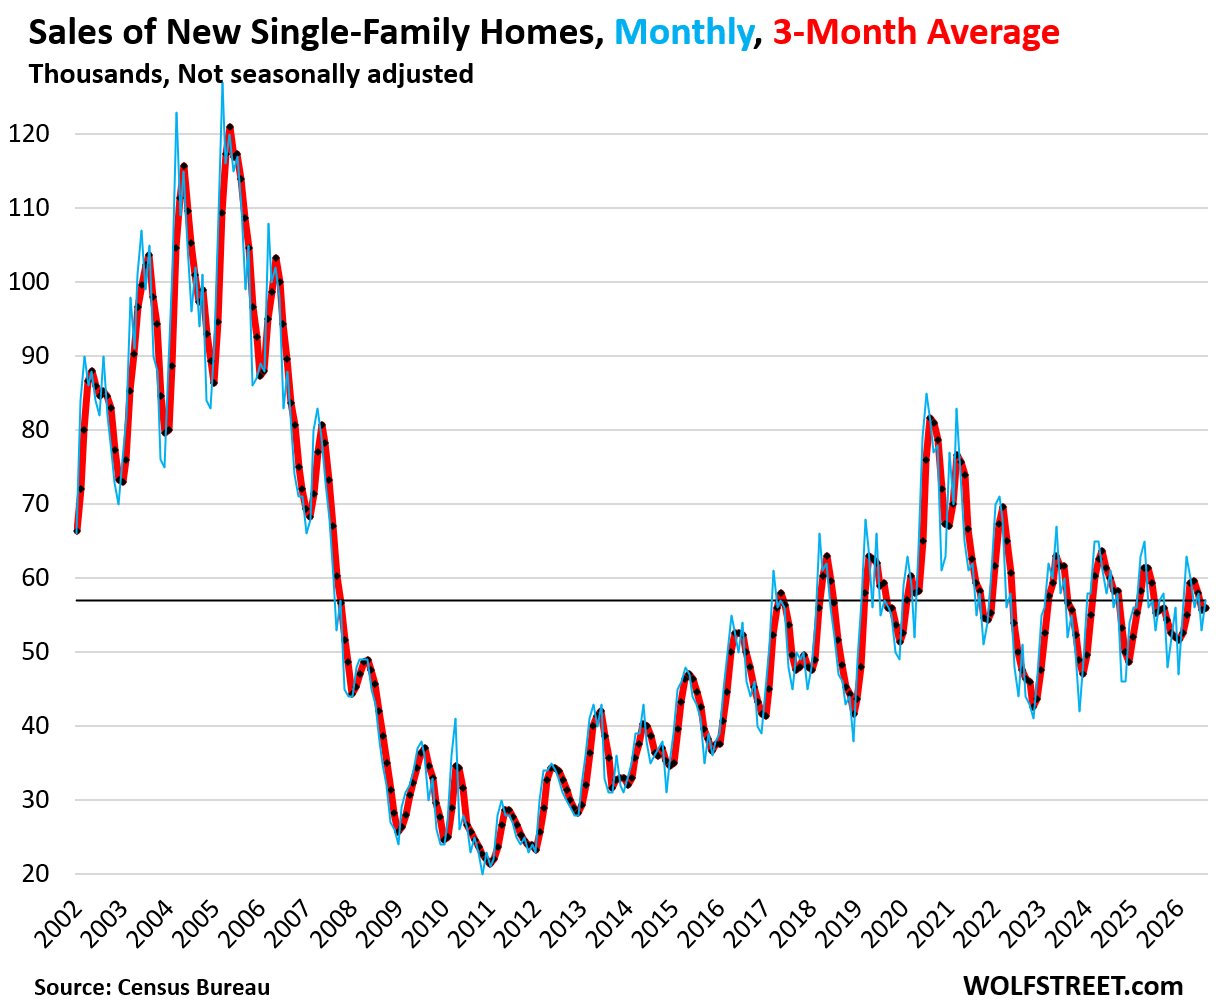
As of late 2026, the data remains consistent: inventory is at its highest point in nearly two decades, while sales volume remains stuck at 2019 levels. This gap serves as a reminder that market fundamentals—specifically interest rates and affordability—will always supersede the narrative of structural scarcity. The "Housing Shortage" is effectively a relic of the low-interest-rate era, and as the market adjusts to the current economic reality, the focus is shifting from "how much can we build" to "who can afford to buy."