The Rising Cost of Debt: How Interest Rates Became the Primary Driver of the United States Fiscal Deficit and Market Volatility

The contemporary debate surrounding the United States national deficit frequently centers on two primary pillars: entitlement programs and defense spending. While these categories represent significant portions of the federal budget, a more granular analysis reveals that the single largest driver of America’s deteriorating fiscal health is no longer legislative spending choices, but the cost of borrowing itself. Following the massive, pandemic-related deficits of 2020 and 2021, the shift in the interest rate environment has transformed the federal debt into a self-compounding burden that threatens to overshadow traditional policy-driven expenditures.

In 2021, the federal government paid approximately $482 billion in interest on a total debt stock of $28.4 trillion. At that time, the average effective interest rate sat at a historically low 1.70%. However, as the Federal Reserve aggressive hiked rates to combat inflation, the landscape shifted dramatically. For the current fiscal year, the interest on federal debt is projected to reach a staggering $1.35 trillion. This increase is driven by an average effective rate that has climbed to approximately 3.44%. In essentially three years, the cost of servicing the national debt has more than doubled, not because of a sudden surge in new social programs, but because the interest rate applied to a rapidly growing stock of debt has surged.
The Interest Rate Trap and the Debt-to-GDP Ratio
To understand the severity of the current fiscal trajectory, economists often look at a hypothetical scenario in which interest rates remained at their 2021 levels. Had the average effective rate stayed near 1.70%, today’s annual interest expense would be roughly $650 billion—nearly half of the current $1.35 trillion figure. This $684 billion difference represents a "fiscal penalty" that is purely the result of the higher rate environment rather than specific legislative actions or deficit-spending programs.

The compounding effect of these higher rates is profound. Lower interest costs would have resulted in smaller annual deficits, thereby reducing the amount of new debt the Treasury would need to issue to cover those costs. Under the low-rate scenario, the total federal debt would currently stand at approximately $36.0 trillion rather than the actual $39.2 trillion. More importantly, the debt-to-GDP ratio—a key metric of a nation’s fiscal sustainability—would be approximately 109.4%. Instead, the current reality has pushed that ratio to 119.2%. For historical context, the debt-to-GDP ratio stood at 107% immediately prior to the pandemic, indicating that the interest rate environment has been more damaging to the national balance sheet than the emergency spending of 2020.
Market Analysis: Technical Divergence and the 50-Day Moving Average
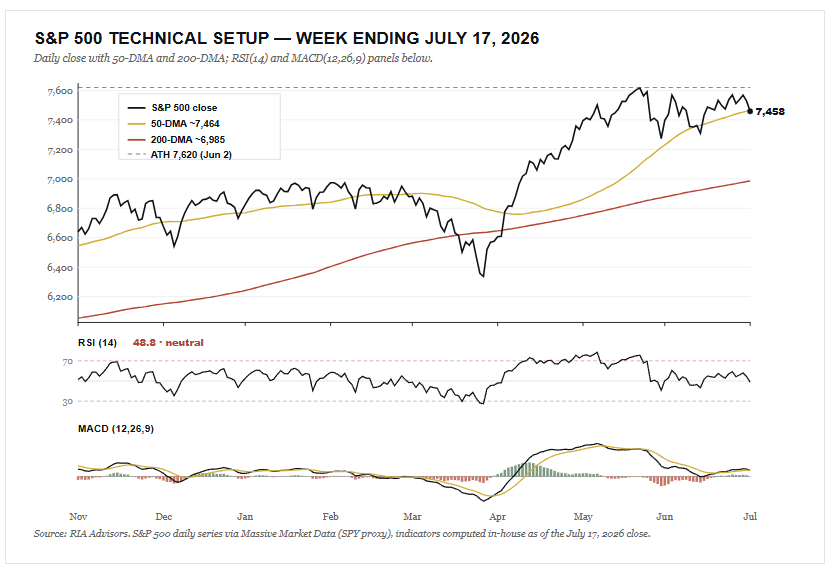
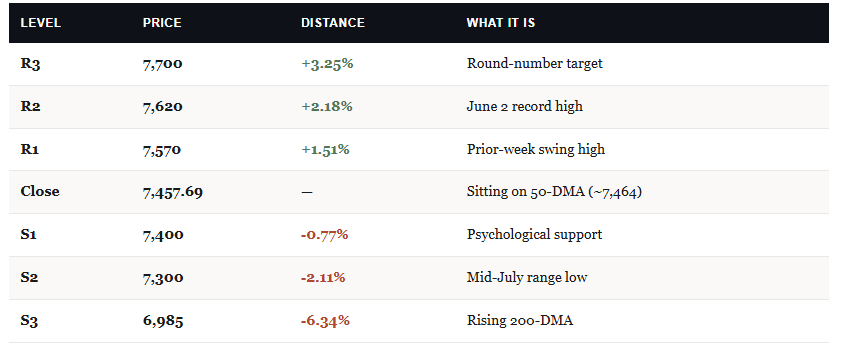
The fiscal instability at the federal level is mirroring a period of technical uncertainty in the equity markets. As of the most recent weekly close, the S&P 500 ended at 7,457.69, positioning it directly on its 50-day moving average of 7,464. This "dead flat" position against a key technical level suggests a market at a crossroads. While the primary uptrend remains intact—the index still sits roughly 6.8% above its 200-day moving average of 6,985—the short-term momentum has shown signs of exhaustion.

Technical indicators currently present a mixed picture for traders. The 14-day Relative Strength Index (RSI) is reading 48.8, which is neutral and suggests the market is neither overbought nor oversold. However, the Moving Average Convergence Divergence (MACD) has recently rolled below its signal line for the first time since April, with the histogram flipping into negative territory. While a single bearish crossover is not a definitive sell signal, it serves as a warning of a building correction.
A notable divergence has emerged between the broad index and specific factors. The Momentum ETF (MTUM) fell approximately 6% over the last week, showing significantly more weakness than the broader market. Conversely, the equal-weight S&P 500 and the Russell 2000 have held up better, with the equal-weight index even tagging a fresh record high mid-week. This suggests that the current market damage is narrow, concentrated in high-beta and large-cap momentum names rather than the median stock.
The Week Ahead: Corporate Earnings and Economic Indicators
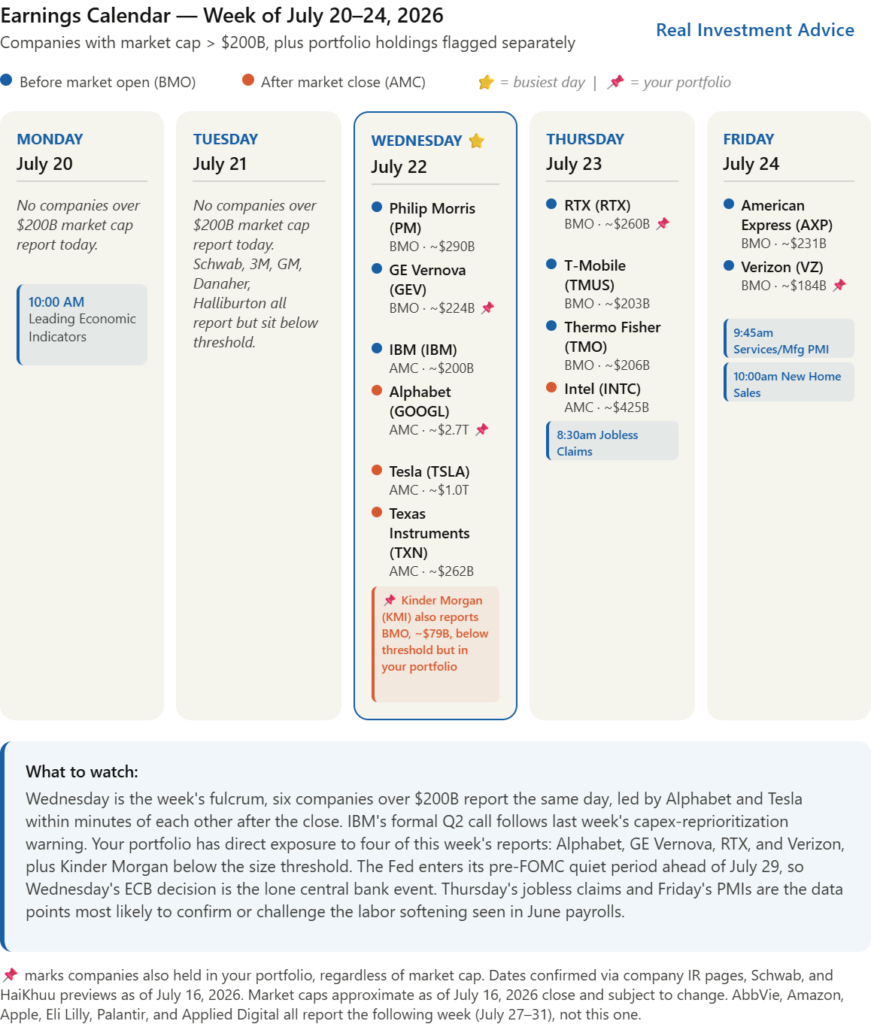
The financial markets are entering a critical window as Q2 earnings season enters its most intensive phase. Major technology and industrial players are scheduled to report, which will provide a clearer picture of corporate health amidst high borrowing costs.
Corporate Reporting Schedule:
- Wednesday: Alphabet and Tesla are the headline acts, reporting after the closing bell. They are joined by Philip Morris, Texas Instruments, and IBM. The IBM report is of particular interest following the company’s recent preliminary warning regarding capital expenditure reprioritization, which had previously rattled investor confidence.
- Thursday: Intel and RTX (formerly Raytheon Technologies) will release their results, providing insights into the semiconductor and defense sectors.
- Friday: American Express closes out the week, offering a look at consumer spending patterns and credit health.
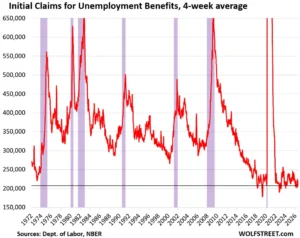
On the economic front, the data calendar is relatively light but contains high-impact releases. Thursday’s initial jobless claims will be scrutinized for signs of labor market softening, following a tepid June payrolls report. On Friday, new home sales data will be released, providing a benchmark for how elevated mortgage rates are impacting the housing sector’s recovery. Furthermore, the Federal Reserve has entered its traditional "quiet period" ahead of the July 29 FOMC meeting, meaning no public speeches from Fed officials will be available to guide market expectations.
The Housing Affordability Paradox
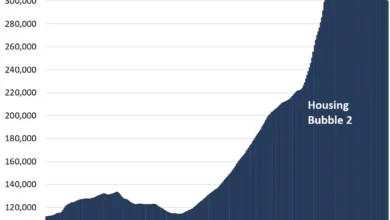
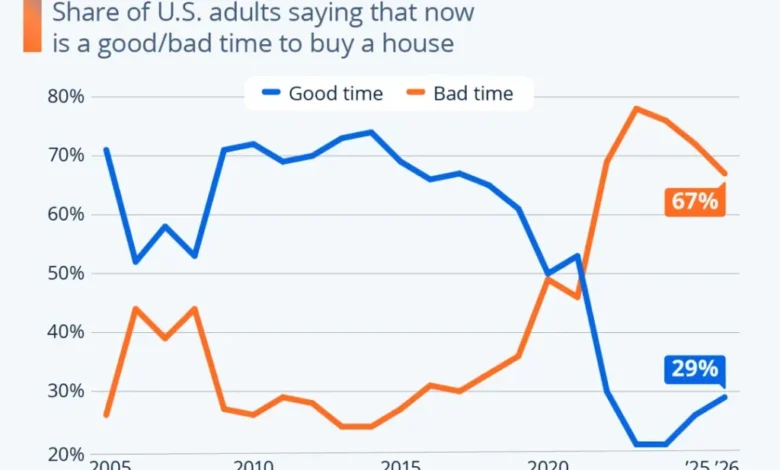
Public perception of the housing market has reached a nadir, with Gallup reporting that two out of three Americans believe it is a "bad time" to buy a home—the most negative sentiment in the survey’s history. This sentiment is fueled by the fact that the median listing price has jumped 34% since 2019 to roughly $430,000, while monthly payments on median homes have nearly doubled from $1,700 in 2020 to over $3,100 today.

However, some analysts argue that the "affordability crisis" narrative is more nuanced than headlines suggest. When adjusting for the metrics that govern monthly payments relative to long-term income growth, some data suggests that buying a home in certain regions remains more accessible than it was for previous generations during periods of double-digit interest rates in the 1980s. While the "rate shock" of the last five years is undeniably real, the impact is highly localized. The current frustration among younger generations is often directed at the "Boomer" generation, yet the underlying issue remains a combination of restricted supply and the rapid transition from a zero-interest-rate policy (ZIRP) to a more normalized, albeit painful, rate environment.
Broader Impact and Fiscal Implications
The shift from a low-interest-rate regime to the current environment has significant implications for future U.S. policy. As interest payments consume a larger share of the federal budget, "crowding out" becomes a legitimate concern. When the government must allocate $1.35 trillion annually just to service existing debt, there is less fiscal space for infrastructure, education, or tax reform.
Furthermore, the "rolling over" of debt presents a continuous risk. As older Treasury notes issued at 1% or 2% mature, they must be replaced by new debt issued at current market rates. This ensures that even if the Federal Reserve begins a modest rate-cutting cycle, the average effective rate on the total debt may continue to rise for several years as the legacy low-interest debt is flushed out of the system.
In conclusion, while political rhetoric will continue to focus on discretionary spending and entitlement reform, the data suggests that the interest rate environment is the primary engine of the current deficit expansion. For investors and taxpayers alike, the "50-day line" in the sand for the S&P 500 and the $1.3 trillion interest expense for the Treasury are two sides of the same coin: a global economy finally grappling with the end of cheap money. Success in this new era will require a move away from directional bets and toward rigorous risk rebalancing, as the margin for fiscal and monetary error has become razor-thin.