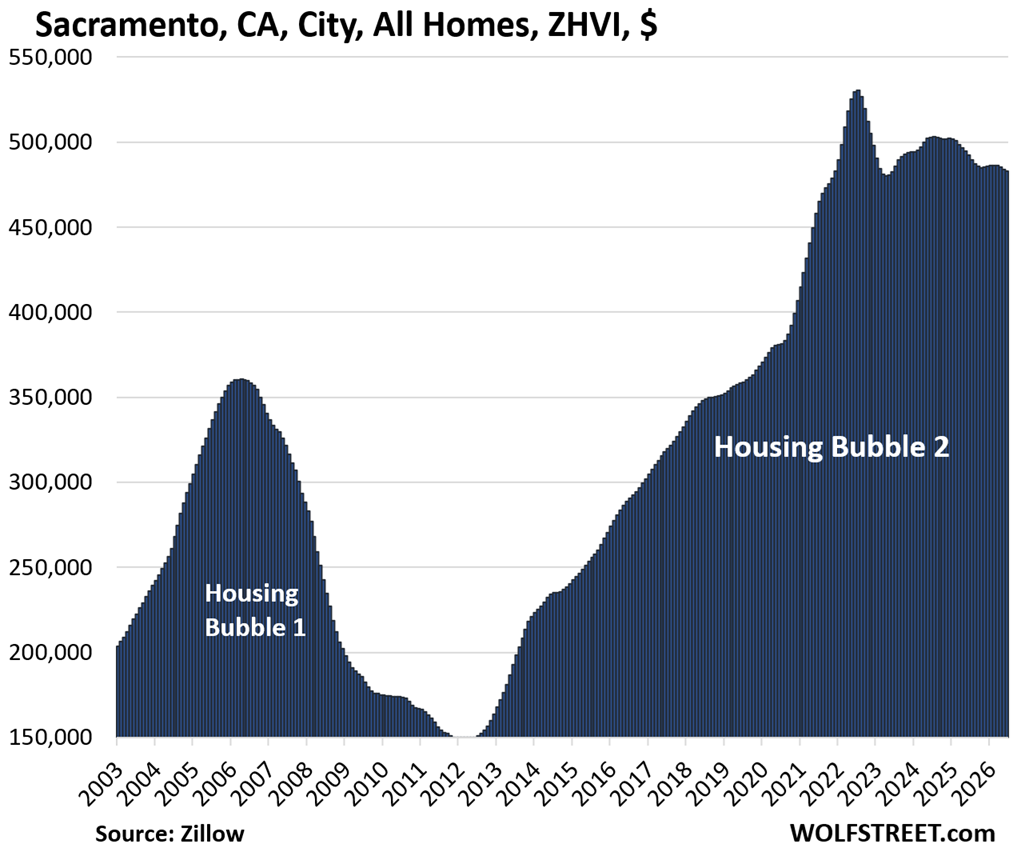
And 28 were down from their peaks in prior years, led by Austin -27% and Oakland -25%.

The United States residential real estate market is currently navigating a significant period of correction and recalibration. According to the latest data for June, mid-tier home prices have retreated from their historical peaks in 28 of the 33 major metropolitan areas tracked in recent market analyses. This downturn is most pronounced in formerly high-flying markets such as Austin, Texas, where prices have plummeted by 27%, and Oakland, California, which has seen a 25% decline from its previous valuation zenith. These figures, which are seasonally adjusted, represent a broader trend of cooling in the wake of the unprecedented price inflation experienced during the early 2020s.
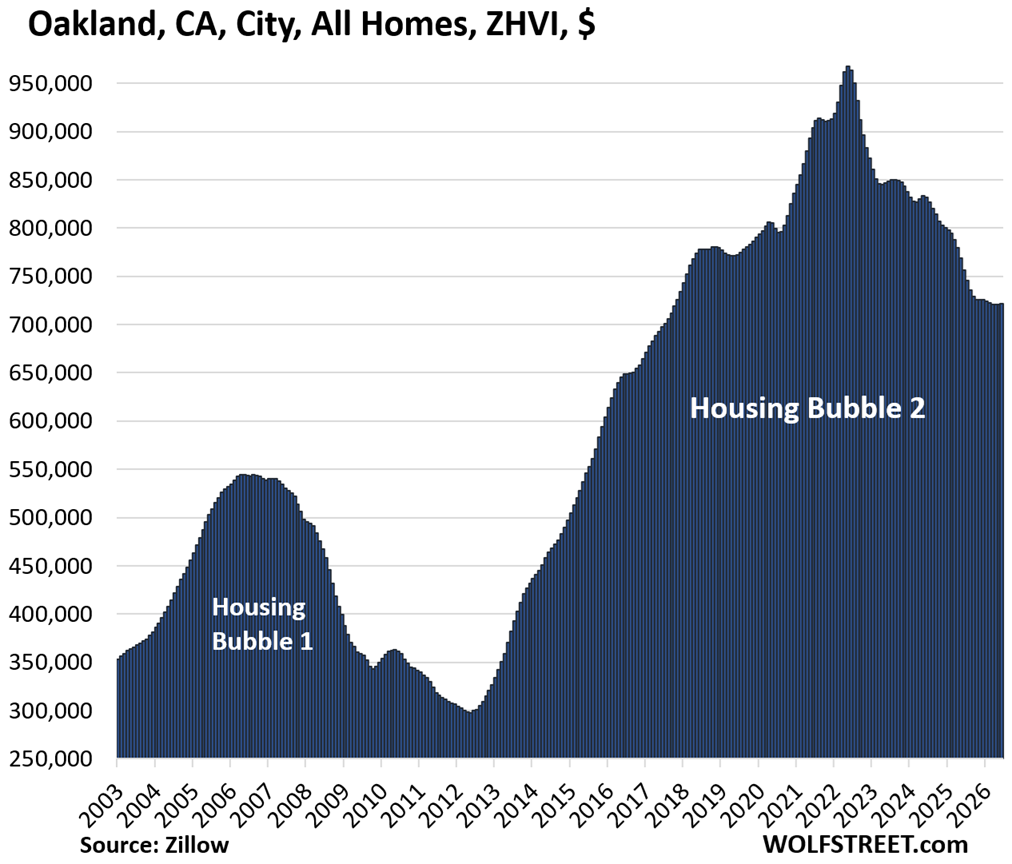
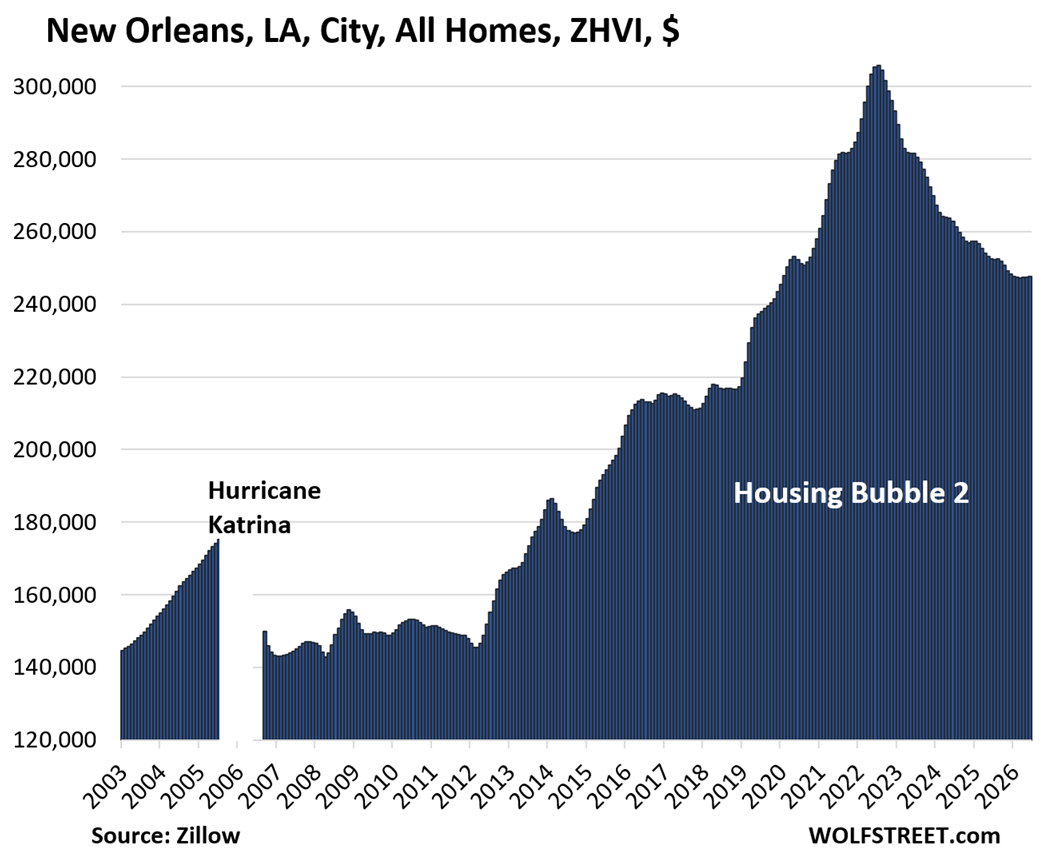
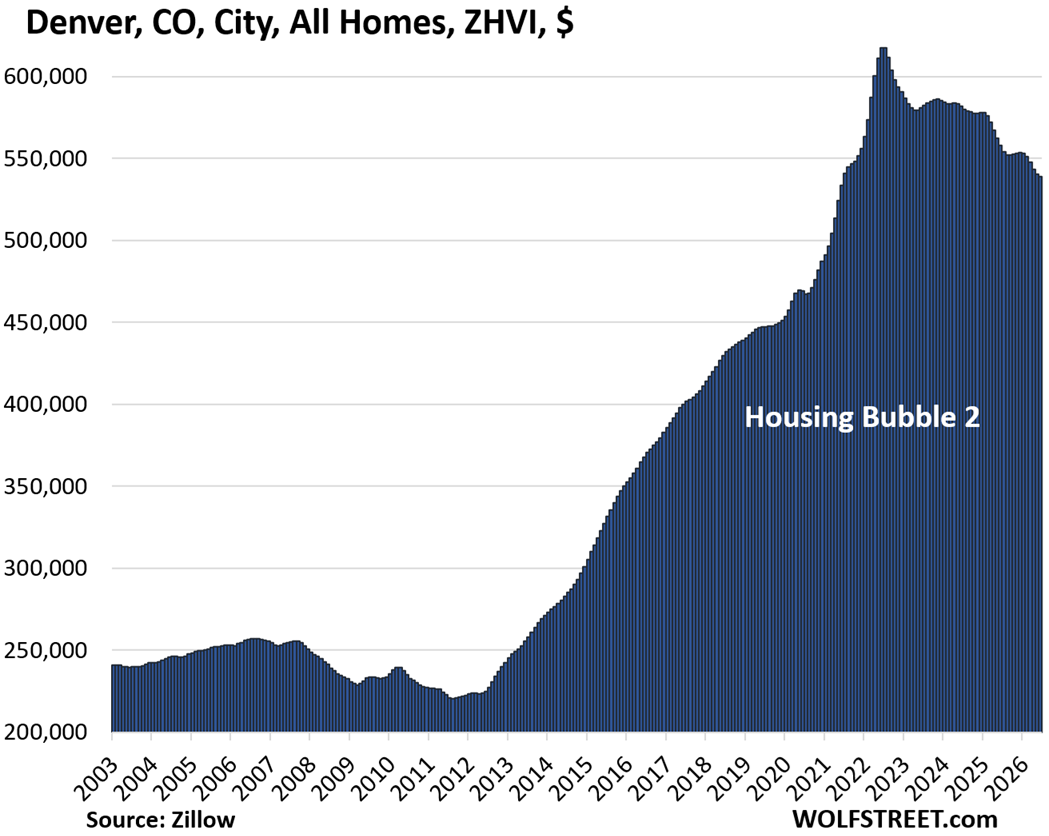
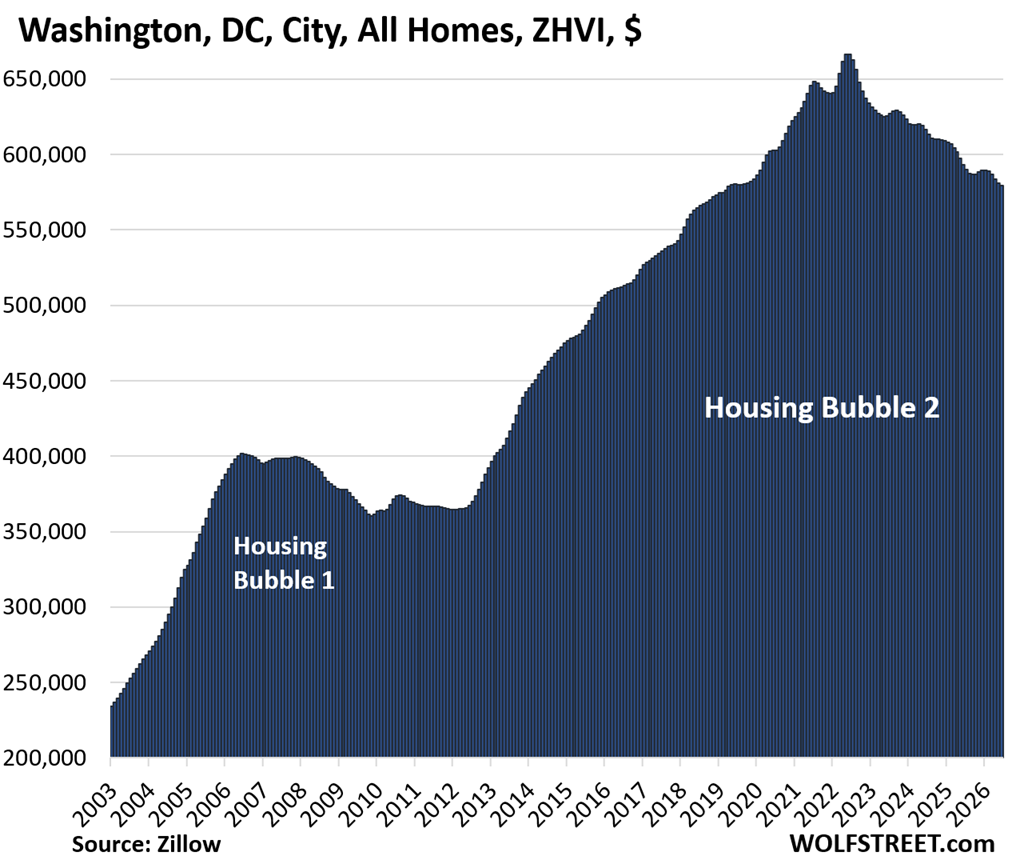
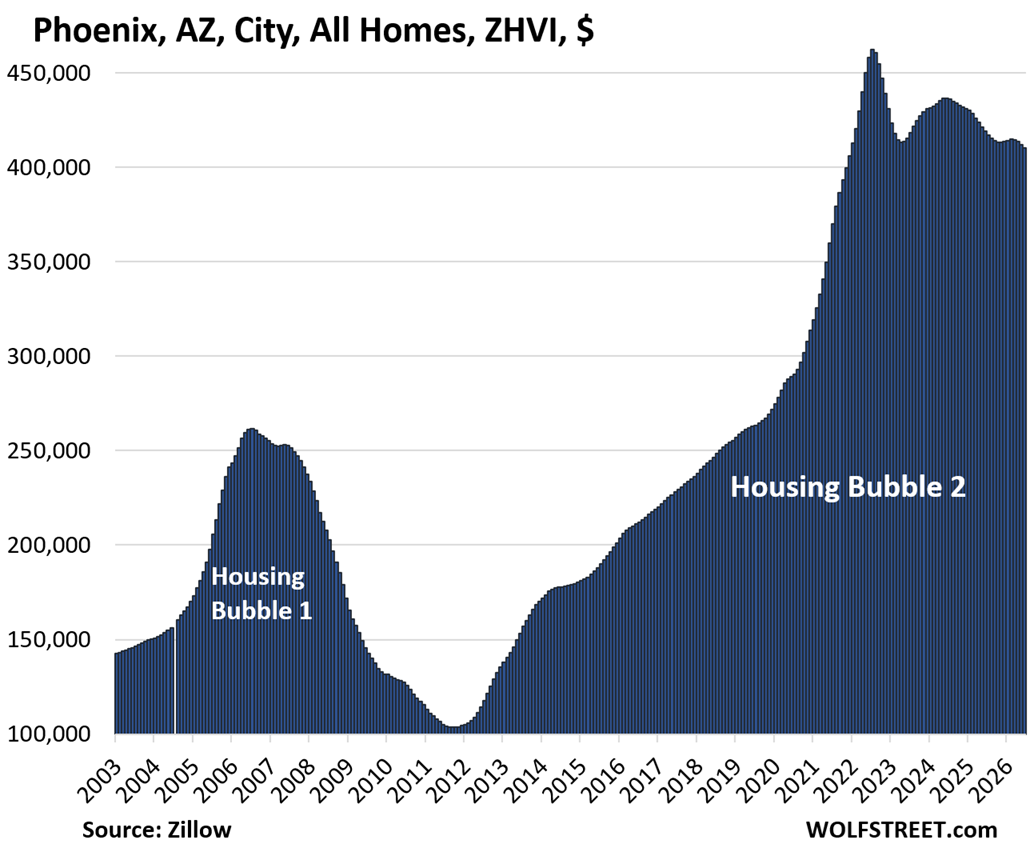
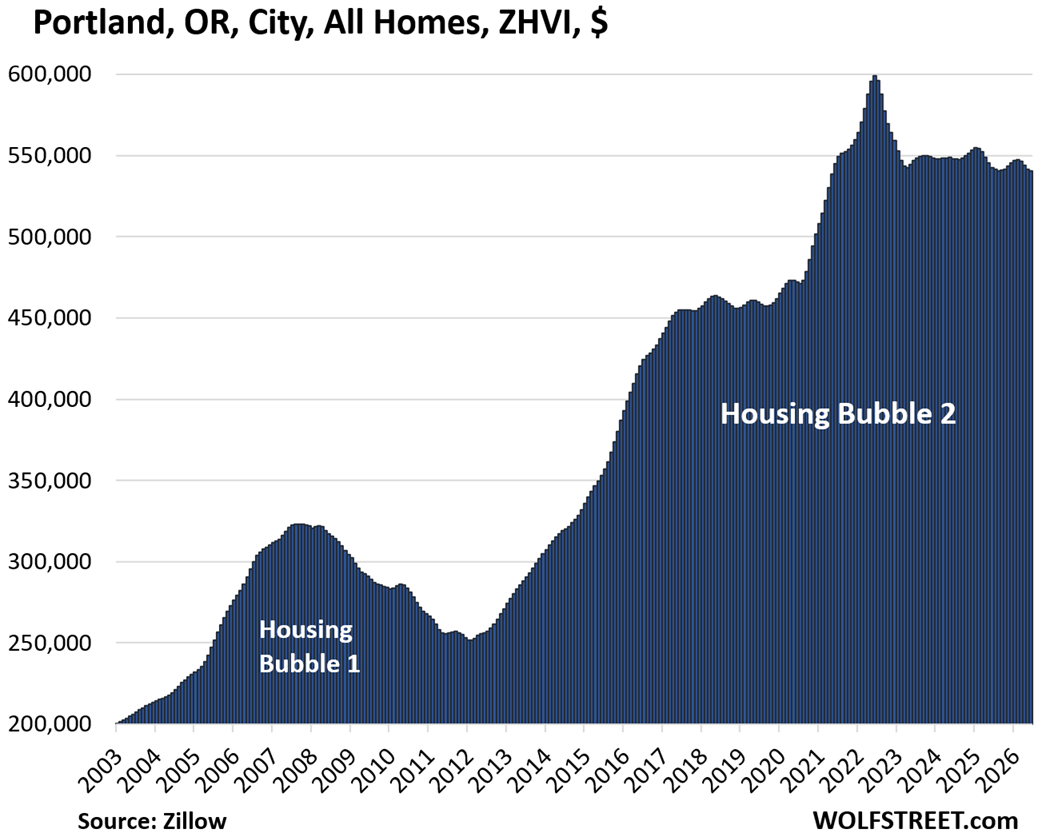
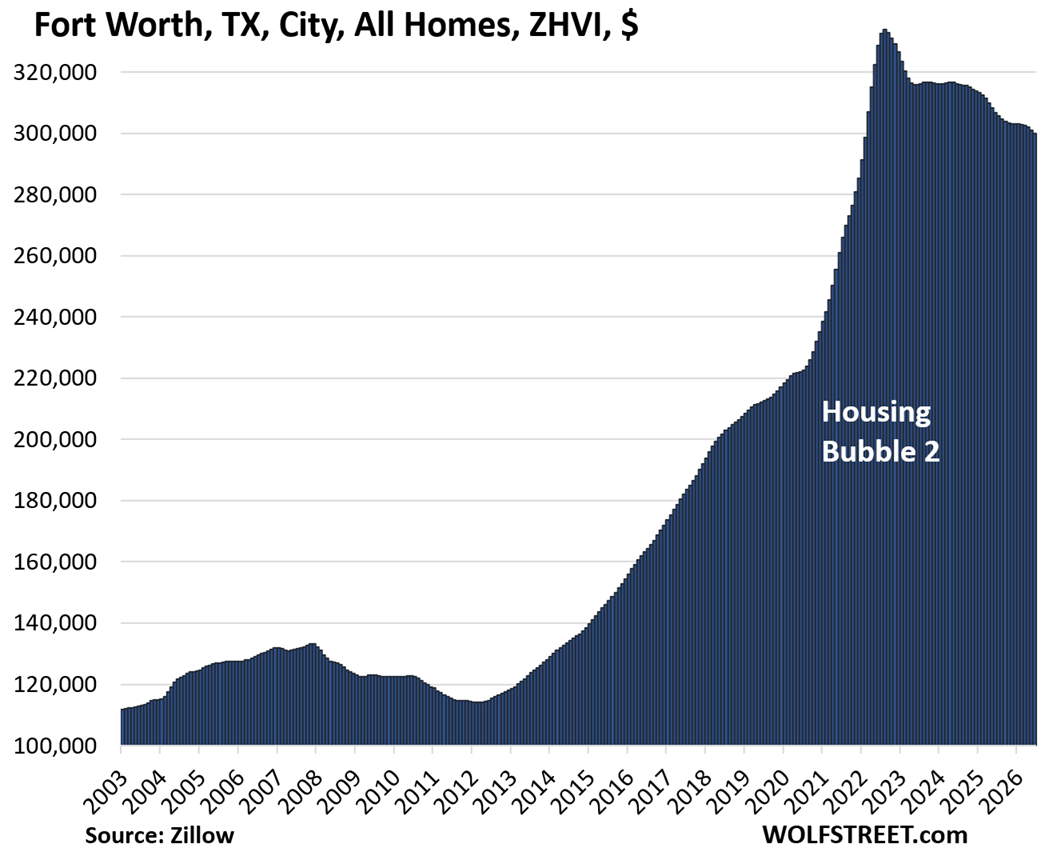
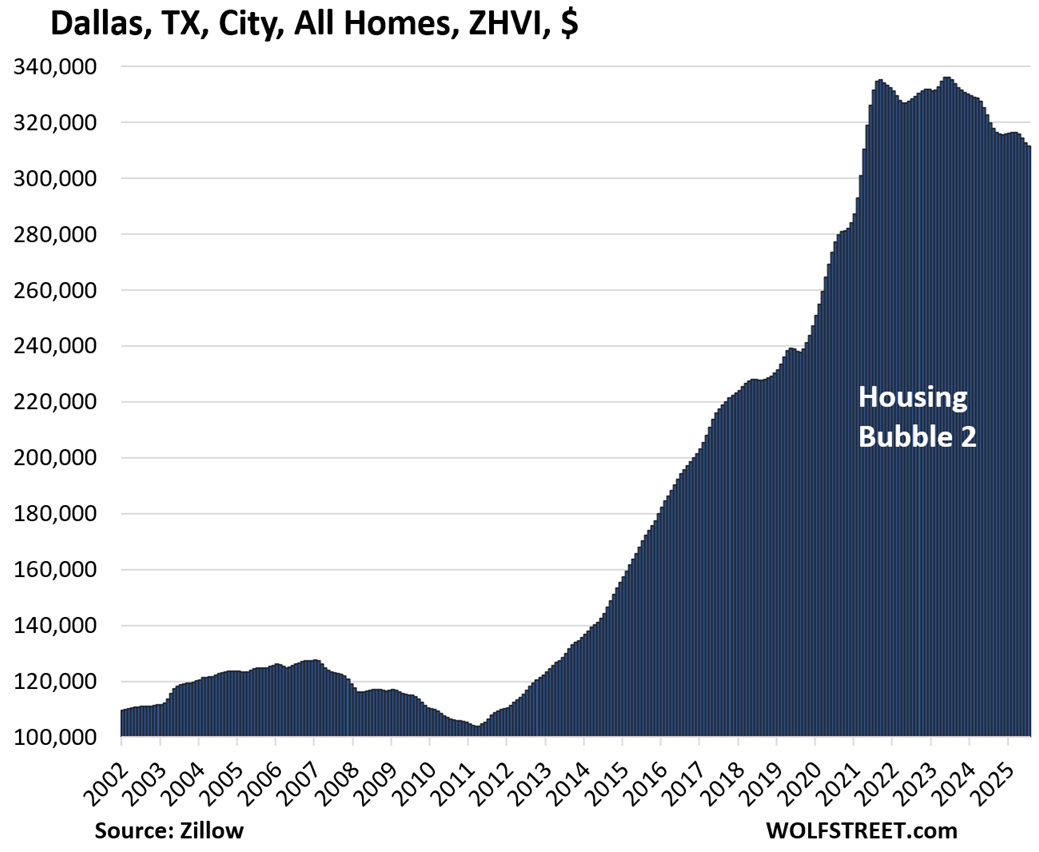
The mid-tier segment, defined as the middle third of the market by price, serves as a critical barometer for the health of the broader housing economy. While the national narrative often focuses on median prices, the performance of mid-tier homes in specific high-cost cities provides a clearer picture of the challenges facing average homeowners and prospective buyers. In addition to Austin and Oakland, several other major cities have reported double-digit declines from their respective peaks, including New Orleans (-19%), Washington D.C. (-13%), Denver (-13%), and Phoenix (-11%). Both Fort Worth and Portland have recorded 10% drops, signaling that the correction is not localized to a single region but is a widespread phenomenon affecting diverse geographic markets.
A Chronology of the Market Peak
To understand the current trajectory of home prices, it is essential to examine the timeline of when these markets reached their highest points. The peak of the U.S. housing bubble was not a singular event but rather a staggered series of local summits. In 17 of the 33 cities analyzed, home prices reached their all-time highs in 2022, a year characterized by the tail-end of the pandemic-era buying frenzy and the beginning of the Federal Reserve’s aggressive interest rate hiking cycle.
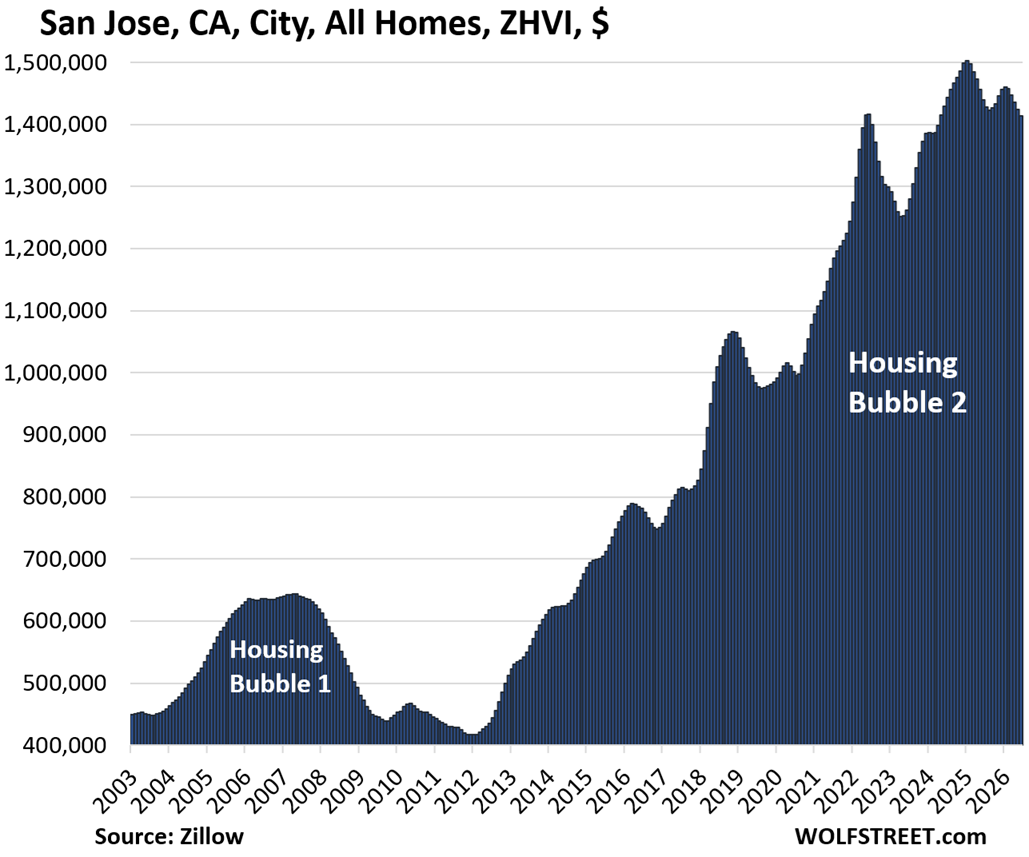
However, the market showed surprising resilience in some areas, with nine cities reaching new peaks as recently as 2024. In a few notable cases, the upward momentum carried into early 2025. For instance, San Jose, California, saw its price peak in January 2025, while Boston, Massachusetts, reached its high point in April 2025. The fact that 28 of these cities are now trading below those levels suggests that even the most persistent bull markets in real estate are finally succumbing to the pressures of high mortgage rates and exhausted affordability.
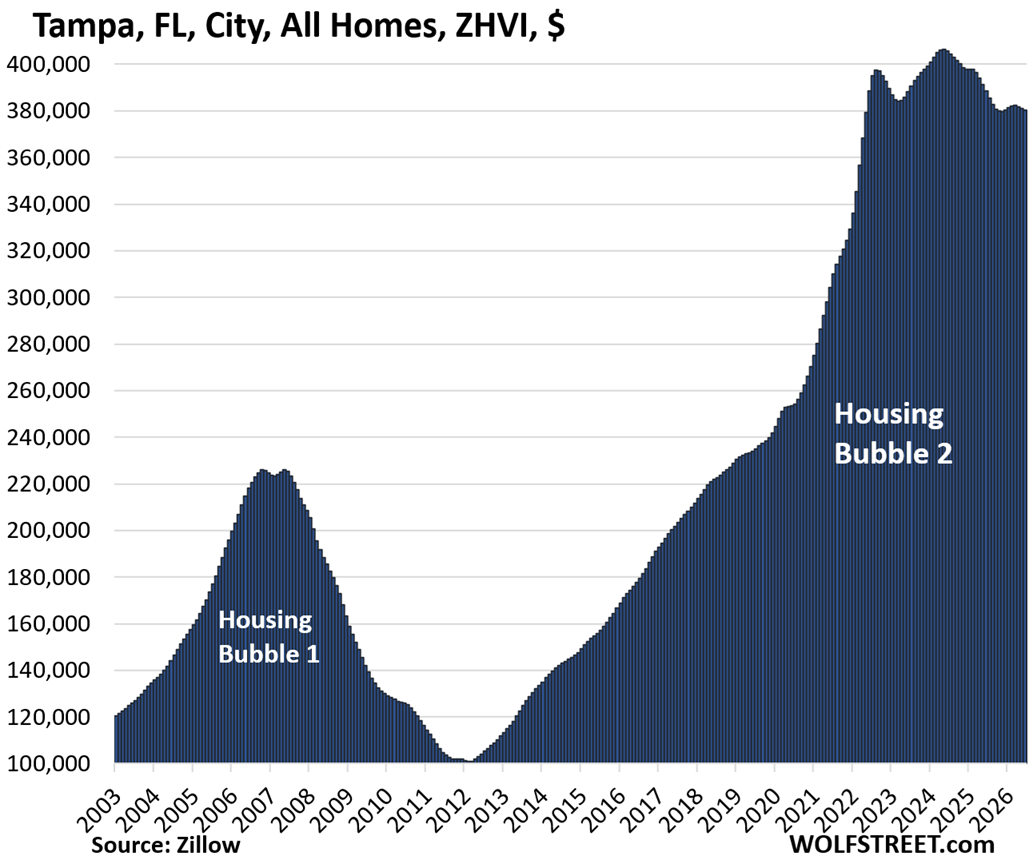
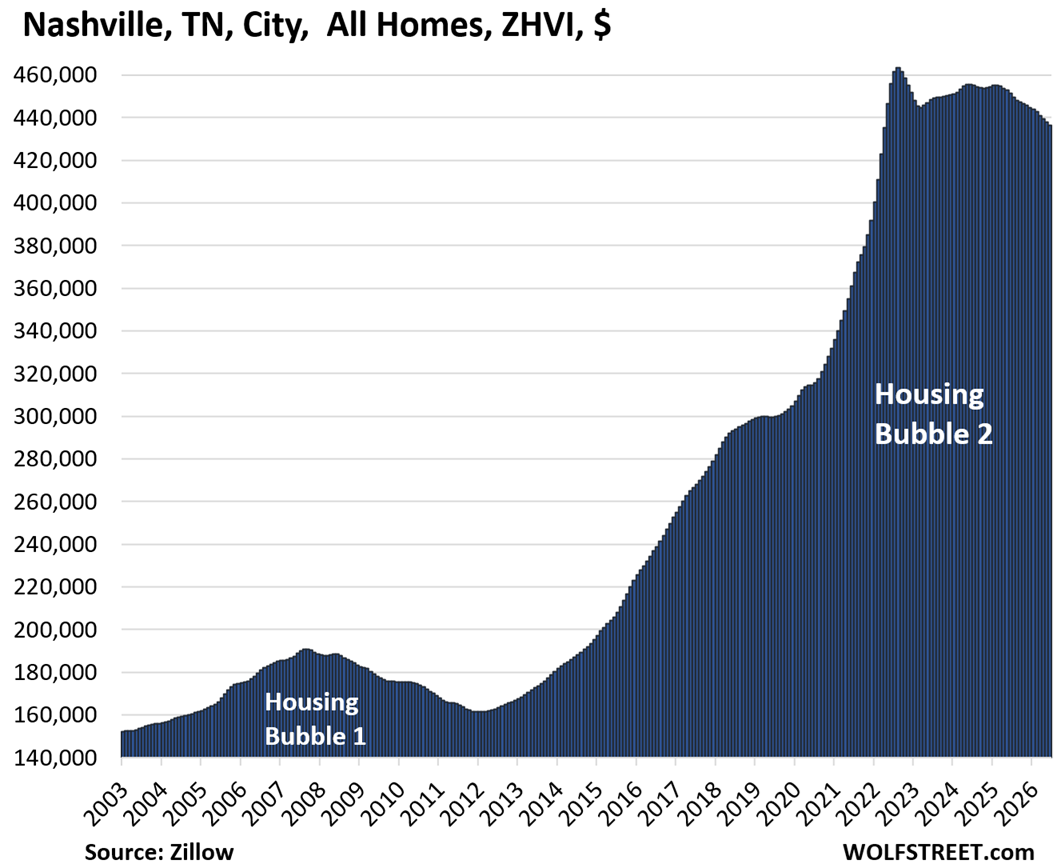
The year-over-year data further underscores this cooling trend. Price declines occurred in 25 of the 33 cities over the past 12 months. Austin again led this category with a 5.0% annual drop, followed by Oakland at 4.6%, Denver at 3.4%, Nashville at 3.3%, and Las Vegas at 3.1%. These figures indicate that the "soft landing" hoped for by many economists is manifesting as a steady, incremental deflation of home equity in many of America’s most prominent urban centers.
The San Francisco Anomaly and the Influence of Artificial Intelligence
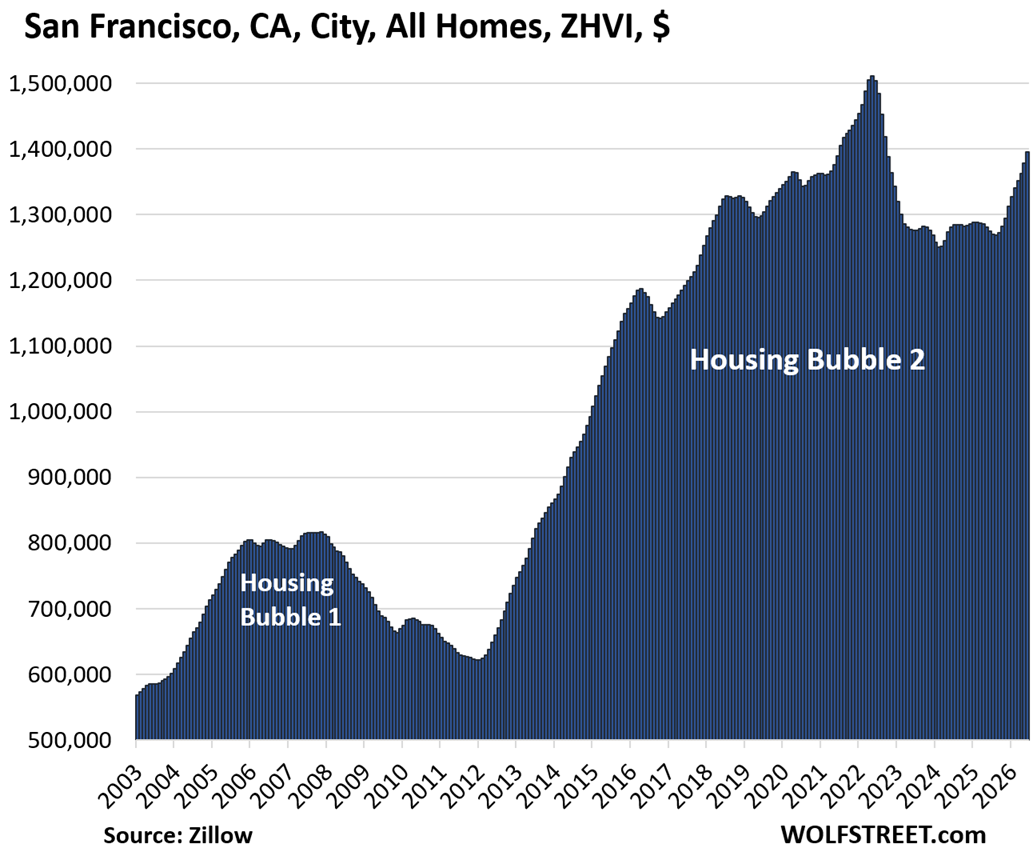
While the majority of the country faces downward pressure, San Francisco has emerged as a startling outlier. Historically one of the first cities to see price retractions during the current cycle, the city has recently experienced a dramatic reversal. Year-over-year, mid-tier home prices in San Francisco have surged by 9.5%. Analysts attribute this localized spike to the "AI mania" currently gripping the technology sector.
The influx of capital into artificial intelligence ventures has created a new wave of wealth, with highly compensated engineers and executives competing for a limited supply of luxury housing. This "mansion shortage" at the top end of the market has effectively trickled down into the mid-tier segment. As luxury inventory vanished, buyers began chasing mid-tier properties, driving prices upward. Despite this recent spike, it is important to note that San Francisco’s mid-tier prices remain 8% below their 2022 all-time highs. Whether this recovery is sustainable or merely a localized bubble driven by sector-specific speculation remains a subject of intense debate among real estate professionals.
In contrast, neighboring San Jose—despite its status as a fellow tech hub—has not shared in this resurgence. Mid-tier homes in San Jose remain among the most expensive in the nation, with a valuation of approximately $1.41 million, slightly eclipsing San Francisco’s $1.39 million. However, San Jose prices fell by 0.7% in June compared to May and are down 1.8% year-over-year. This divergence highlights the volatility and unpredictability of the California coastal markets.
Monetary Policy and the Legacy of "Free Money"
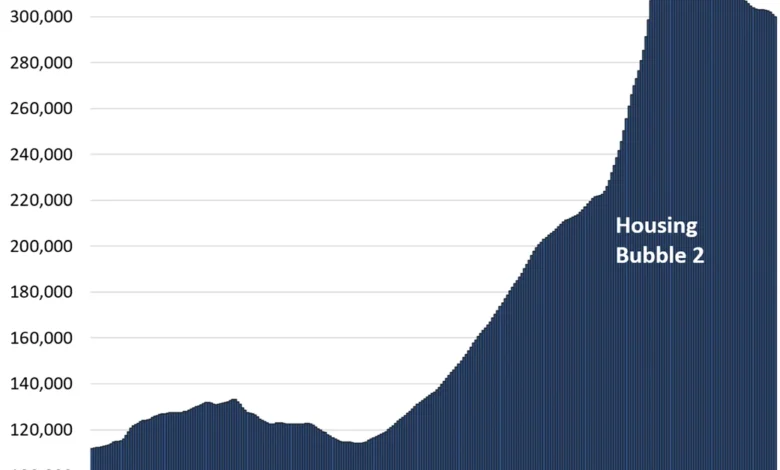
The current correction cannot be viewed in isolation from the monetary policies that preceded it. Between mid-2020 and mid-2022, the U.S. housing market experienced a period of massive price inflation that many economists now describe as artificial. During this two-year window, cities like Austin saw price spikes of 62%, Phoenix rose by 60%, and Fort Worth increased by 50%.
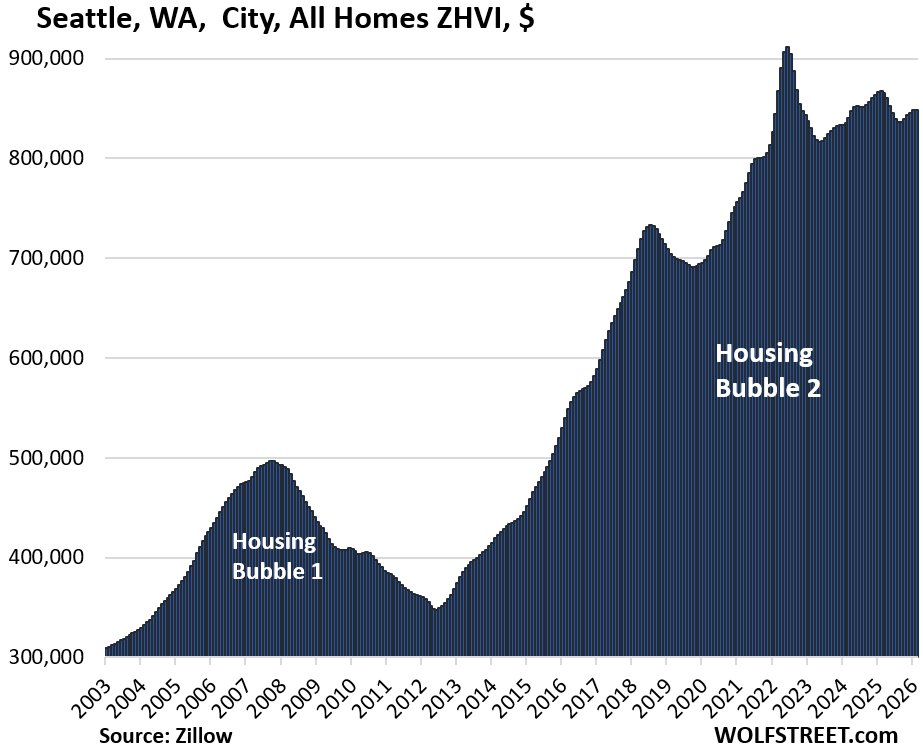
This growth was fueled largely by the Federal Reserve’s decision to maintain near-zero interest rates and engage in large-scale purchases of Treasury securities and mortgage-backed securities (MBS). These actions drove mortgage rates below the 3% threshold at a time when consumer price inflation was climbing toward 9%. The resulting environment created an unprecedented "Fear of Missing Out" (FOMO) among buyers, who took on massive debt to secure properties before prices rose further.
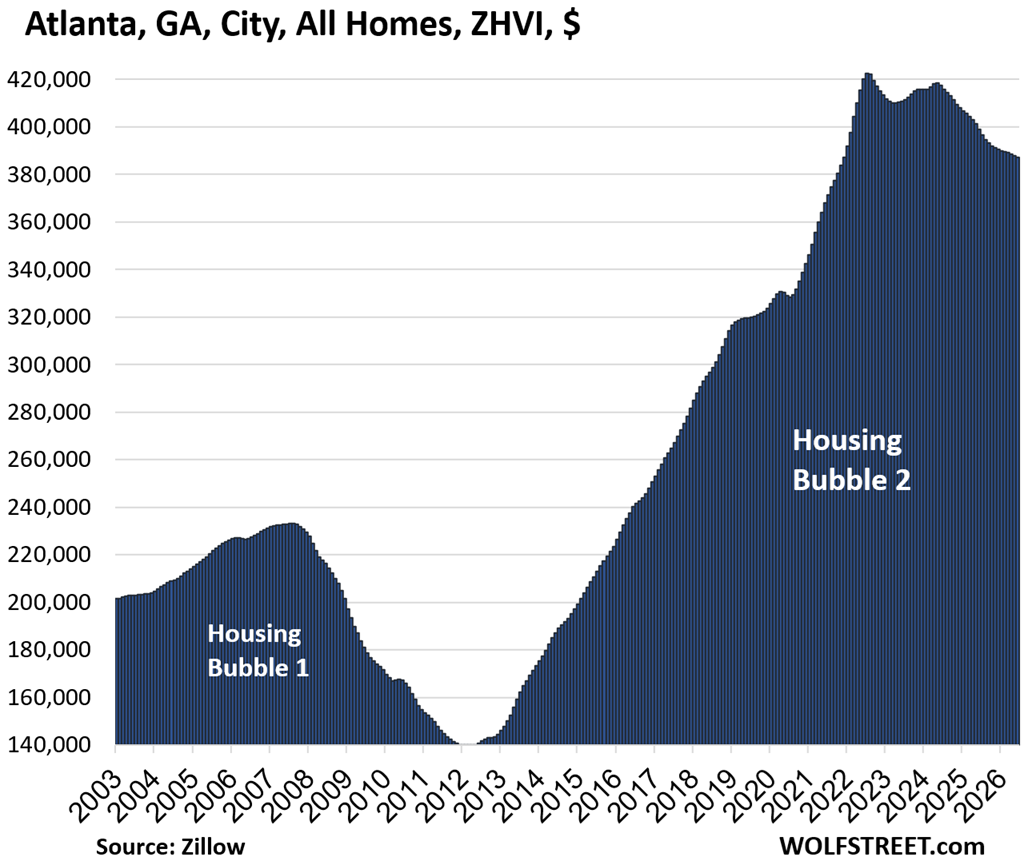
As the Federal Reserve shifted its stance to combat inflation, raising the federal funds rate and ending its MBS purchase program, mortgage rates surged. This transition effectively ended the era of "free money" and introduced a "lock-in effect," where homeowners with low-interest mortgages became reluctant to sell, leading to a freeze in market activity. However, as inventory has slowly begun to climb—with single-family home supply recently hitting a 10-year high—the lack of demand at current price points is forcing the downward adjustments seen in the June data.
Resilience in the Midwest and Northeast
Not all markets are retreating. Chicago and New York City remain the primary bastions of price stability and growth. Chicago saw a 0.4% increase in June and a 3.9% gain year-over-year. New York City, while dipping slightly by 0.1% in June, maintains a 3.8% year-over-year growth rate. These cities benefit from a different economic mix than the tech-heavy West Coast and the pandemic-boom towns of the Sun Belt. The return-to-office mandates and the relative value of these markets compared to the extreme highs of the Silicon Valley region have helped maintain a floor under prices.
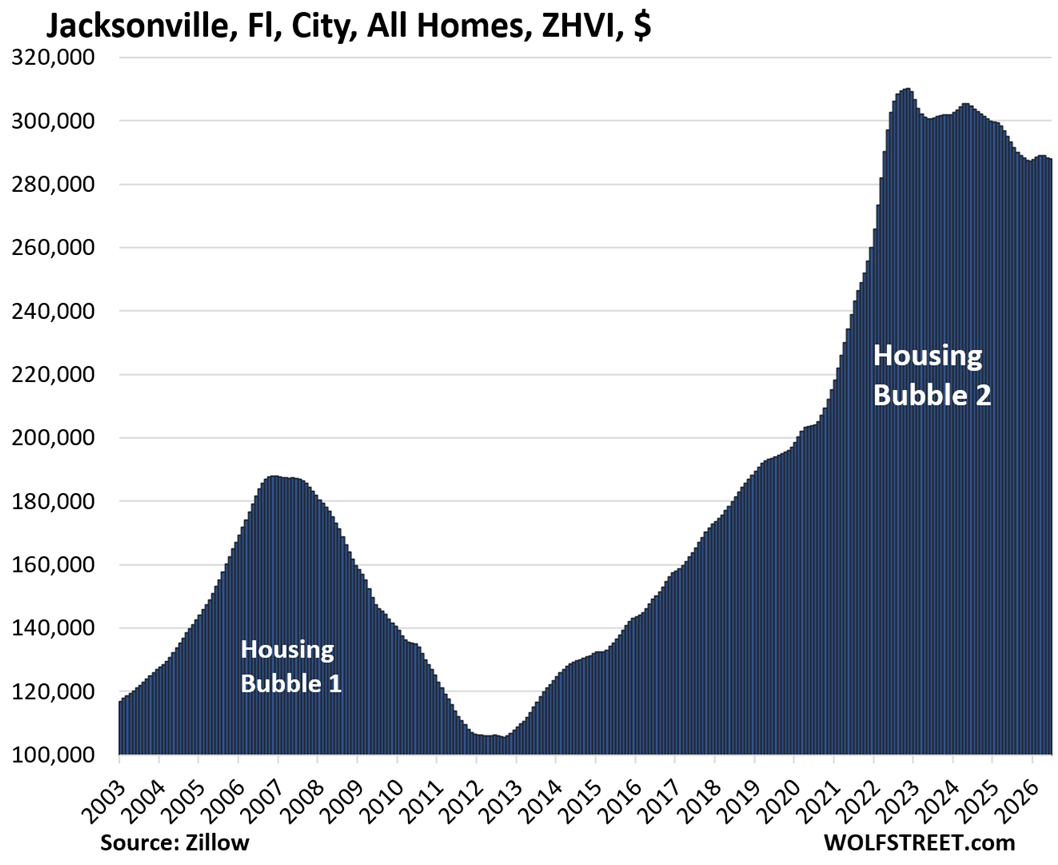
Other cities that had been consistently setting new highs, such as Philadelphia, Omaha, and Minneapolis, have recently seen their momentum stall. Philadelphia and Minneapolis both recorded month-to-month declines in June, suggesting that the price correction is finally reaching the more stable markets of the Midwest and Mid-Atlantic.
Methodology and Market Scope
The data cited in this report is derived from the seasonally adjusted three-month-average Zillow Home Value Index (ZHVI). This index is a backward-looking measure that incorporates millions of data points, including public records, Multiple Listing Service (MLS) data, and brokerage reports. It is uniquely comprehensive because it includes pricing data for off-market deals and for-sale-by-owner transactions, providing a more holistic view of market value than sales data alone.
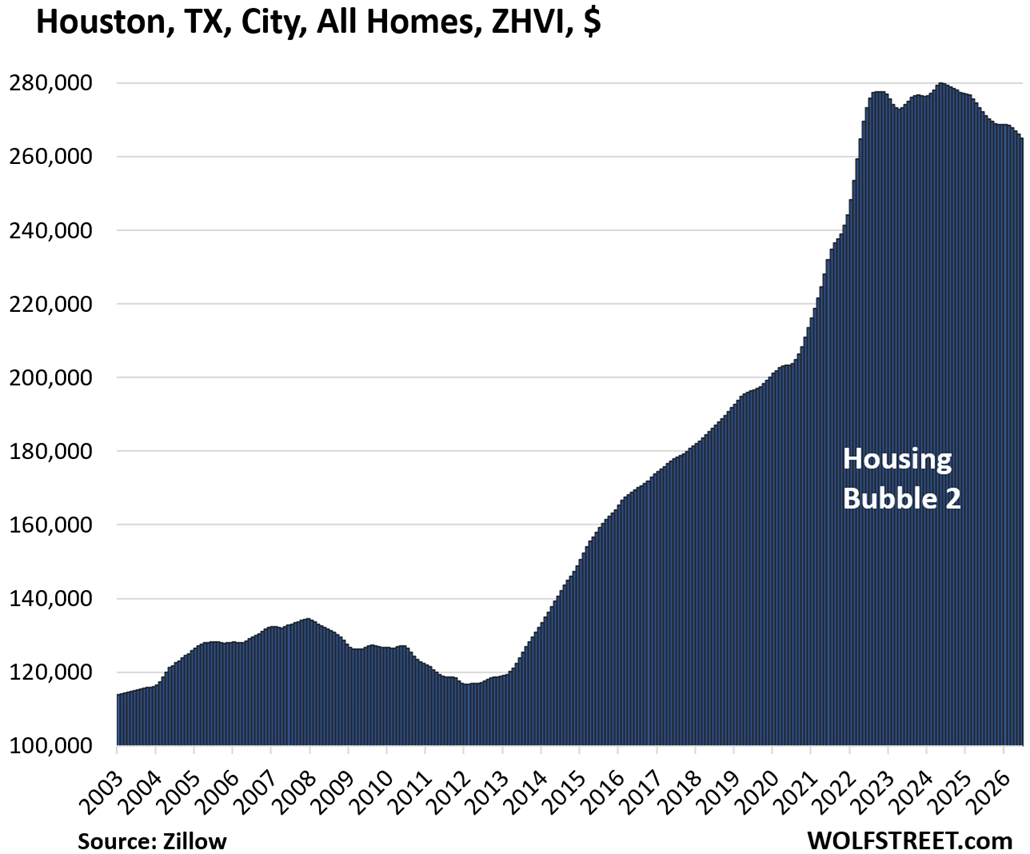
To be included in this specific analysis of "big and expensive" cities, a municipality must be among the largest by population and have a mid-tier ZHVI of at least $300,000. Many large U.S. cities, such as Houston and Philadelphia, were included due to their sheer size (fourth and sixth largest in the U.S., respectively), even if their average mid-tier prices are significantly lower than those in San Jose or Boston. Interestingly, in many American cities like Memphis, Oklahoma City, and Cincinnati, the mid-tier price has never reached the $300,000 threshold, illustrating the vast disparity in housing costs across the country. In these markets, a buyer can often purchase five homes for the price of a single mid-tier property in the San Francisco Bay Area.
Broader Economic Implications
The ongoing retraction in home prices carries significant implications for the broader U.S. economy. For many American households, home equity represents the largest component of their net worth. A sustained decline in prices, particularly in high-growth areas like Austin and Phoenix, could lead to a "reverse wealth effect," where consumers reduce spending as they perceive their primary asset to be losing value.
Furthermore, the "deep freeze" in sales volume—driven by high rates and a gap between seller expectations and buyer affordability—has impacted related industries. Mortgage originations are at multi-decade lows, and the home improvement and moving industries are seeing a corresponding slowdown.
As the supply of existing homes continues to rise—with condo supply reaching a 14-year high in some regions—the pressure on prices is expected to persist. Market participants are now closely watching the Federal Reserve for any signals of future rate cuts, which could potentially reinvigorate demand. However, until affordability is restored either through lower rates or further price declines, the U.S. housing market appears settled into a period of stagnation and gradual correction. The data from June confirms that the era of runaway price growth has ended, replaced by a complex landscape of regional volatility and a general retreat from the historic peaks of the early 2020s.