Statistical Arbitrage for Independent Traders: Mastering Networked Relationships for Enhanced Profitability

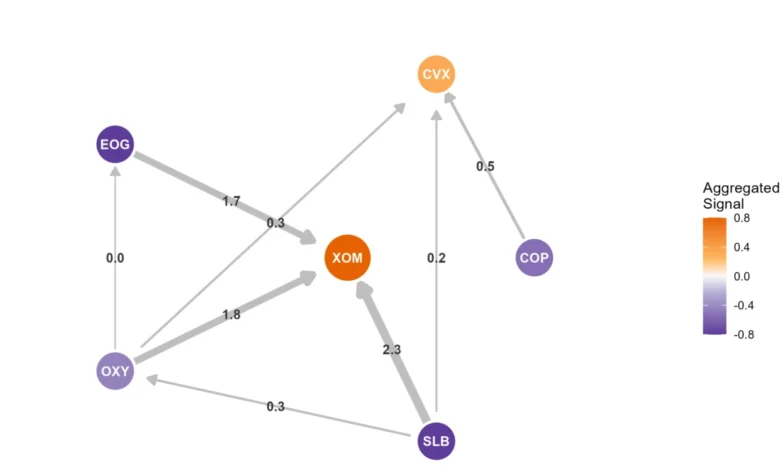
This installment, the fifth in a six-part series, delves into the sophisticated application of statistical arbitrage for independent traders, moving beyond traditional pair trading to explore the power of networked relationships and the "triangulated stat arb" approach. The previous discussion highlighted a discernible pattern within energy stock spreads, prompting an analysis of ExxonMobil (XOM) as a potential outlier. While XOM’s relationships with other energy stocks appeared stretched, indicating potential mispricings, this article explores the nuances of such observations and introduces advanced techniques for identifying and capitalizing on these market inefficiencies.
Unpacking the Triangulated Stat Arb Framework
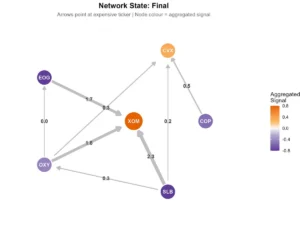
The concept of "triangulated stat arb" draws a parallel to navigational triangulation, where multiple bearings on landmarks converge to pinpoint a precise location. In financial markets, each inter-stock spread can be viewed as a "bearing," offering a directional signal about the relative valuation of two assets. A single spread suggesting that ExxonMobil (XOM) is overvalued, for instance, provides limited insight. It could be that XOM has appreciated while its peers have remained stable, or conversely, that its peers have declined, making XOM appear relatively expensive.
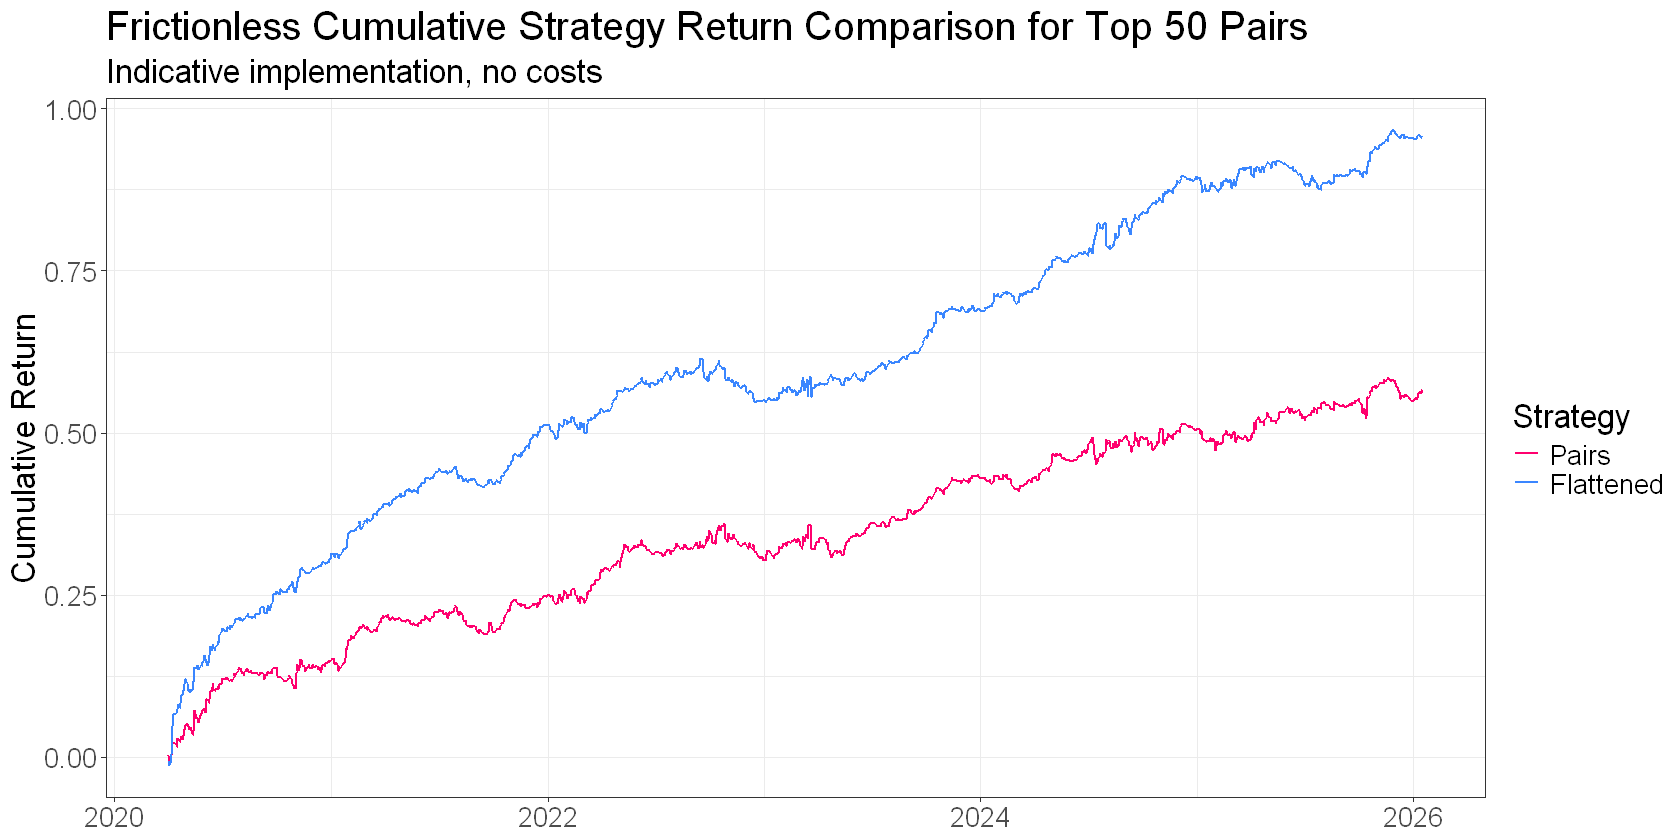
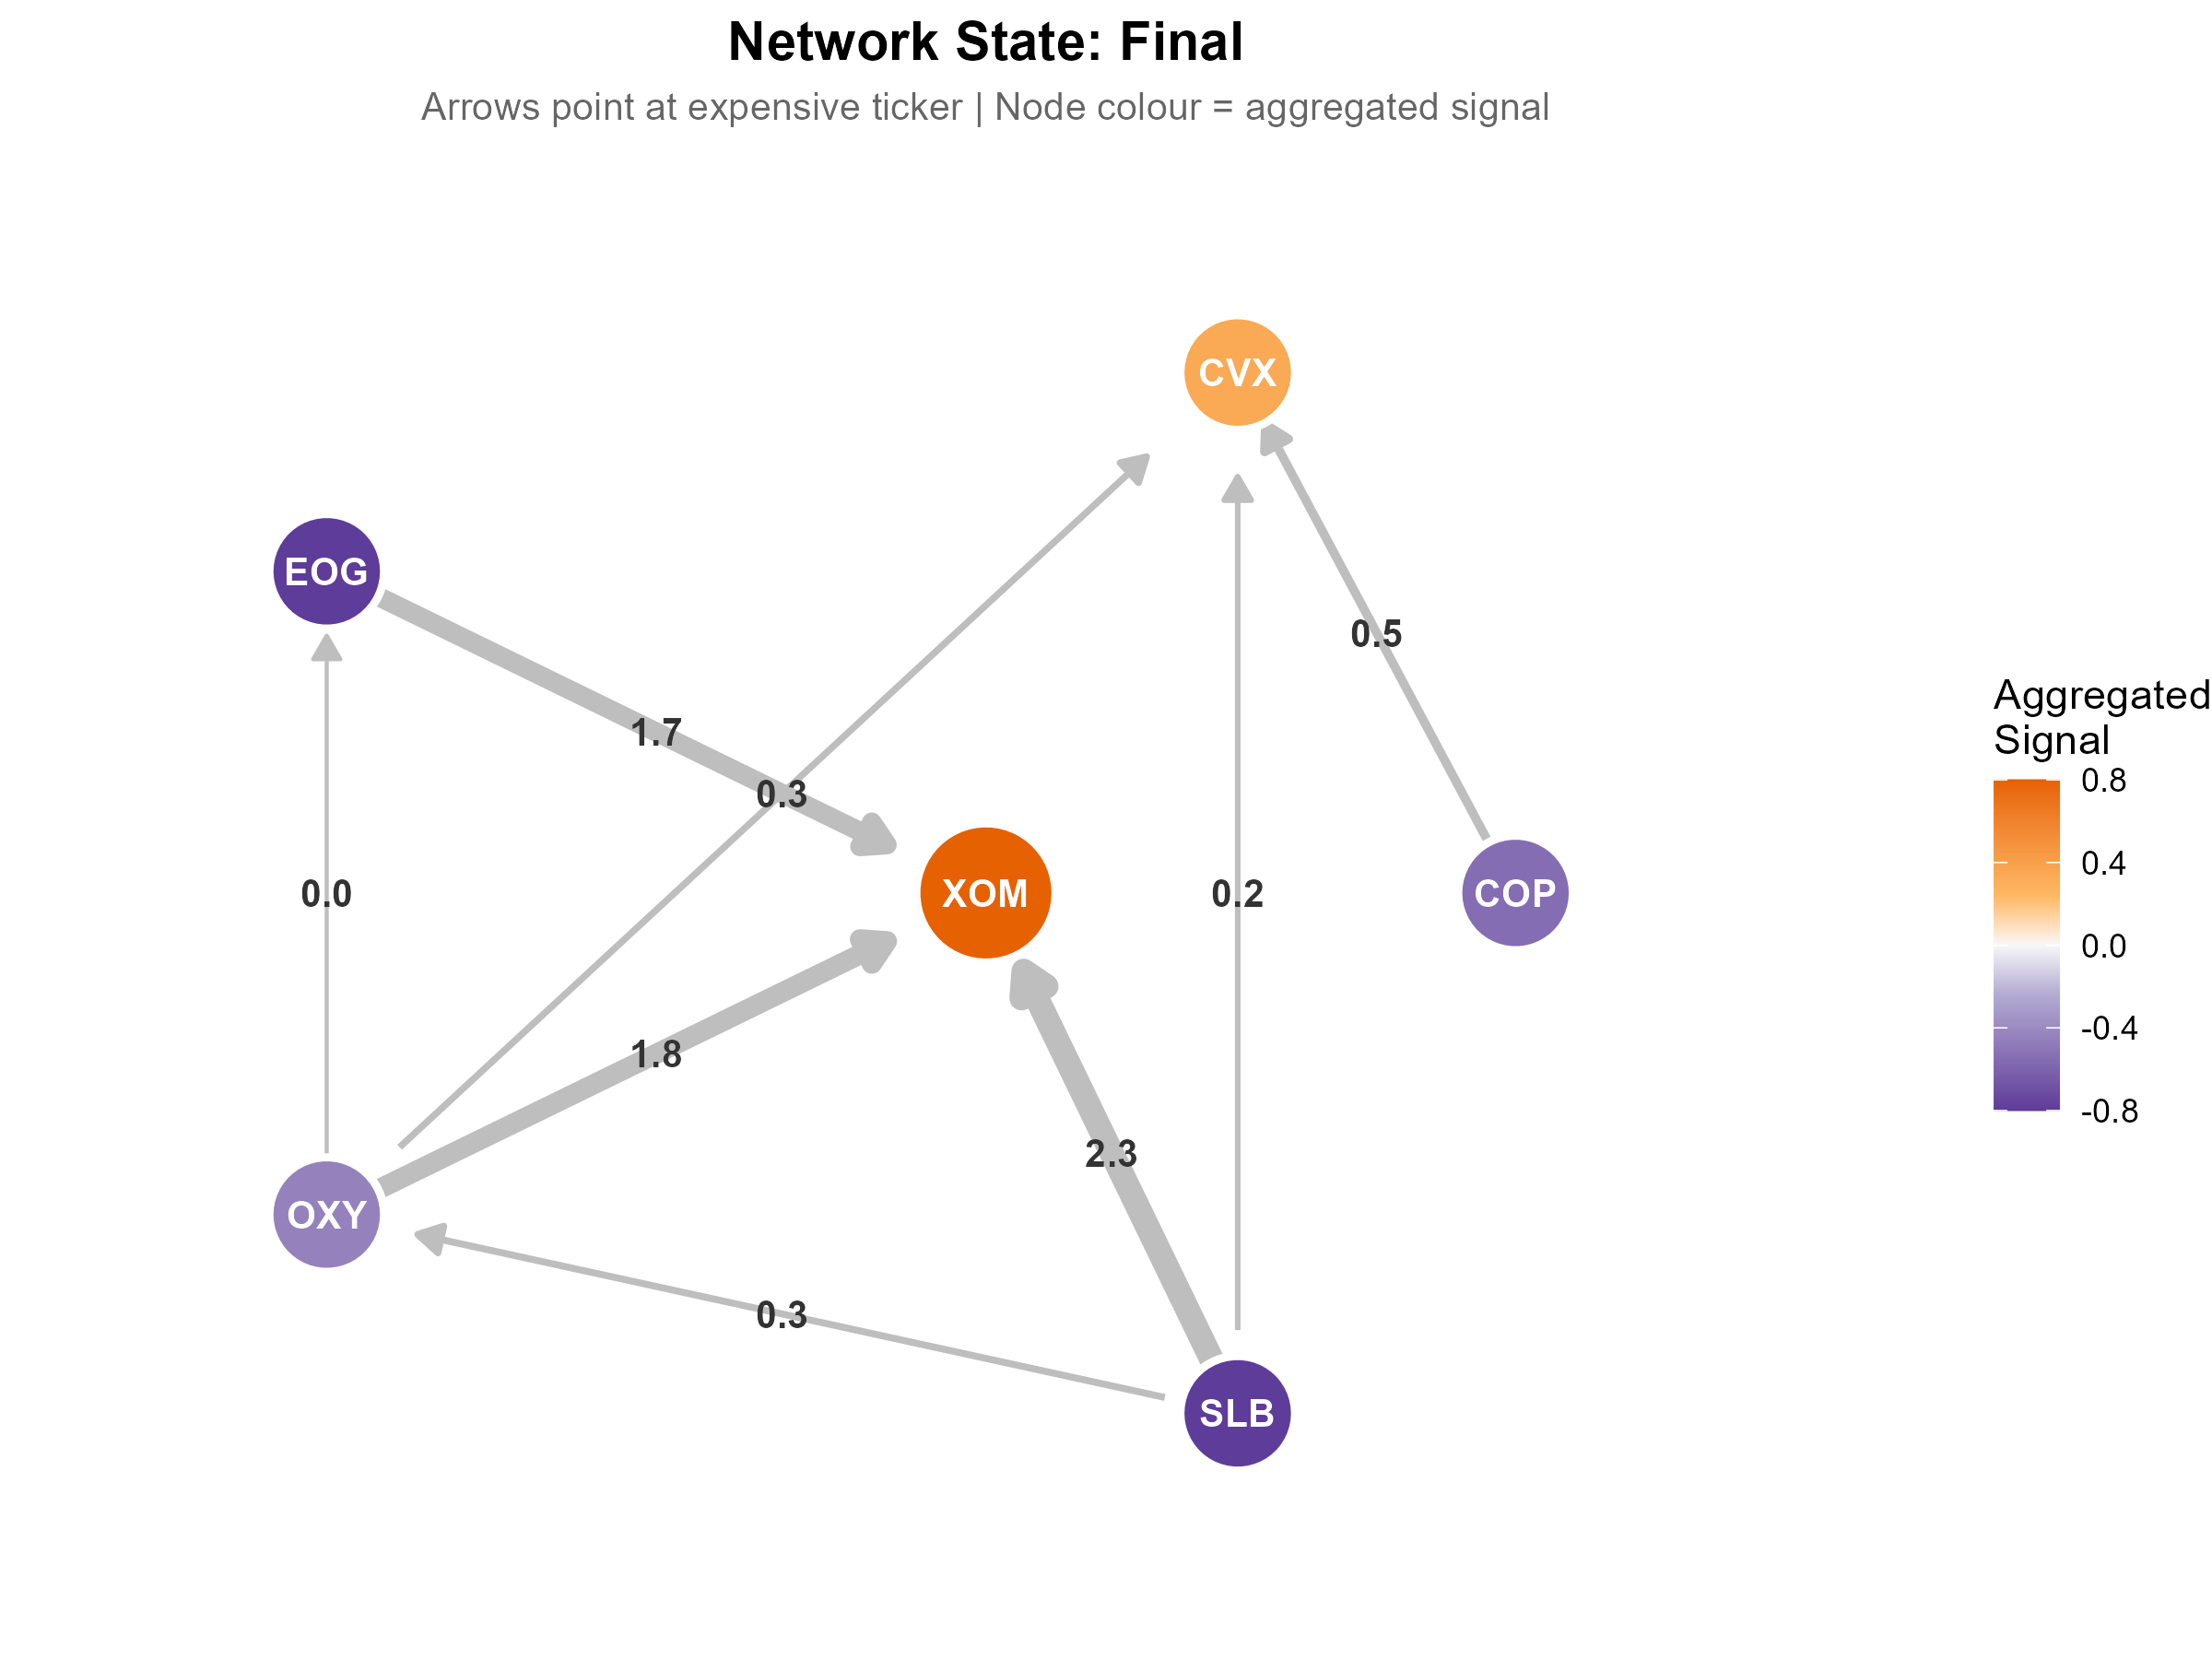
However, when multiple independent spreads consistently point towards the same ticker – for example, three distinct energy stock spreads all indicating that XOM is trading at a premium relative to its peers – the signal gains significantly more conviction. This convergence of signals, akin to obtaining multiple bearings in navigation, allows traders to identify a more robust "fix" on potential mispricings within a broader market network.
While traditional triangulation in navigation offers a definitive fix, its application in trading is not as absolute. It identifies the nexus where overlapping spread signals converge, indicating a cluster of perceived mispricings. However, it doesn’t inherently reveal the underlying cause of this dislocation, nor does it guarantee that the identified anomaly will resolve as anticipated.
From Individual Outliers to Portfolio-Level Insights
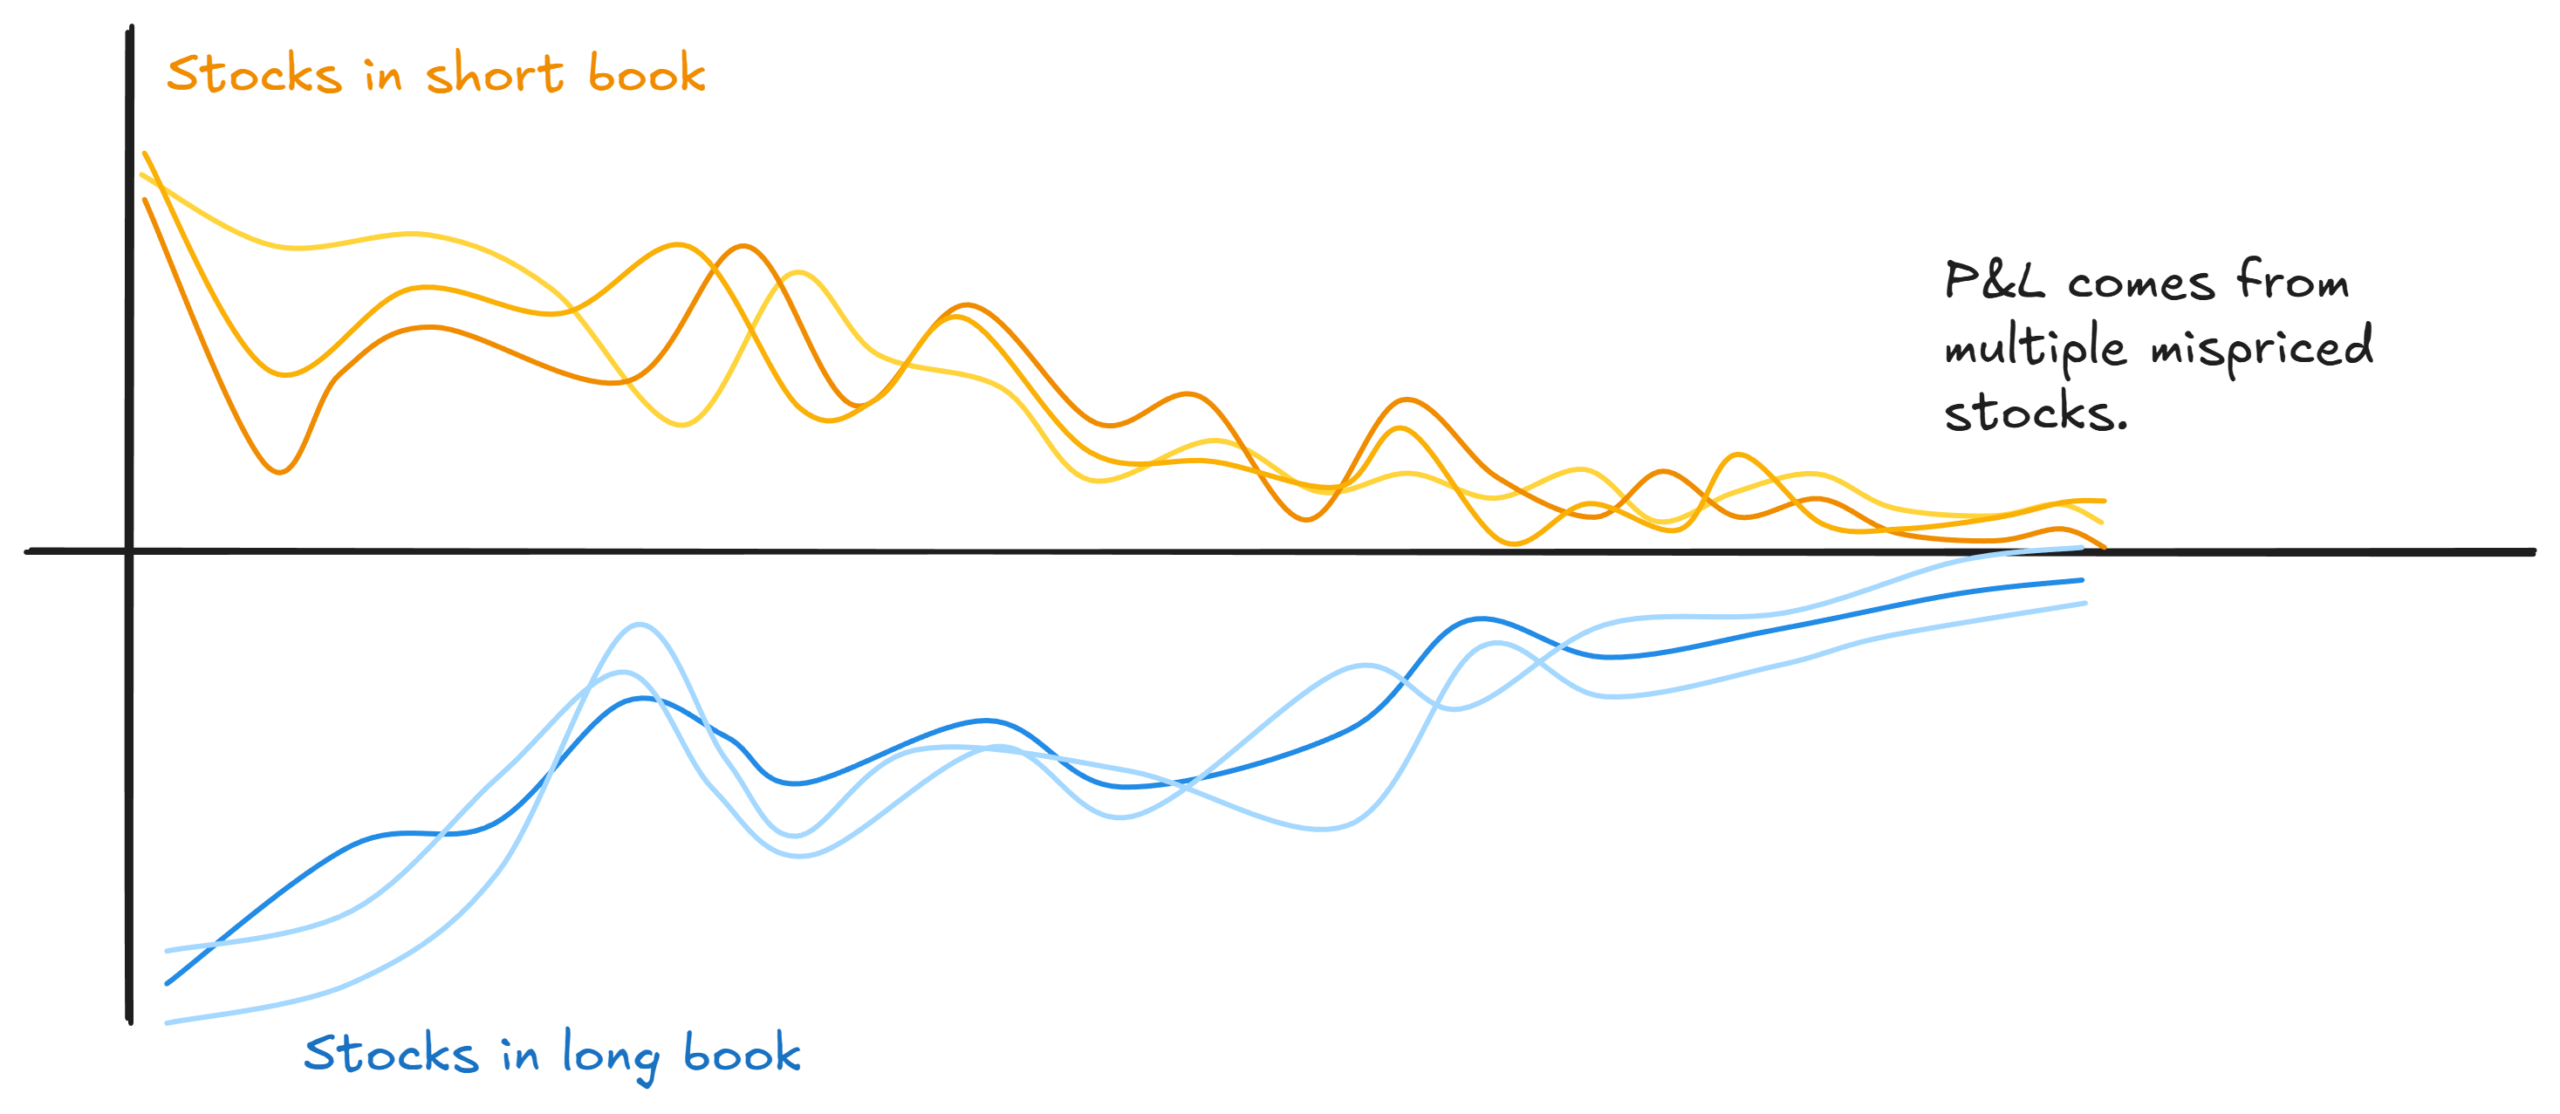
The XOM example, where all observed spreads consistently flagged it as an outlier, is illustrative but represents a simplified scenario within a small network. The true power of triangulated stat arb emerges when applied to a larger universe of stocks, potentially comprising dozens or even hundreds of interconnected entities. By aggregating and analyzing triangulation signals across this expansive network, traders can move beyond identifying isolated outliers to constructing a diversified portfolio of potentially mispriced "legs."
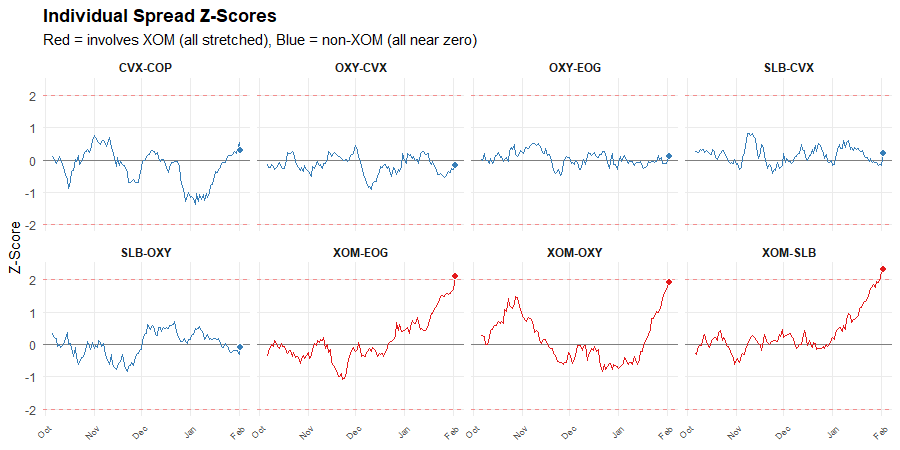
This sophisticated approach allows for the creation of a long book populated with assets identified as undervalued relative to their peers, and a short book composed of assets deemed overvalued. Each position within this framework is specifically targeted to capitalize on an apparent mispricing, unlike conventional pair trading where one leg of the pair often serves as a mere hedge rather than an active profit-generating opportunity. This contrasts sharply with traditional pairs trading, which, as previously discussed in Part 3, can result in a significant portion of the portfolio acting as passive hedges, diluting potential alpha.
The Power of Aggregation: Flattening as a Foundation
A surprising yet significant insight in this domain is the substantial benefit derived from the "flattening" process, which involves aggregating signals across multiple spreads. This statistical aggregation inherently tends to construct portfolios of mispriced assets. Stocks that are genuinely mispriced will exhibit this characteristic across numerous relationships, while random noise, which tends to be inconsistent, is naturally diluted. The outcome is a portfolio that is long assets identified as cheap across various interdependencies and short assets identified as rich.
This fundamental reframing—viewing spreads as evidence rather than direct trading instruments—provides a substantial enhancement. The core principle is that price-insensitive flows, a common driver of divergences, occur more frequently than genuine repricings due to fundamental shifts. By leveraging the law of large numbers through aggregation, traders can amplify the impact of these price-insensitive flows.
Quantifying Network Agreement: The Role of Consistency
While the aggregation of spread signals provides a powerful foundation, not all observed dislocations represent true mispricings; some may stem from genuine news impacting individual tickers. To refine the identification of the most reliable signals, the concept of "consistency" is introduced. Consistency directly measures the degree of agreement among the various spread signals pointing to a particular ticker.
This is calculated by converting each spread signal into a binary indicator (+1 for rich, -1 for cheap), averaging these signals, and then taking the absolute value of the mean. A high consistency score indicates that the network of spreads is in strong agreement about a ticker’s relative valuation. Conversely, low consistency suggests conflicting signals, which are more likely to be attributable to noise or less reliable market movements.
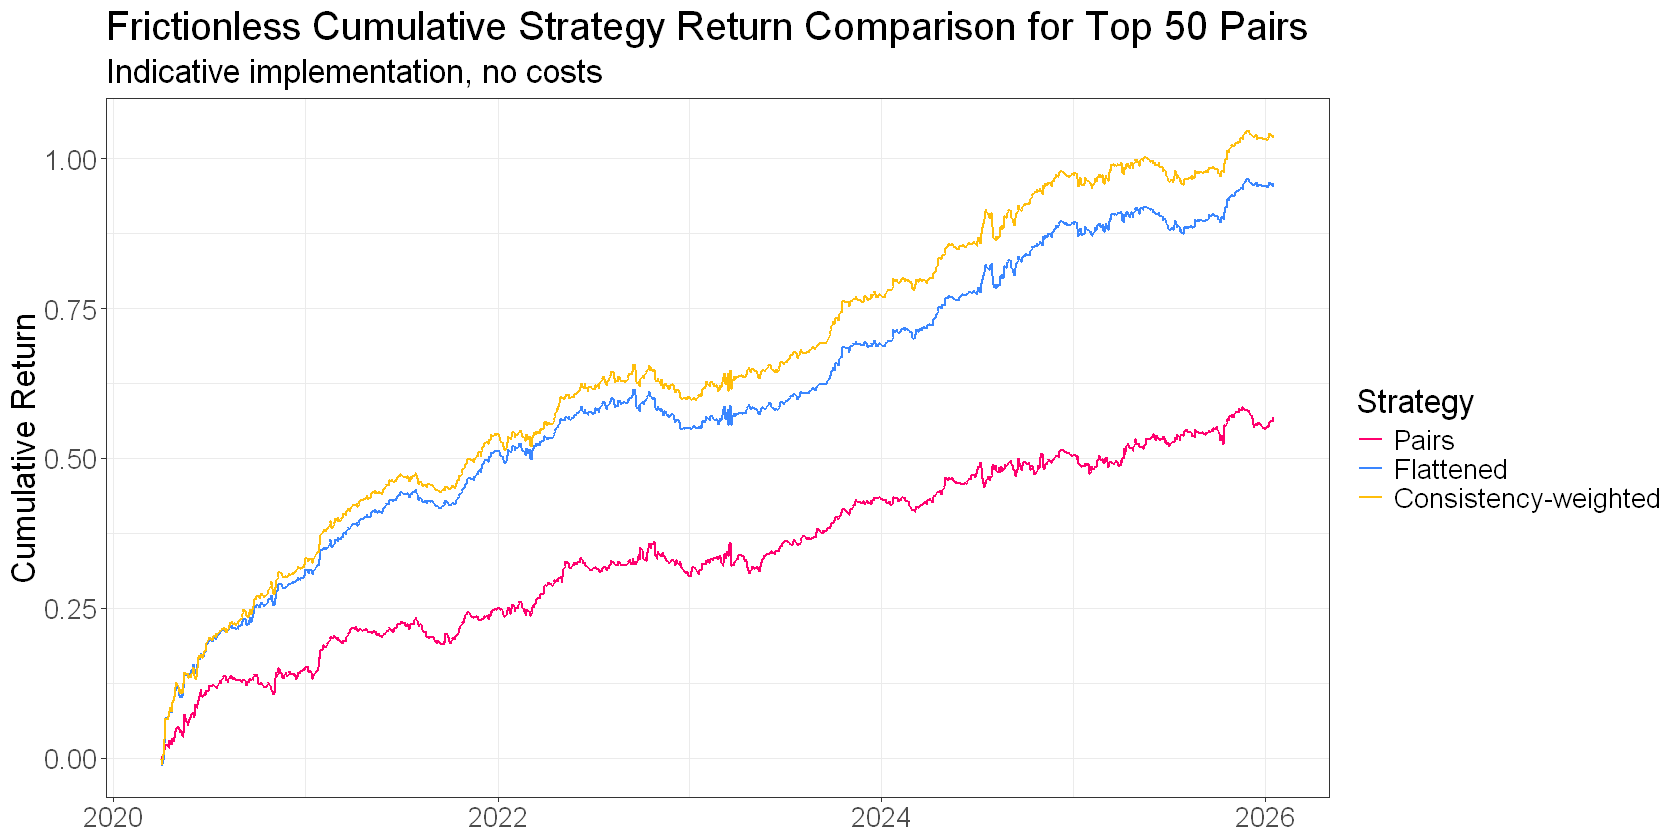
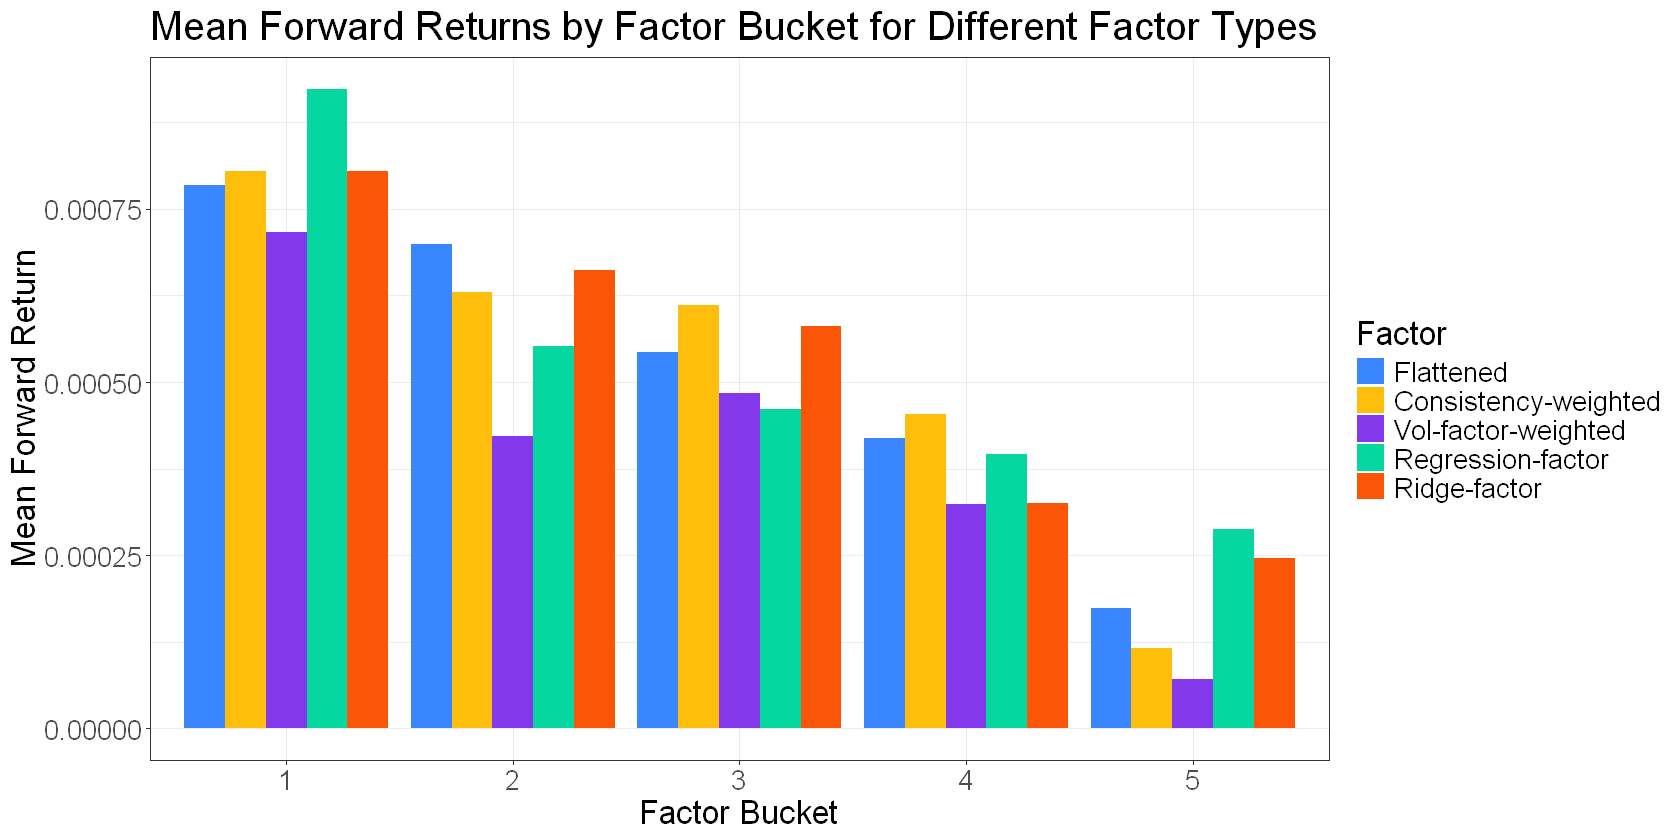
The importance of consistency lies in its ability to distinguish between a ticker that is genuinely mispriced and one that is merely a partner in a mispriced spread. A ticker with a strong average signal but low consistency might be the relatively stable component in a spread where its partner has moved significantly. In contrast, a ticker with a moderate average signal but high consistency suggests that multiple spreads are independently agreeing on its valuation relative to various peers, thus providing a cleaner and more reliable signal. Empirical testing has demonstrated that consistency-weighted signals outperform simple averages, indicating that this metric effectively enhances signal quality.
Distinguishing Mispricing from Repricing: The Critical Question
Returning to the XOM example, while triangulation might consistently identify it as an outlier, the critical unanswered question remains: Why is XOM the outlier?
One possibility is a temporary dislocation caused by price-insensitive flows, such as a large fund rebalancing its portfolio or a significant hedging operation. Such dislocations, driven by non-fundamental market activity, are expected to revert to their mean. This presents a trading opportunity.
Alternatively, XOM’s price movement could reflect a genuine repricing based on material news, such as an unexpected earnings surprise, a significant production update, or a regulatory change specifically affecting the company. In this scenario, XOM is not mispriced; the market has correctly adjusted its valuation based on new information.
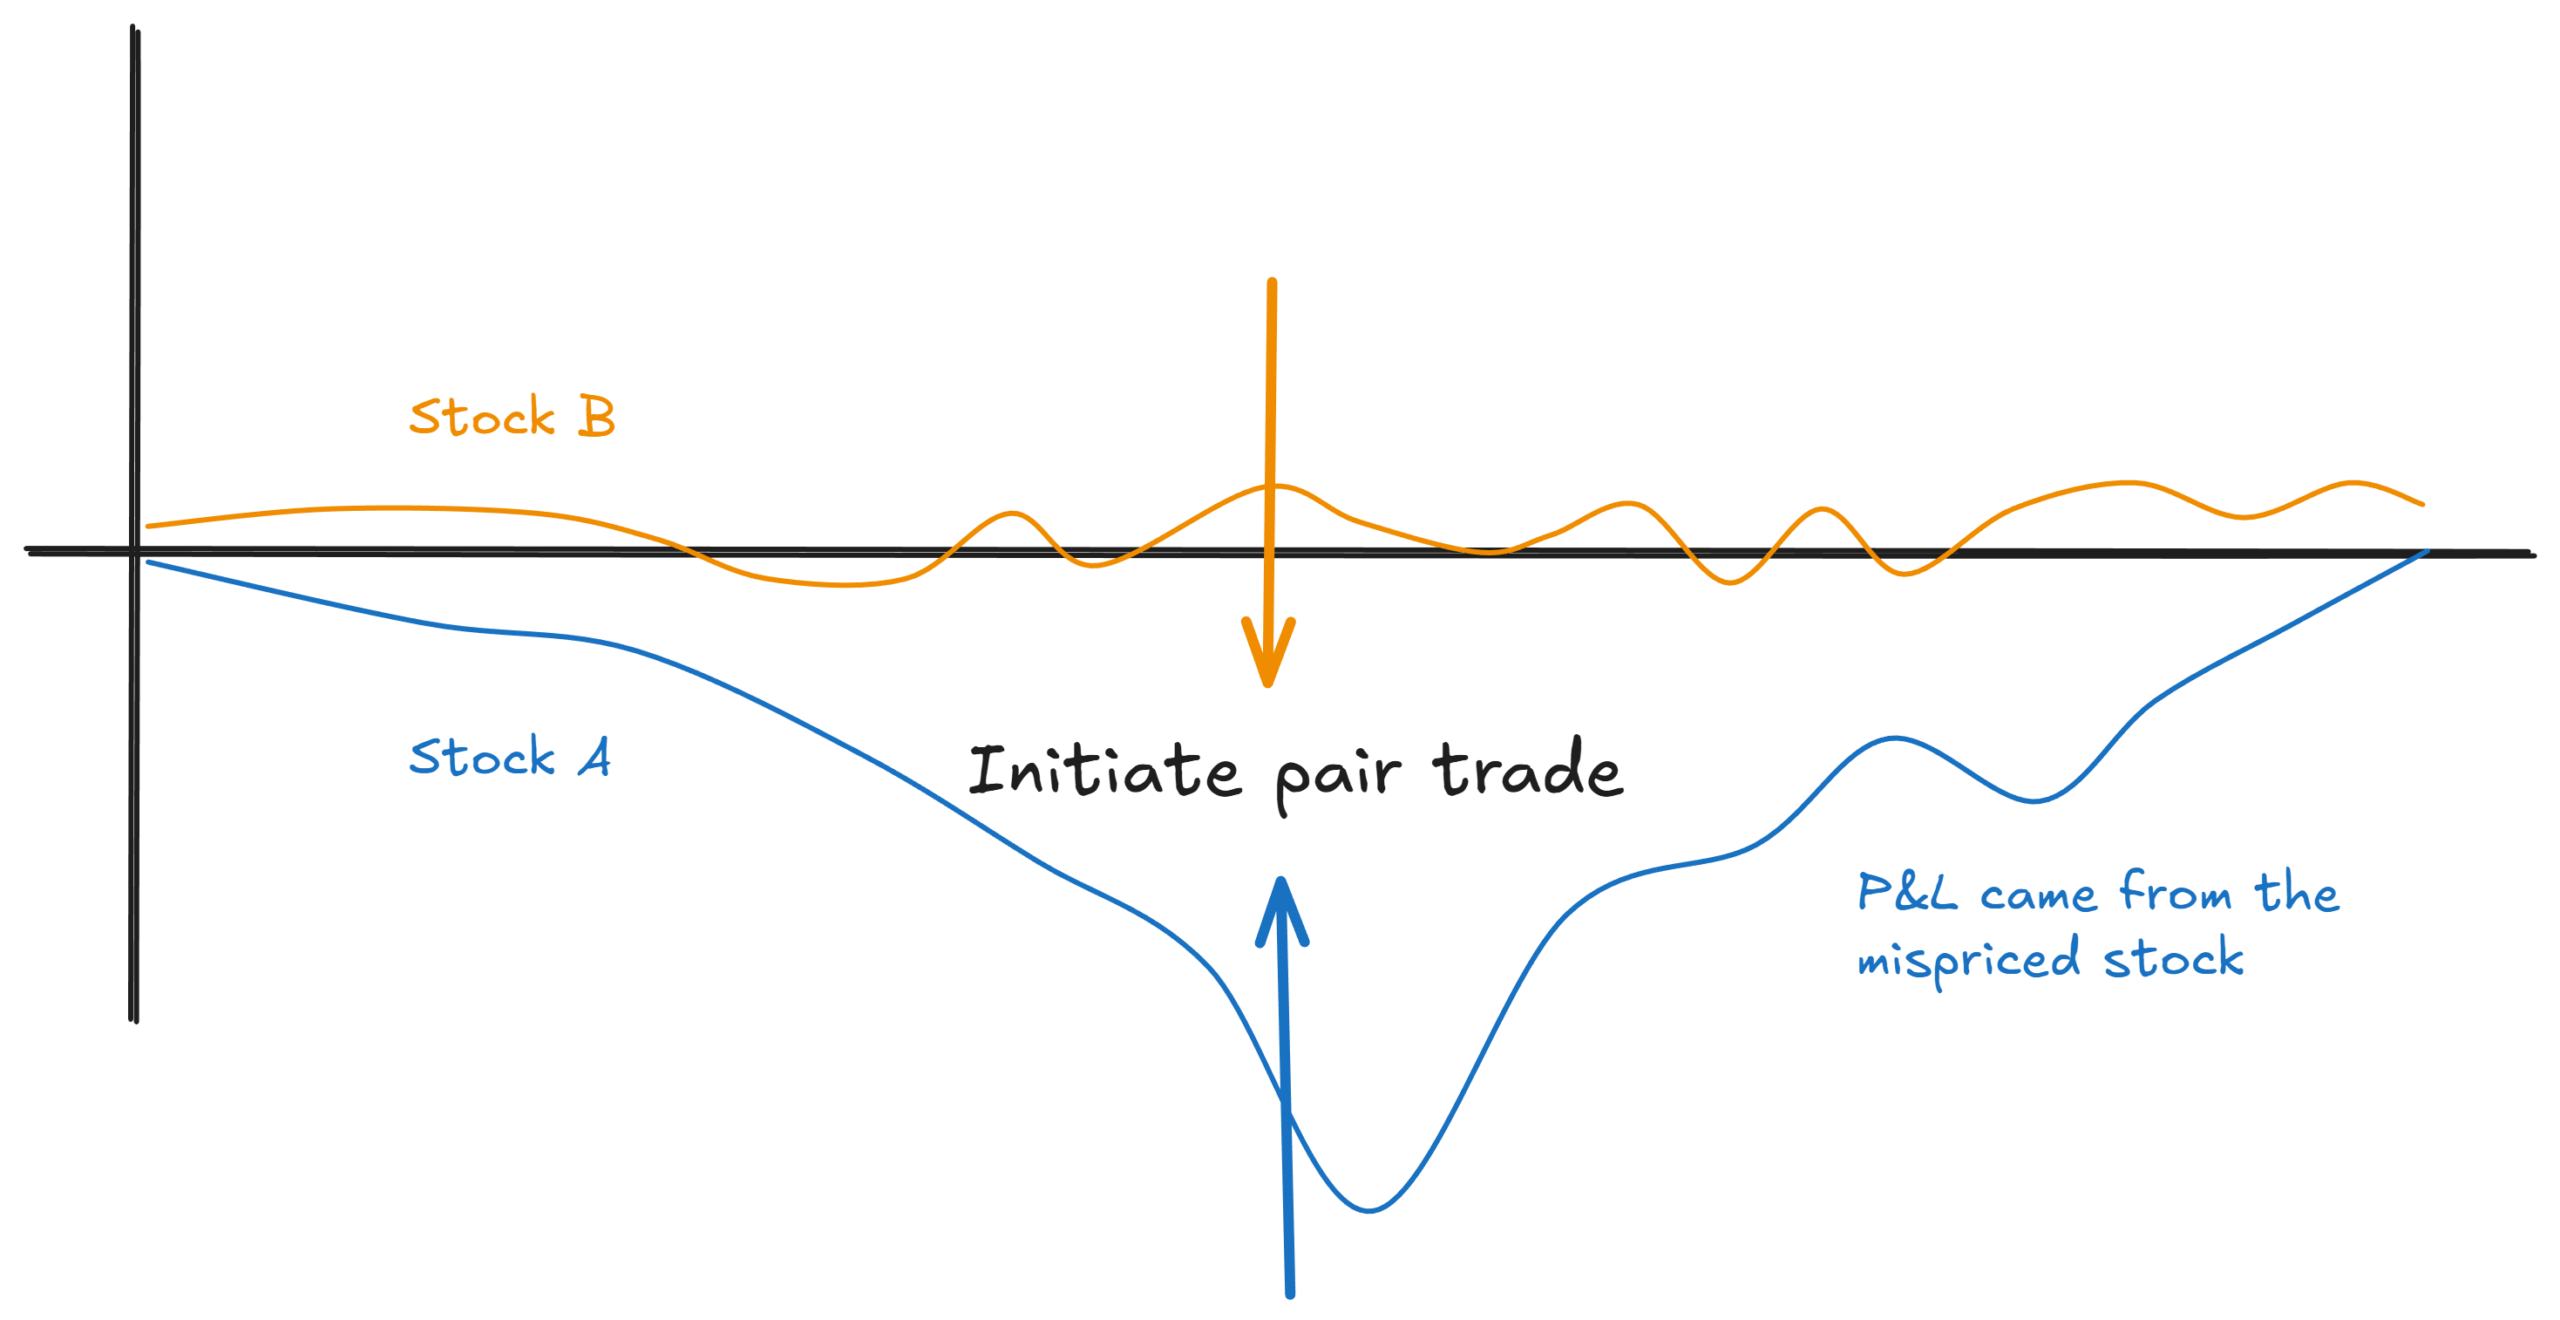
Both scenarios can manifest identically in statistical measures like z-scores. Triangulation can identify what the network perceives as mispriced, but it cannot definitively discern whether this perception is accurate. The efficacy of the strategy hinges on the quality of the selected pairs. If the chosen pairs exhibit a tendency to diverge and converge in predictable ways, the "base rate" of price-insensitive flows occurring more frequently than genuine repricings will favor the trader.
However, to move beyond this base rate and improve accuracy, traders can incorporate external indicators. These include:
- Earnings Surprises: Significant deviations from expected earnings can signal fundamental shifts.
- Idiosyncratic News: Company-specific events, such as product launches, management changes, or geopolitical developments affecting operations, can drive independent price movements.
- Volume Data: The pattern of trading activity surrounding a price dislocation can offer clues. A stock being pushed by price-insensitive flows might exhibit different volume characteristics compared to one repricing on substantive news.
By analyzing these supplementary factors, traders can better differentiate between temporary dislocations ripe for arbitrage and genuine repricings that should be avoided. This nuanced approach, while more complex, can significantly improve the success rate of trades and mitigate the risk of holding positions that fail to revert.
Advanced Network Analysis: Regression Factors and Signal Refinement
Further enhancing the triangulated stat arb framework involves sophisticated statistical modeling. The observed z-score of a spread ($zAB$) can be represented as the difference between the individual mispricing ("alpha," $alpha$) of the constituent tickers ($zAB = alpha_A – alpha_B$). The objective is to infer these ticker-level alphas from the observed spread z-scores.
This can be achieved through regression analysis, where ticker alphas are estimated to best explain the spread z-scores simultaneously. This process yields "regression factors" that quantify the estimated mispricing of individual assets within the network.
More advanced regression techniques, such as Lasso (which forces coefficients to zero) and Ridge (which shrinks coefficients towards zero), can be employed. These methods help concentrate the signal in fewer tickers, potentially leading to more concentrated and robust trading positions. The introduction of a "ridge regression factor" can refine the identification of key drivers within the network.
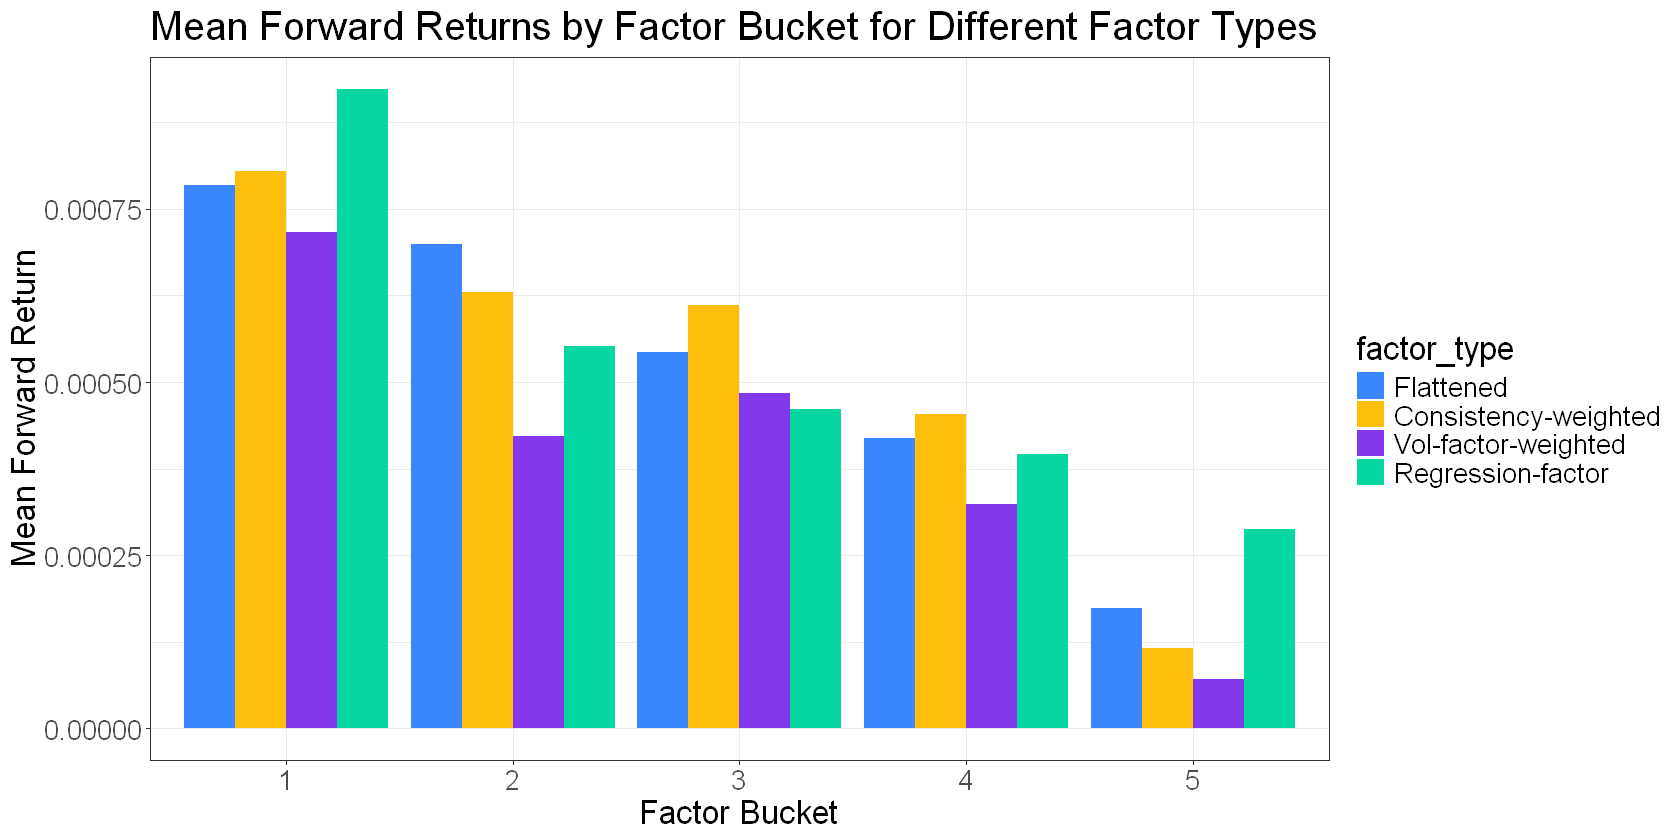
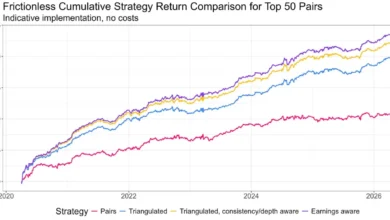
Comparative analysis of cumulative returns for various network-derived factors, including simple averages, consistency-weighted signals, regression factors, and ridge regression factors, reveals distinct performance profiles. While no single factor is universally "better," they offer different trade-offs in terms of turnover, decay rates, and position concentration. The most significant performance leap, however, is often observed in the transition from traditional pair trading to a "pairs to portfolio" approach, underscoring the fundamental advantage of network-based analysis.
The Three Pillars of Successful Statistical Arbitrage
The overarching strategy for successful statistical arbitrage, as developed across this series, can be distilled into three critical pillars:
-
Finding Good Pairs: This foundational step involves identifying spreads that possess a statistically sound propensity to diverge and converge in a tradeable manner. Rigorous selection pipelines, as explored in Parts 2 and 3, are paramount. Without high-quality pairs, subsequent analytical steps will yield diminished results.
-
Identifying Mispriced Legs: This stage leverages the triangulated stat arb methodology. By flattening spread signals into ticker-level indicators and using metrics like consistency, traders can build portfolios where every position targets an apparent mispricing. This pairs-to-portfolio transformation offers a significant enhancement in performance and capital efficiency, albeit with increased complexity.
-
Separating Mispricing from Repricing: This advanced step involves employing external data, such as volume analysis and news sentiment, to differentiate between temporary dislocations and genuine fundamental repricings. While challenging, successfully avoiding genuine repricings can lead to another substantial improvement in performance, acting as the "icing on the cake" for an already robust strategy.
Each of these components contributes to the overall success of the strategy, with good pairs forming the bedrock. Triangulation and consistency refine the insights derived from these pairs, while volume and news analysis serve to mitigate risks associated with persistent divergences. Achieving optimal results requires mastering all three pillars, a task that involves navigating numerous subtle complexities inherent in each stage. The subsequent installment will explore the practical implementation of a comprehensively resourced approach across all three key areas.