The Illusion of the Optimal Backtest: Why Parameter Permutation is Essential for Quantitative Trading Strategy Robustness

In the fast-paced and data-driven world of quantitative finance, the pursuit of the ultimate backtest has long been the holy grail for algorithmic traders and institutional portfolio managers alike. For decades, retail participants and quantitative researchers have relied heavily on historical optimization to unearth high-performing trading strategies. Yet, a persistent paradox continues to plague the industry: systems that boast extraordinary historical backtests frequently experience catastrophic failure the moment they are deployed with live capital. According to industry veterans and quantitative software developers, the root cause of this widespread phenomenon is not necessarily a flawed market hypothesis, but rather an over-reliance on fragile, over-fitted parameters.
The core vulnerability in traditional backtesting lies in how traders evaluate optimization outputs. A common mistake is asking whether a specific numerical setting—such as a 14-period Relative Strength Index (RSI)—works in isolation. In reality, a genuine market inefficiency should not abruptly vanish simply because a single parameter is marginally altered. Quantitative experts argue that the critical question is not whether an isolated N-period configuration succeeds, but whether neighboring settings—such as N-1, N+1, or variations within a designated percentage range—yield statistically similar performance outcomes. If a trading strategy relies exclusively on one exact numerical setting to remain profitable, it is highly susceptible to curve-fitting, effectively memorizing historical noise rather than capturing a repeatable structural edge.
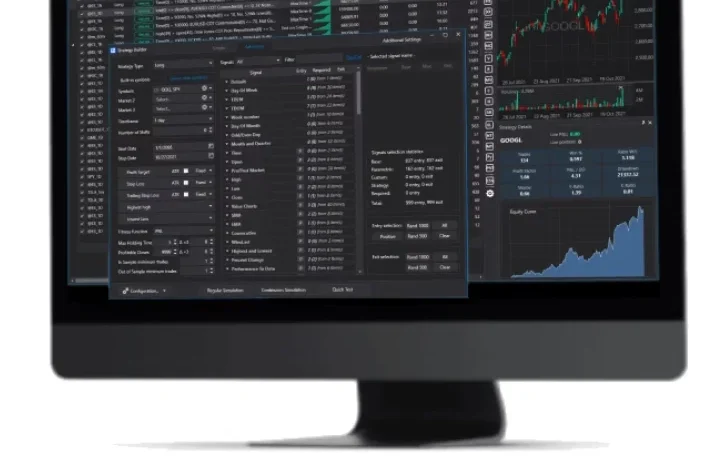
To address this systemic risk, quantitative researchers have increasingly turned to stress-testing methodologies designed to measure strategy stability. One of the most effective and accessible diagnostics in this domain is the Parameter Permutation Test. Originally popularized within advanced algorithmic development frameworks and formalized by quantitative platforms like Build Alpha, this test evaluates a strategy across a spectrum of minor parameter adjustments. By systematically altering core variables by a defined margin—typically plus or minus ten percent—and analyzing the resulting performance distribution, traders can differentiate between fragile mathematical anomalies and robust market edges.
The mechanics of the Parameter Permutation Test are rooted in optimization surface analysis. When a strategy is optimized across multiple variables, the resulting performance metrics form a multi-dimensional landscape comprising hills, valleys, ridges, and cliffs. Within this landscape, two distinct topological features frequently emerge: the fragile spike and the robust plateau.
A fragile spike is characterized by a single, isolated peak of high performance surrounded by steep drop-offs. In this scenario, altering a parameter by even a fraction of a percent causes the strategy’s profitability to collapse. This configuration indicates severe curve-fitting, where the algorithm has successfully reverse-engineered past price action without identifying an underlying economic rationale. Conversely, a robust plateau represents a broad, stable region where numerous neighboring parameter combinations produce consistently favorable results. The existence of a plateau suggests that the underlying market inefficiency is genuine, enduring, and resilient to minor measurement variations or slight shifts in market microstructure.
David Bergstrom, founder of Build Alpha and a veteran quantitative strategist with a background in high-frequency trading and market making, emphasizes the necessity of prioritizing stability over raw backtest optimization. Reflecting on years of strategy development for hedge funds, commodity trading advisors (CTAs), and family offices, Bergstrom notes that experienced practitioners are often willing to forgo peak backtest profitability in exchange for heightened production robustness. This philosophical shift challenges the conventional wisdom that the highest historical return metric is inherently the best choice for live deployment.
Implementing the Parameter Permutation Test in a modern quantitative research workflow involves establishing a systematic protocol for neighborhood evaluation. In practice, a ten percent variation threshold serves as a reliable industry standard across various parameter types. For integer-based variables, such as a 14-period RSI, a ten percent adjustment evaluates neighboring integers like 13 and 15. For continuous variables, such as a 200-point stop loss, the test examines a range spanning approximately 180 to 220 points. For percentage-based filters, such as a two percent breakout threshold, variations might range from 1.8 to 2.2 percent.
By running simultaneous permutations across all strategy parameters, developers can visualize the entire family of equity curves. When these curves cluster tightly together around a central median, a plateau is confirmed. When the curves disperse widely or reveal a deep negative tail, the strategy is flagged as unstable.
Industry analysts have identified three primary failure modes during parameter permutation evaluations that should prompt immediate strategy rejection. The first pathology is a wide dispersion of equity curves across neighboring parameters, indicating extreme sensitivity to minor configuration changes. The second failure mode occurs when the chosen backtest result sits anomalously high above the median of the permutation distribution, signaling that the optimization algorithm merely captured a statistical outlier driven by historical noise. The third pathology involves a permutation distribution where the median or the 25th percentile is entirely unprofitable, demonstrating that the vast majority of the parameter neighborhood loses money and that only the single "lucky" setting survived.
Historically, identifying these failure modes required tedious manual inspection, with quantitative researchers clicking through individual strategy reports one by one. However, the exponential growth in computing power and the rise of automated strategy generation platforms have necessitated more efficient screening mechanisms. Modern algorithmic pipelines now incorporate parameter permutation evaluations directly into automated sequence workflows.
Within these advanced systems, parameter permutation functions as an automated advanced filter. Developers can establish strict criteria—such as minimum profitability thresholds for the median permutation or maximum acceptable variance limits—allowing the software to screen out thousands of substandard strategy candidates automatically before they ever reach human review. This automated gating process significantly reduces the risk of human confirmation bias, wherein a trader might overlook structural weaknesses simply because an isolated backtest Sharpe ratio appears visually impressive.
Beyond simple binary rejection, advanced quantitative frameworks utilize noise-adjusted optimization to integrate robustness directly into the strategy generation phase. Rather than optimizing parameters against a single, static historical price series, noise-adjusted frameworks evaluate candidate settings across multiple stochastically perturbed variations of the underlying data. The optimizer then selects parameters that demonstrate consistent performance across all noise-adjusted paths. This methodology forces the search algorithm to hunt for generalizable economic processes rather than memorizing exact historical price sequences, effectively baking parameter plateaus into the strategy from its inception.
Furthermore, sophisticated portfolio managers have begun leveraging parameter plateaus not merely as a validation hurdle, but as a mechanism for internal diversification. Once a genuine plateau has been verified, a trader is not restricted to selecting a single point from that region. Instead, multiple parameter settings from the same stable plateau can be deployed simultaneously, with each configuration operating as an independent micro-strategy within a localized portfolio.
Because neighboring parameters share similar long-term expected returns while exhibiting slightly divergent short-term execution paths, aggregating them helps smooth out local market noise. When one parameter setting encounters a challenging market regime, an adjacent setting often compensates, resulting in a composite equity curve that maintains the expected return of the plateau while materially reducing variance and drawdowns.
The integration of parameter permutation testing into broader quantitative validation pipelines highlights a fundamental evolution in risk management. While other institutional-grade stress tests—such as Monte Carlo permutation for sequence risk, noise tests for bar-by-bar price sensitivity, random entry baselines, and walk-forward analysis for out-of-sample stability—target distinct failure modes, parameter permutation remains one of the fastest and most intuitive diagnostics available.
Ultimately, the broader adoption of parameter permutation and plateau analysis reflects a maturing industry consensus. As financial markets grow increasingly competitive and susceptible to algorithmic noise, the traditional emphasis on maximizing historical performance metrics is rapidly giving way to rigorous stability analysis. By systematically rejecting fragile optimization spikes in favor of robust, wide-ranging plateaus, quantitative developers can bridge the notorious gap between backtest theory and live production reality, fostering strategies that are structurally equipped to navigate the uncertainties of modern financial markets.